Feature Switch
You can enable (or activate) configured features and languages for your organization from the DataPortal Administration menu.
Note
The Feature Switches functionality (including the configured features) is not available out-of-the-box and must be implemented for each organization specifically.
Feature Management
To open the Features management panel for an organization:
-
Select Settings > Administration > Organization Structure from the expansion menu to open the Admin page.
-
Select the organization where you want to set feature access for.
-
Select Features from the Administration Menu from the Top Menu Bar.
-
After configuring the features, click Apply.
| Item | Description |
|---|---|
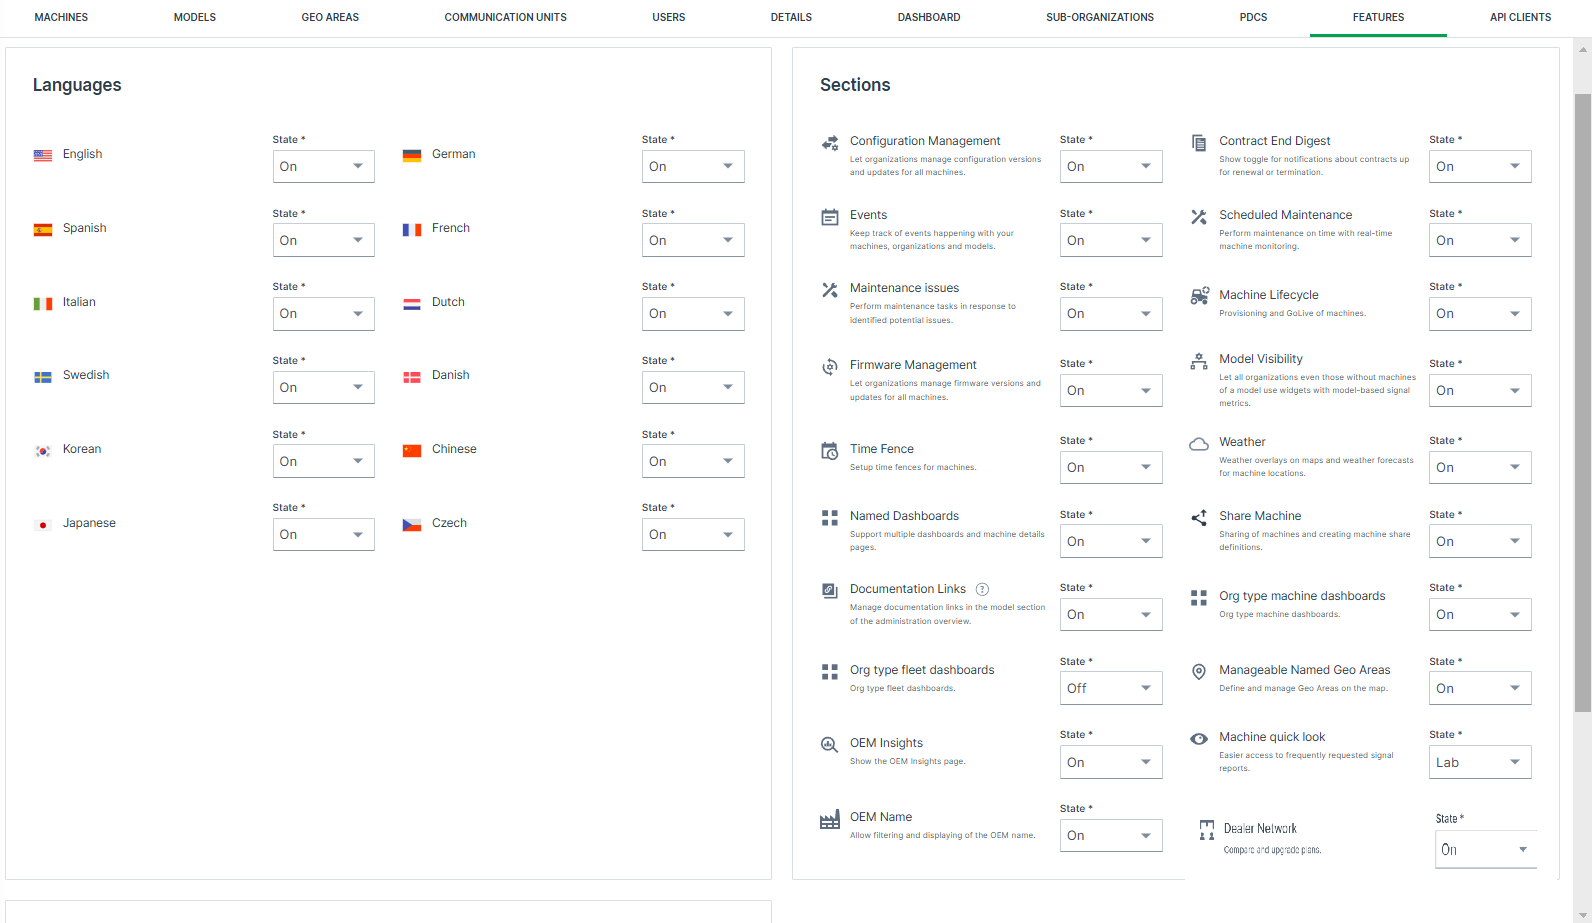
| Languages* | Lists the languages available to your organizations in the DataPortal, see Available Languages. |
| Sections | Displays the features available to your organization, see Available Features. |
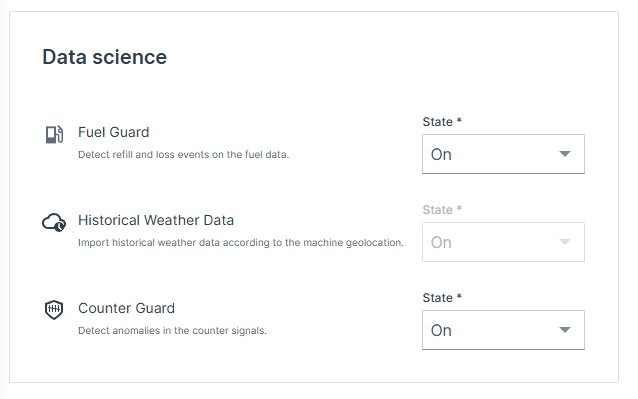
| Data Science | Data operations features that analyze a condition (e.g. counter units, fuel level) and trigger events based on data operations, see Available Features. |
| For each language or feature, you can configure the State: | |
| State | On: All users in the organization and sub-organizations have access to the feature. Lab Mode: Only users with Lab Mode enabled from user preferences can access the feature/language. Off: Access to these features is disabled and the page/language option does not appear in the DataPortal. |
Note
* Enabling a language requires that the translations are available in the PDC and DataPortal.
Available Languages
Enable or disable configured languages for the DataPortal (English cannot be disabled)
The users can then change the language on the Login Page or Personal User Settings.
You can choose from the following languages:
-
English
-
German
-
Chinese*
-
Czech*
-
Danish*
-
Dutch*
-
French
-
Italian
-
Japanese*
-
Korean*
-
Spanish
-
Swedish*
Note
*Those languages cannot be added by default, but must be requested first to be enabled by Proemion.
It should be noted that implementing those and other new languages requires additional Proemion resources including project setup, manual configuration, recurring services which may result in additional costs.
Contact your Sales representative at Proemion.
Available Features
The table below provides a link and description to the documentation of features that are available via the Feature Switch functionality.
Enable or disable the configured features for the DataPortal.
Note
If you want to make use of a feature that is listed here but not in the feature switch section of your account, Proemion may need to activate it first for your organization
Create a ticket at the Service and Support or contact your Proemion representative.
| Feature | Description |
|---|---|
| Events | Visualizes events details (such as timestamp, machine, etc.) captured by the data platform. |
| Maintenance Issues | For maintaining machine service tasks based on unscheduled maintenance issues inbetween service cycles. |
| Scheduled Maintenances | For maintaining machine service tasks based on service cycles. |
| Machine Lifecycle | Allows you to provision and activate the machine. |
| Time Fence/Timetable | Allows you to define a schedule for when a machine is permitted to be in use. |
| Firmware Management | Enables monitoring and updating of the installed firmware versions on the available communication units. |
| Configuration Management | Enables monitoring and updating of the installed configuration versions on the available communication units. |
| Weather | Visualizes the weather forecast details as a map overlay or in tabular format for the current location of a machine. |
| Named Dashboards | Create multiple dashboards for different user groups or different time periods (e.g. last 7 days or last 30 days). |
| Share Machine | Allows you to open access to your machines to DataPortal users outside your organization. |
| Model-Based Signals Visibility | Enable Model-Based Signals visibility in the DataPortal and as a base for the DataScience feature. See DataScience Manual → "Model-Based Signals". |
| Contract End Digest | Display the toggle in the Notifications menu for enabling contract end notifications. |
| OEM Name | Allows you to enable OEM name (display machine data, machines filter) globally for machines in your fleet. |
| Documentation Links | Allows to configure links to external documents and resources for each model. The defined links are shown on the Machine Master Data widget on the machine detail page. Please be aware that existing links at the Machine Master Data will be overwritten by model based document links. |
| Org type machine dashboards | Configure layouts for dashboard and specify their visibility according to the organization type. |
| Manageable Named Geo Areas | Create geo areas for custom DataPortal features. |
| OEM Insights | Analyze aggregated data of your users and machines in different charts. |
| Data Analytics Instances | Get insights on the data collected from the machines. See DataScience Manual → "Data Analytics". |
| Fuel Guard | Detect refill and loss events for fuel signal data. See DataScience Manual → "Fuel Guard". |
| Counter Guard | Detect inconsistencies (as events) in counter signal data. Relevant for the features listed in DataScience Manual → "Counter Guard". |
| Historical Weather Data | Import historical weather data according to the machine geolocation. See DataScience Manual → "Historical weather data". |
Warning
As of June 1st, 2025, the Historical Weather Data feature has been temporarily deprecated. If you're interested in accessing this feature, please contact our Sales Team to explore options.
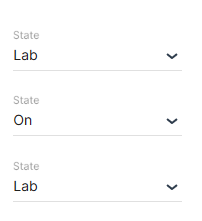
Lab Mode Activation
Beta (or trial) access to new DataPortal features for users in an organization is activated via Lab Mode. However, users must separately enable the lab mode in their personal settings to use the activated feature/language, see Lab Mode.
To enable a feature for the organization, toggle the status for a feature to Lab as shown:
OEM Name Feature
When the OEM Name feature is enabled, machines can be filtered by OEM name in supported features and widgets.
Enabling this feature allows filtering machines by OEM name in the following areas:
| Feature/Menu Item | Module/ Column | Filter? Y/N | Navigation |
|---|---|---|---|
| Machines Management | Y | Settings > Administration > Organization Structure > Machines tab | |
| Models Management | N | Settings > Administration > Organization Structure > Models tab > New machine model dialog > Machines > Select machine | |
| Machine List | - | Y | Machines > Machine list widget |
| Maintenance | - | Y | Maintenance > Filter > Machine |
| Events | - | Y | Events > Filter > Machine |
| Assignments | - | Y | Assignments > Filter > Machine |
| - | Y | Assignments > Create new assignment > Machines | |
| Reports | Maps | Y | Reports > Maps > Configure maps > Select machine |
| Plots | Y | Reports > Plots > Configure plots > Select machine | |
| Scatter Plots | Y | Reports > Scatter Plot > Configure scatter plot > Select machine | |
| Tables | Y | Reports > Table > Configure tables > Select machine | |
| GeoLeash | N | Reports > Filter GeoLeash Events > Select machine | |
| Machine Efficiency | N | Reports > Efficiency Snapshot > Select machines | |
| N | Reports > Efficiency History > Select machines | ||
| Assignments | N | Reports > Assignments > Assignment Report > Configure report |
Model-Based Signals
Model-Based Signals comprise a fixed catalog of signals that require no configuration and enable comparison operations via widgets and reports.
Standard operations based on a model are described in Models Management.
You can also edit models' visibility for users in different organization.
Model-Based Signals are also used for the DataScience feature
Read about the feature and its use case in DataScience Manual → "Model-Based Signals".
Model-Based Signals Catalog
The signals defined by the OEM for a model are managed via the PDC Manual the same as machine signals.
Contact your Proemion representative for more information.
Model-Based Signals Visibility
Model-Based Signals Visibility allows you to mark a model to be visible for users in the DataPortal whether they are in the organization that owns or can view the model by default (e.g. org units that have a machine of this model).
Administrators can perform the following functions to Configure Model-Based Signals for a model for users in different organization.:
-
Configure models visibility
Standard operations based on a model are described in . -
Configure visibility for sub-organizations for users who do not have access to a machine of a particular model.
-
Set the model management (create, modify and admin overview) flag for visibility.
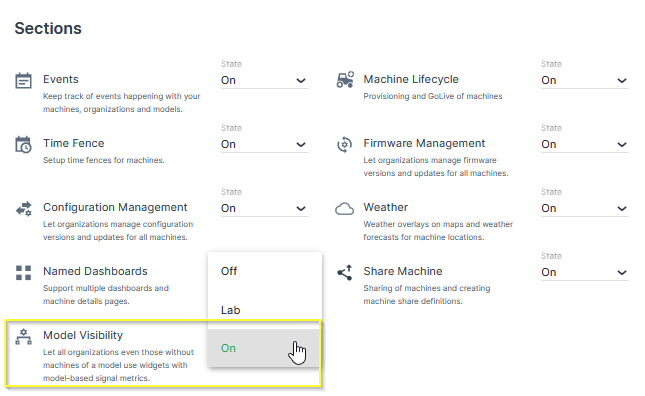
Enable Model-Based Signals
To enable visibility for MBS independent of a machine, proceed as follows:
-
Open Settings > Administration > Organization Structure.
-
Select Features (switch) from the Top Menu Bar.
-
Under Sections, toggle the state of Model Visibility to On.
Configure Model-Based Signals for a model
To edit the visibility of Model-Based Signals, proceed as follows:
-
Open Settings > Administration > Organization Structure.
-
Select Models from the Top Menu Bar.
-
Select the Edit link to the right of a model that you want to edit.
-
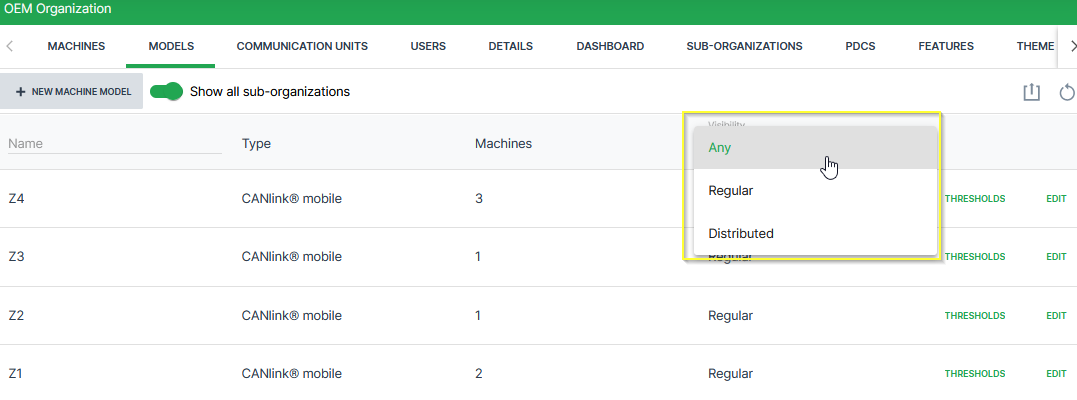
This opens the Edit Models dialog. Here you can select from 2 visibility options:
-
Regular: All organizations with machines of this model can use it across widgets and reports.
-
Distributed: Organizations that do not have machines of this model can use widgets with Model-Based Signals metrics of this model.
-
You can filter visibility for Model-Based Signals by selecting the Visibility from the Models tab in Administration as shown.