Tables
The Tables report is the simplest visualisation for data sets.
To configure a Tables report, proceed as follows:
-
Select Reports from the left-hand menu to expand the DataPortal reporting menu.
-
Go to Reporting Tools > Tables.
-
Set up the general parameters to configure your Table.
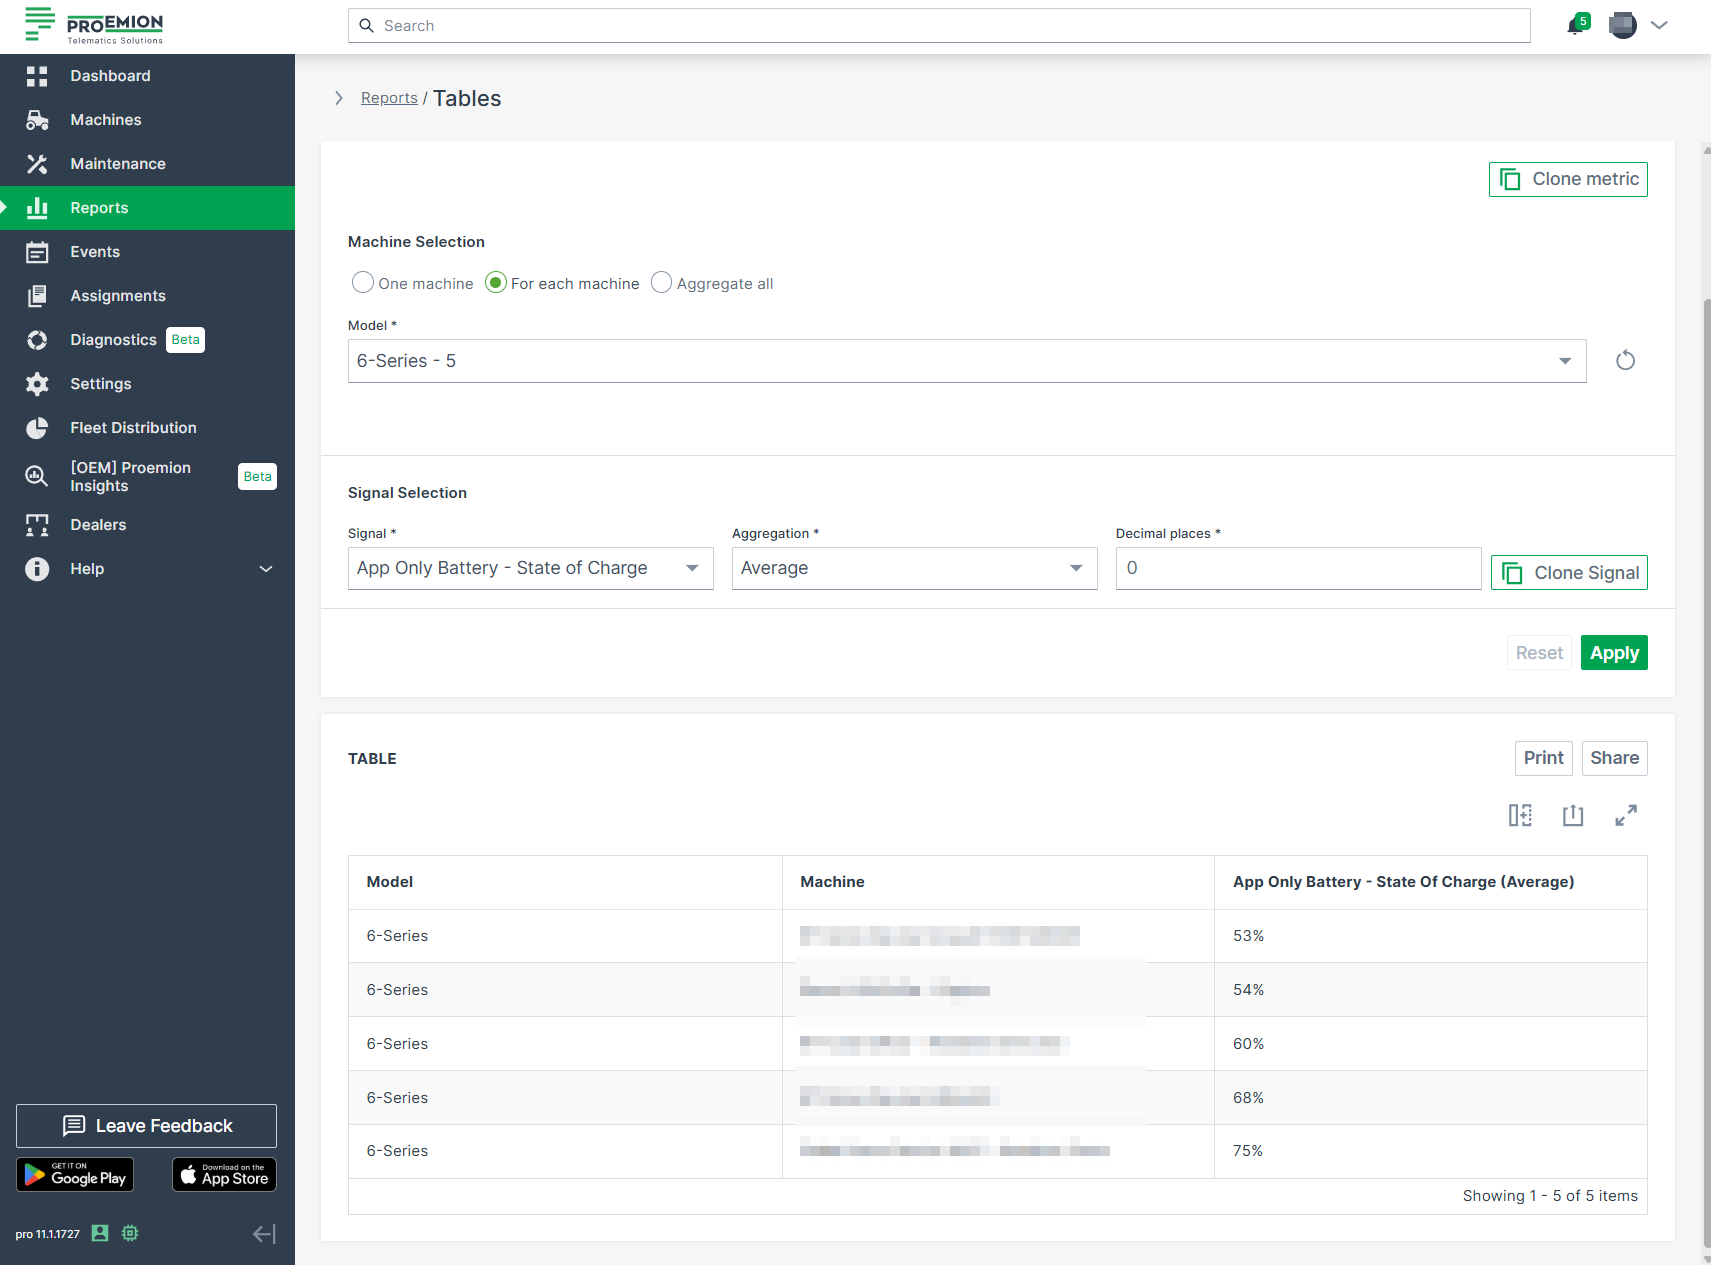
Example
The following example shows the output results of the data sets from different machines of a specific model on a single table.