Table Options
Tables are used to represent data in several menus and elements of the DataPortal. Within these tables you have different options to view, search or filter data:
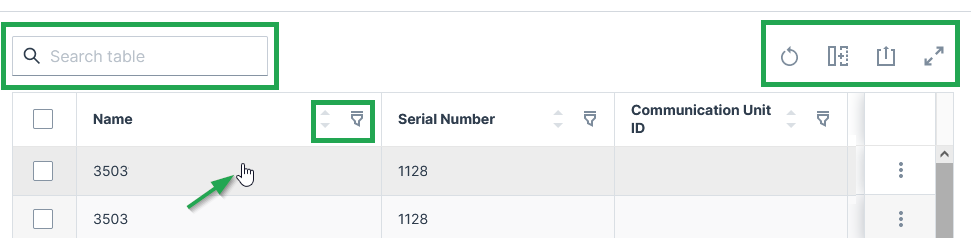
Each row is clickable and leads you to the details of the machine. You can search throughout the table or specific columns, see below.
Sort and Filter Table
-
 Reset all options to default values.
 -
 You can remove or add each column from the table.
 -
 You can sort by each column in the table by selecting the arrows above the column.
 -
 Via the 3-dots icon by the end of each row, you find further actions and options in the drop-down menu, see Machines Overview for an example of available options.
 -
 Filter and search of specific columns are available by clicking the filter icon and entering the searched text into the fields at the top of each column.
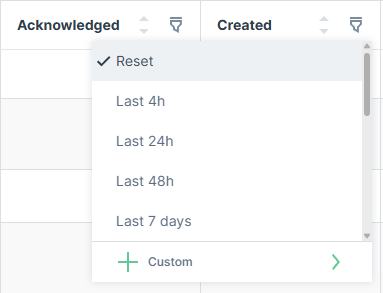
For date columns, the filter offers relative time presets (e.g. Last 4h, Last 24h, Last 48h, Last 7 days) or a Custom option to define a specific date-time range.
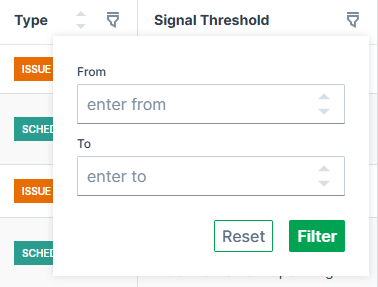
For number columns, the filter offers a numeric range with From and To input fields.
Resize Columns
Columns can be resized by dragging the handle at the right edge of the column, which shows a double-headed arrow icon with two vertical lines in the middle, see screenshot below:
![]()
Any columns resized by the user are saved locally and restored when reopening the table.
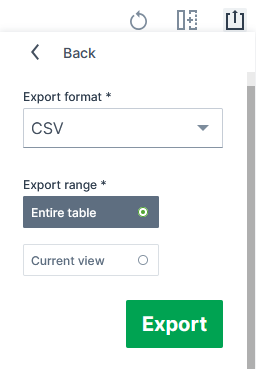
Export Table
![]() Via the export icon, tables can be exported.
Via the export icon, tables can be exported.
You can select to export all columns or only specific columns as viewed in the DataPortal:
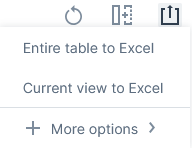
You can select to export the tables mostly as a CSV, JSON or XLSX file and PDF file:
Depending on the exported table, the column headers include the units (for the "Signal" column) and the time zone GMT+0:00 (for the "Last updated" column).
Important note on rounding
Consider that due to rounding, the displayed values in tables and charts may differ slightly from the underlying data.
Therefore, refer to the raw data displayed in the exports for exact figures of a report (instead of, for example, summing up the values displayed in a chart) as the values are displayed in full precision.
Note that in the XLSX exports, 3 decimals at maximum are displayed by default, yet the full precision raw value remains.