Signal Overview Panel
The Signals Overview Panel provides a quick overview of the machine’s current state and key measurements. It allows users to monitor real-time signals and assess the operational condition of the selected machine at a glance.
To open the Signals Overview Panel, you have two options:
-
In the Machine List, select the row of the desired machine.
-
In the Machines Overview, open the 3-dots menu at the end of the machine's row and select the option Open signal overview panel.
This will display detailed signal data for the selected machine in a sidebar panel on the right side of the DataPortal, see following Screenshot.
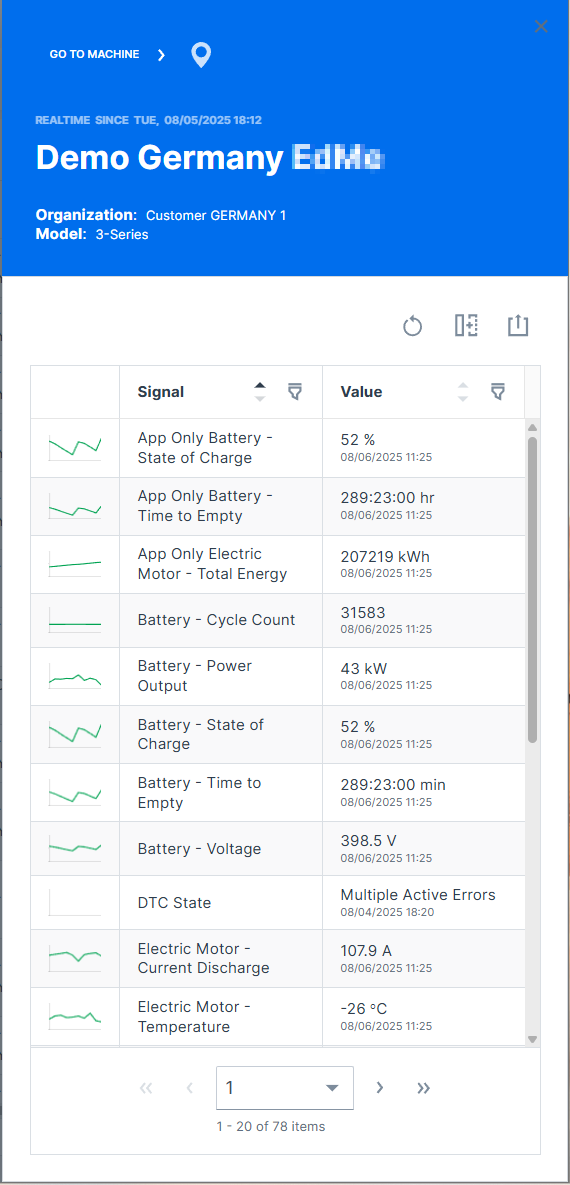
General machine information is displayed at the top of the panel:
-
Online / Offline state
-
gray background color indicates currently offline.
-
green or blue background color indicates currently online.
-
-
Time of most recent state change
-
Machine Name
-
Organization the machine belongs to
Click on GO TO MACHINE to open the Machine Page.
Click on the marker icon ![]() to zoom the map to the machine.
to zoom the map to the machine.