Report Parameters
This page provides an overview of the general report parameters shared between the different Reporting Tools.
The report parameters in all reporting tools are largely similar. The available reporting tools are:
Depending on the assigned Permission Set, users can view, generate, or create reports.
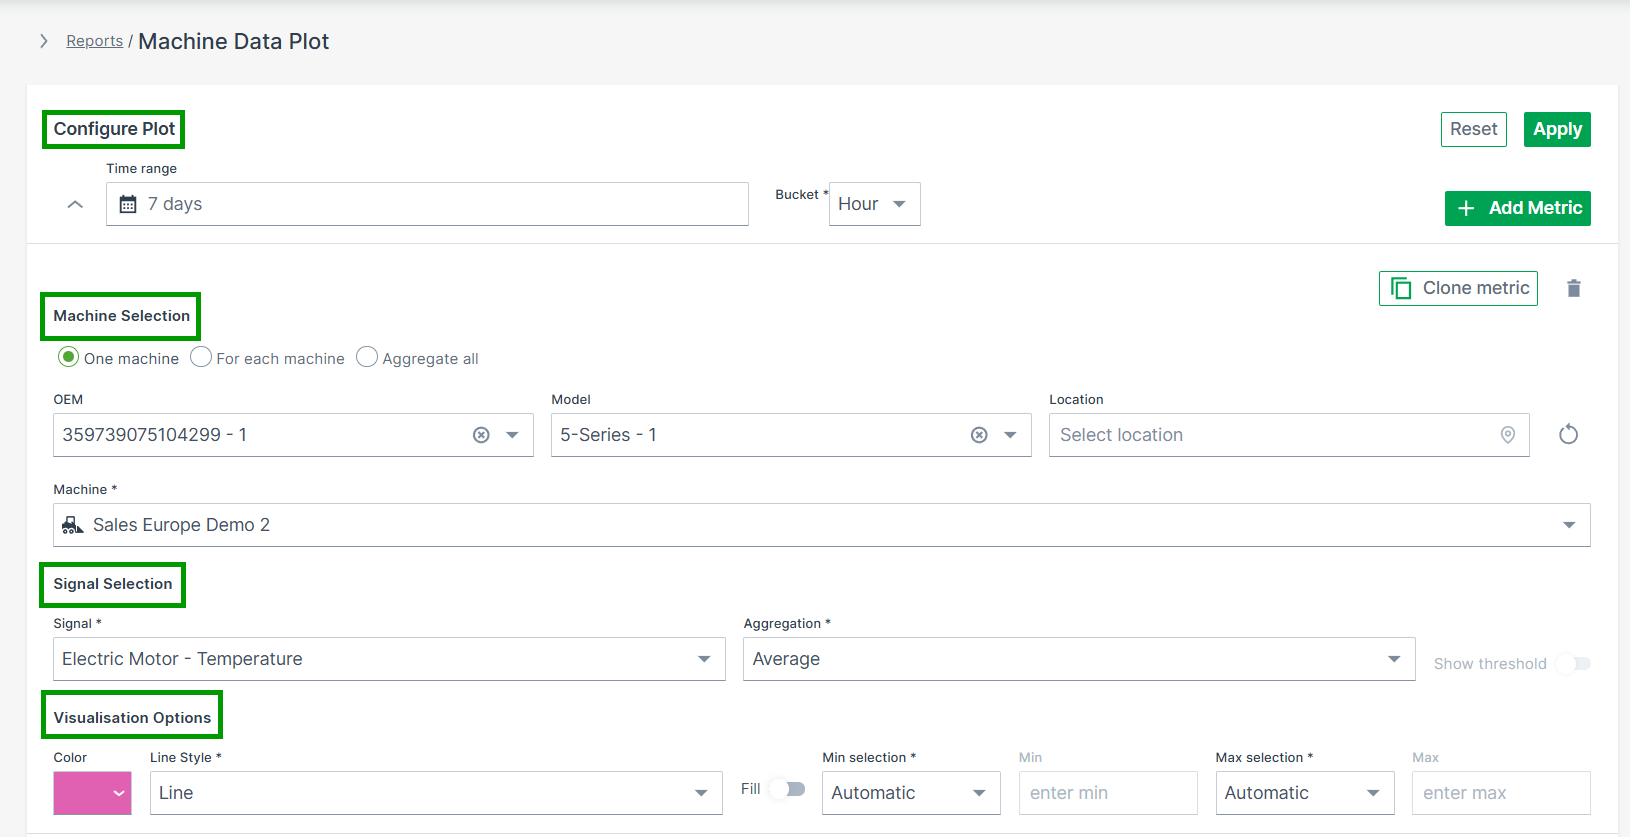
All reporting tools share common UI behavior:
- Collapsible sections: Configuration sections are collapsible, allowing users to minimize completed metrics for a cleaner overview. The number of configured metrics remains visible when collapsed.

Metric limit: Each report can include up to 20 metric configurations.
The general parameters are summarized below.
Configure Report
Defines the time range and aggregation settings.
- Time Range – Select a Relative or Absolute period for the data to be displayed
- Bucket – Defines the time unit used to aggregate data points (e.g. Second, Minute, Hour or Day)1.
- Apply / Reset – Apply the selected configuration or reset all parameters
Machine Selection
Defines which machines are included in the report and how results are aggregated.
Choose how machines are handled in the report:
- One machine – Select a single machine
- For each machine – Display results per machine
- Aggregate all – Summarize data across all selected machines
The Machine Selector is only available when One machine is selected.
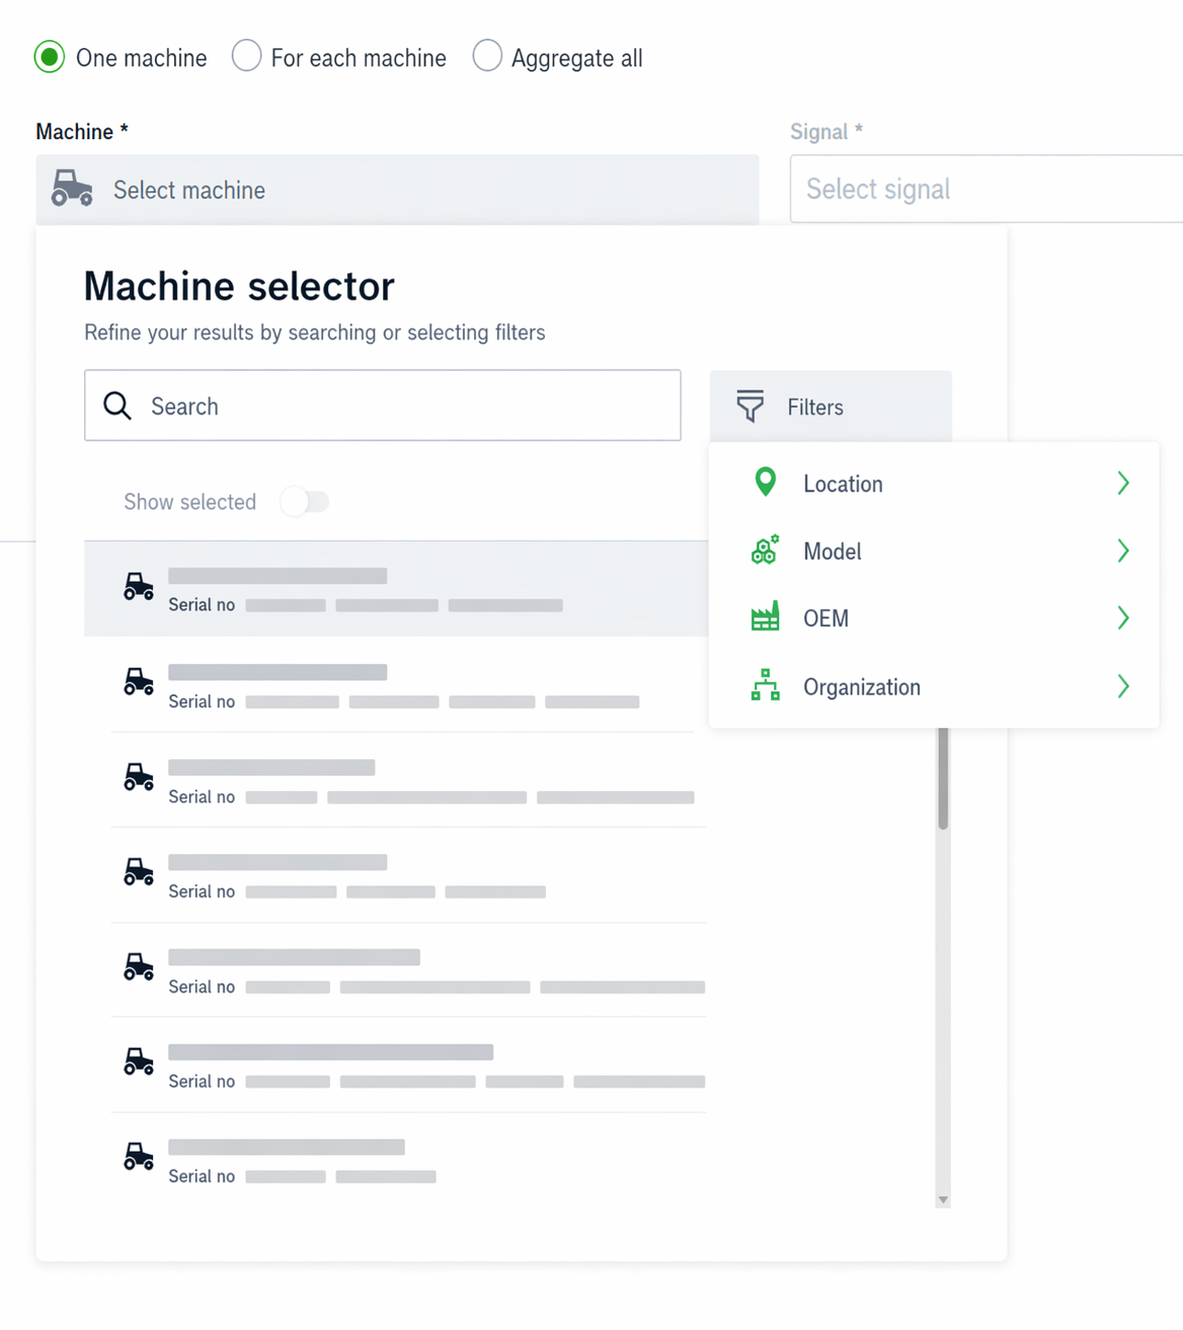
Machine Selector
The Machine Selector allows you to search, filter, and select machines within a single panel.
- Opens when clicking on the input field
- Displays all available machines if no search term is entered
-
Supports search by:
- Name
- Serial number
- VIN
- PIN
-
Filters – Narrow down machines directly in the selector:
- Location (e.g. Continent, Country)
- Model
- OEM
- Organization
-
Show Selected – Filters the list to display only the currently selected machines
-
Machine counts update dynamically based on the applied filters
- Selecting a machine automatically closes the panel
- Selected machines and filters persist when reopening the selector
Signal Selection
Defines which signal(s) are visualized in the report.
- Signal – Choose the signal to be analyzed
- Aggregation – Defines how signal values are calculated (e.g. Minimum, Maximum, Average)
- Show Threshold – Displays the defined threshold, if available
Visualization
Controls how the data is displayed.
- Color – Select the display color for the configured metric
- Advanced Options – Additional visualization settings (e.g. line style, fill, thresholds, min/max configuration)
Add / Clone Metric
Enables adding or duplicating metrics within the same report.
- + ADD METRIC – Add another signal or machine
- Clone Metric – Duplicate an existing configuration
Apply / Reset
Executes or clears the current configuration.
- Apply – Updates the report using the selected parameters
- Reset – Removes all configured selections
-
The Second bucket can be selected only if the time range is less than 3 hours (i.e. 2h 59 minutes or less) and the time range type is set to Absolute. ↩