Maps Report
The Maps report allows the user to view information about the movement of the machine, its current location or its tracks covered during a selected time period.
Several machines can be added on the same map and information will be displayed for the same time period.
The different tracks can then be viewed and compared for the different machines or time period selected.
Note
The Map report can only display data for a maximum time range of 7 days. Limiting the time range can also improve map performance and resolution of the tracks.
To use this feature, the Location:Location history Permission Set is required.
To configure a Map report, proceed as follows:
-
Select Reports from the left-hand menu to expand the DataPortal reporting menu.
-
Go to Reporting Tools > Maps.
-
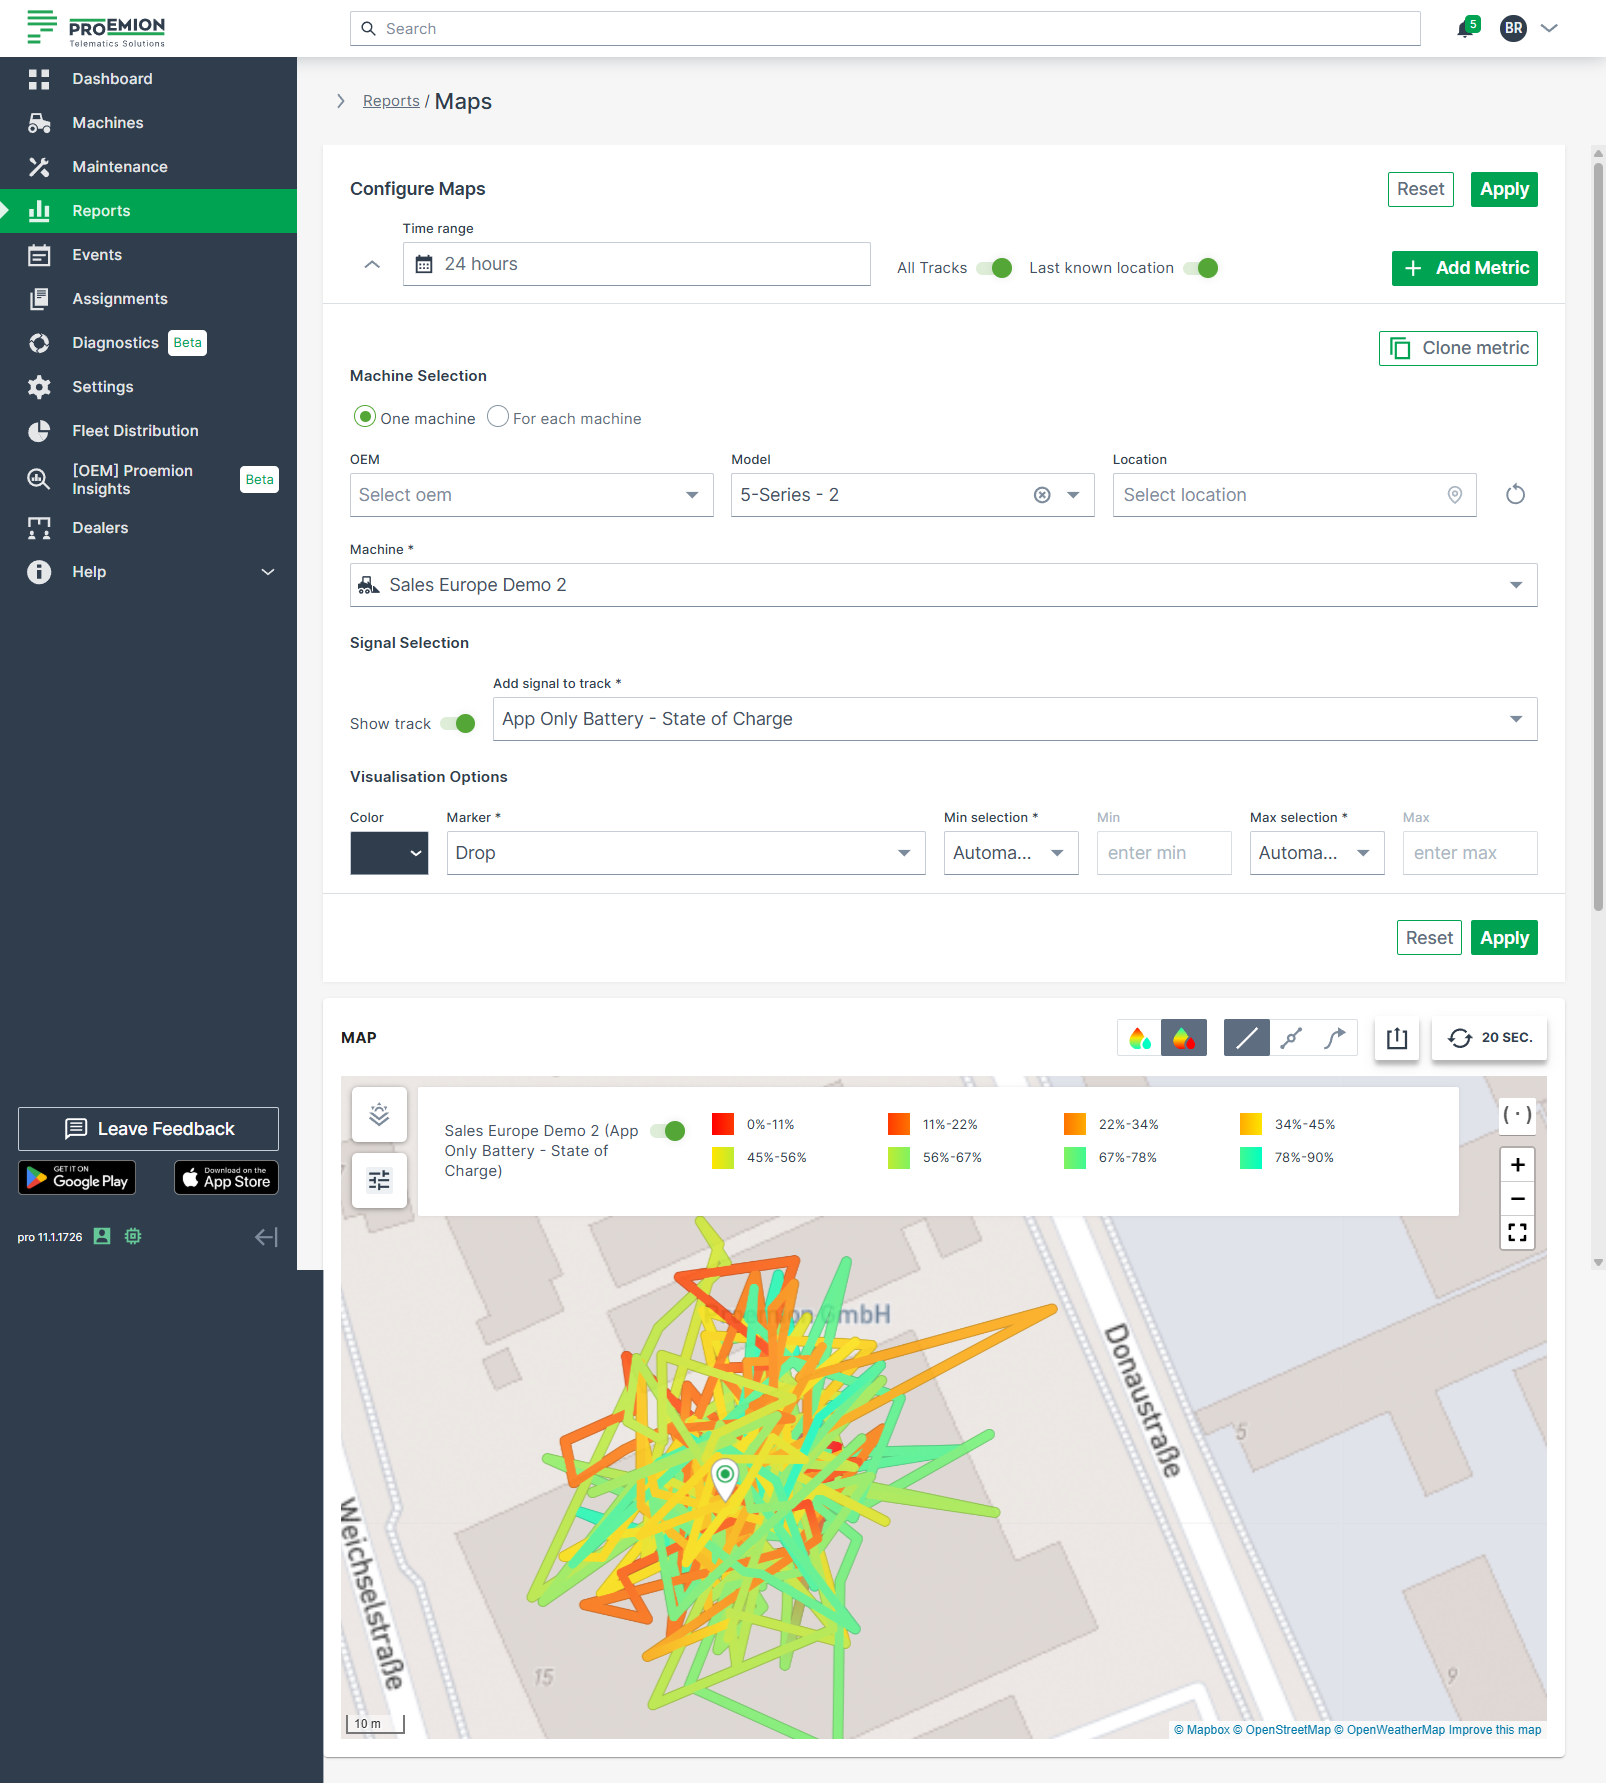
Set up the general parameters and the Map specific parameters (described in the section below) to configure your Map.
Example
The example shows a single machine track covered for the last 24 hours.
Note
The number of allowed waypoints may be limited on the map. A higher resolution view of the path is possible by limiting the displayed time range.
Map Specific Parameters
| Configuration Section | Description |
|---|---|
| Signal Selection | Show track: To display a track with metric for a given time range and machine, this option must be enabled. Add signal to track: Select the signal which needs to be displayed along the track. |
| Visualization Options | Definition of Minimum and Maximum value: This is the option to define the minimum and maximum value of the selected signal which needs to be displayed with a color gradient. It is recommended to leave the Minimum and Maximum at Automatic mode. If required, it is also possible to manually define own thresholds. Values which are outside the min/max range will be marked in grey then |
| Map Visualization | Description |
|---|---|
| Track option | Adapt the displayed tracks on the map: - All Tracks: Show tracks on the map for all machines. You may toggle the track for single machines. - 20 sec: Enable real-time monitoring by clicking this button and the position of each machine is updated every 20 seconds. Clicking again disables real-time monitoring. Note that you must activate the realtime mode toggle in Behavior Options beforehand. |
| Legend | Display the legend for a signal. |
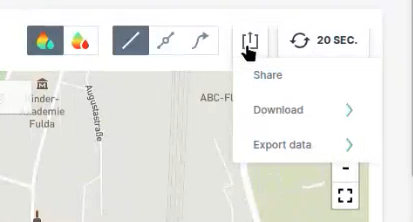
| Export Menu | Provides multiple options to share, save, or export the displayed data: - Share: Page URL is copied to your clipboard. - Download Map: Save the current map view as an image (PNG, JPG, PDF). - Export data: Export both the reported GNSS (track) data and the signal data of a machine displayed on the map. Signal data (CSV, XLSX): Contain raw signal values per timestamp. GNSS (track) data (KML, GPX): Contain the machine’s movement (track) over time; the current machine position is not included. |
Add Signal to Track
Note
The Add Signal to Track function is only available for a maximum number of 5 data sets.
This feature allows users to display numeric signal values or machine states directly along a machine’s track on the map. This enables the visualization of how a signal changes across different geographic positions, as well as the driving direction of the machine.
Variations of numeric signals are displayed as a continuous gradient, while variations of machine states are shown in discrete colors.
Data points are based on raw signal data and are linked to the closest GNSS position according to their timestamp. For performance and clarity, data points are grouped into invisible clusters — zooming in and out dynamically reveals additional data points and direction arrows along the track.
You can further customize the track appearance using the following Display Options:
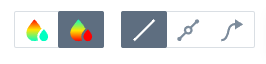
-
View track gradient increasing
-
View track gradient decreasing
-
View track only
-
View points on the track (zoom in to reveal more data points)
-
View driving direction on the track (zoom in for detailed direction arrows)
When a machine state is displayed along the track, the legend and corresponding color coding are generated automatically.
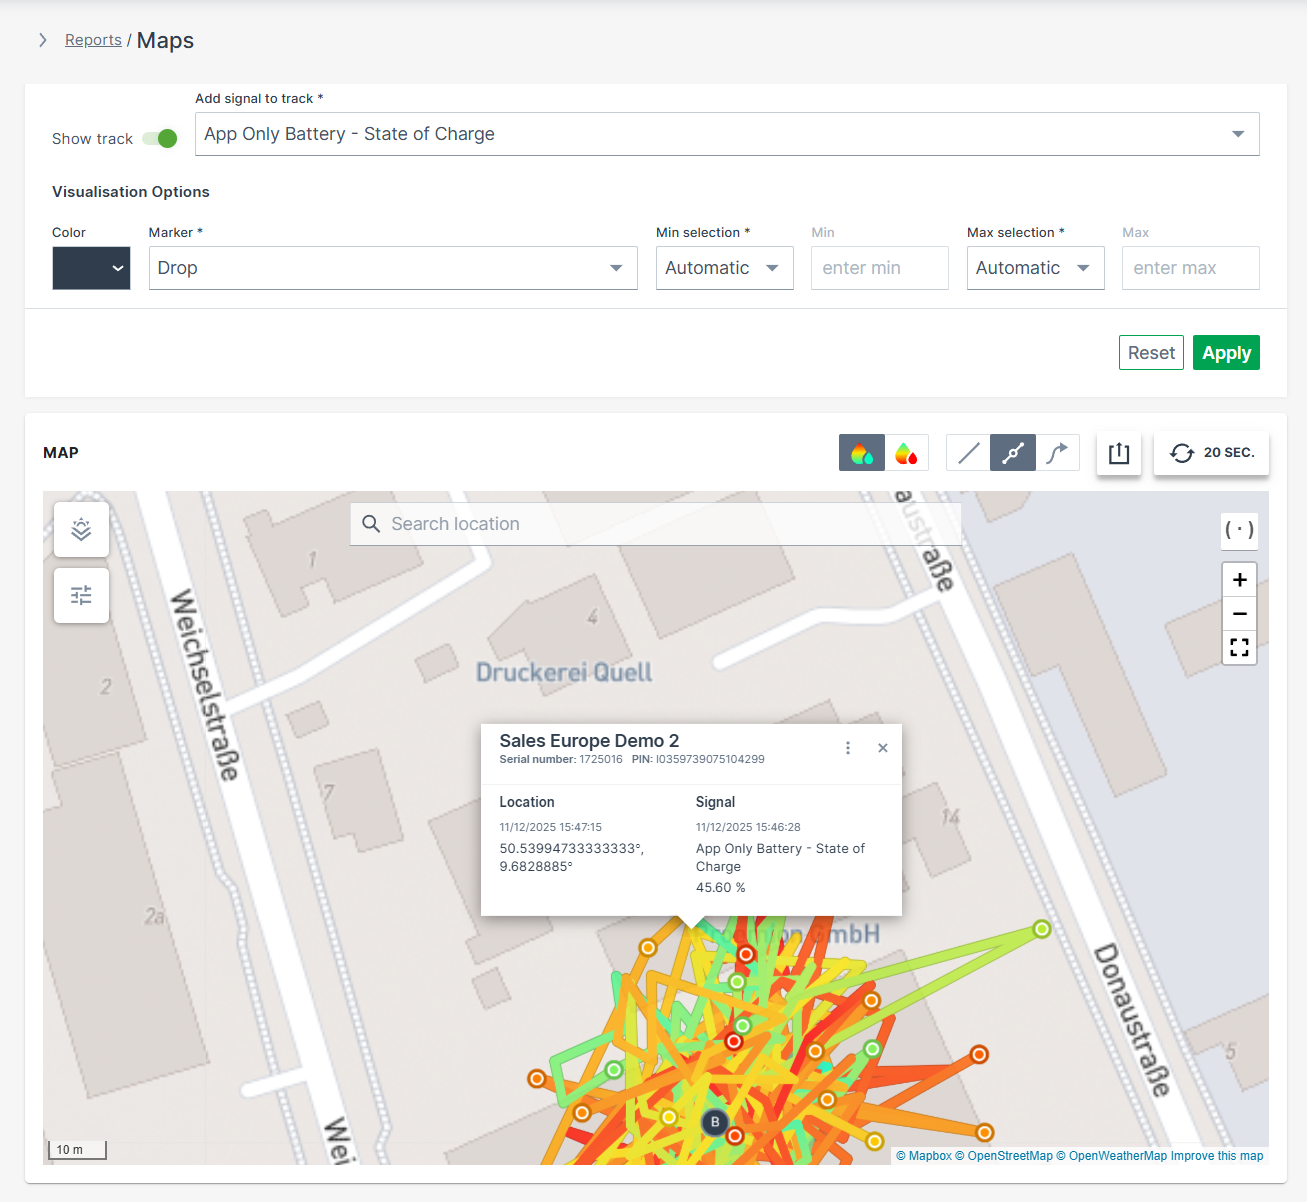
A mouse-click on a specific data point along the track shows the transmitted GNSS position, the signal value/state and its corresponding time stamp. Note that warnings regarding the status of the location are displayed automatically, see Status and Update.