OEM Insights
The OEM Insights page provides reports on aggregated data on the telematics performance of your fleet within specified time periods and other data analyses. The advantage is that data can be viewed in different predefined charts at a glance for your whole fleet instead of querying data for certain machines via the REST API.
Note
The OEM Insights feature is in beta stage.
Requirements
Activation
The OEM Insights page is visible only to members of the tenant organization. The organization must be of Organization Type "OEM". The page can be enabled/disabled per tenant via Feature Switch.
Metrics used
The usage of the Proemion Standard Metrics is required to use this feature. The metrics that are delivered by the machines and used for the display of the aggregated data in combination with e.g. a monthly bucket are:
-
value.common.machine.hours.operation.total("Active Machines Operating Hours") -
value.common.machine.geo.latitude("Active CUs Last 24 Hours", CUs that updated geo within last 24 hours based on this signal)
DataScience features
The initial activation of this feature and enabling the usage of the DataScience scripts must be done by Proemion. Contact Service and Support for enabling the feature and the DataScience scripts.
The Counter Guard feature, see Counter Guard (DataScience), is also required for the OEM Insights. It removes machines with problematic counter signals from the analysis. Without activating this feature, OEM Insights will not remove machines with problematic signals, potentially leading to inaccurate results.
Sample
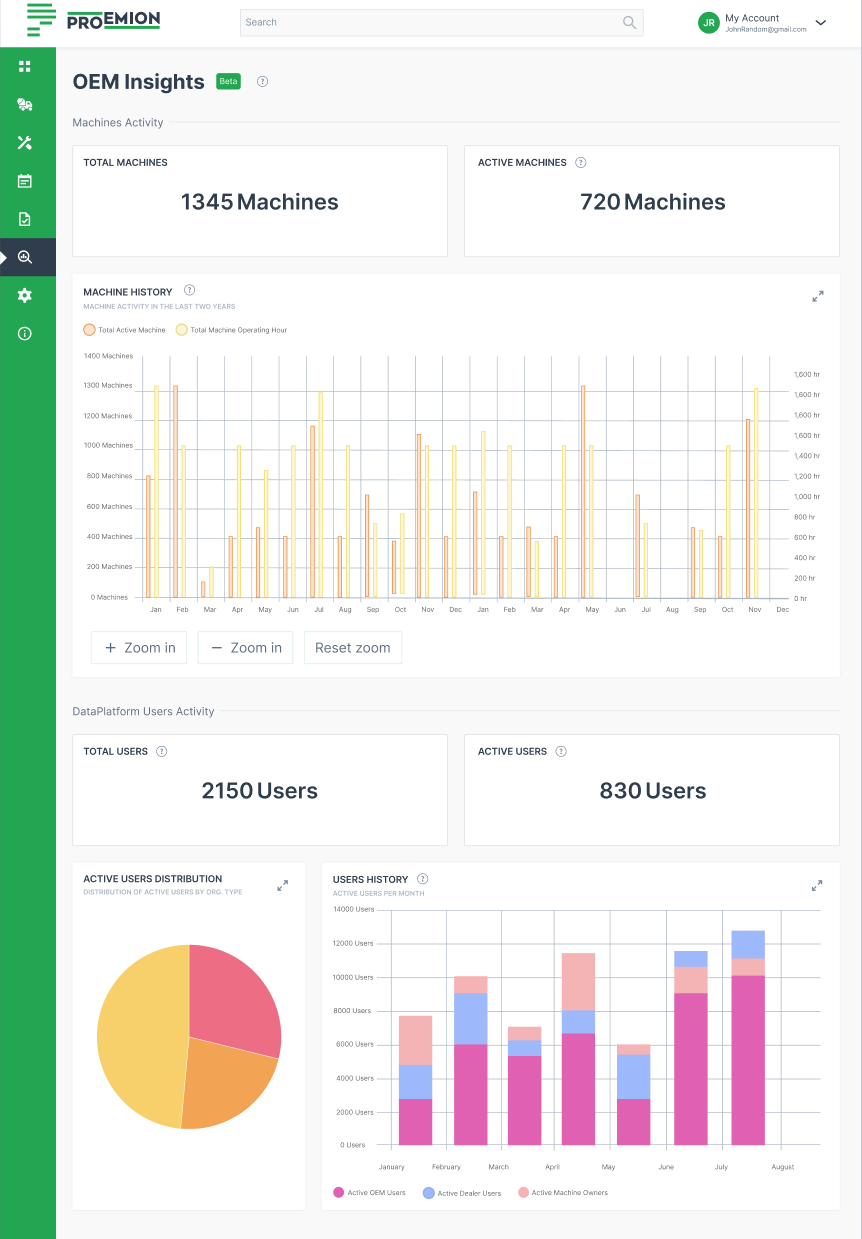
The OEM Insights page is displayed as follows and shows information on:
-
Machine Activity, e.g.:
-
Total number of machines (that you have contracts with)
-
Active machines (in the last 30 days)
-
Machine History of the last 2 years, i.e. average hours per active machines
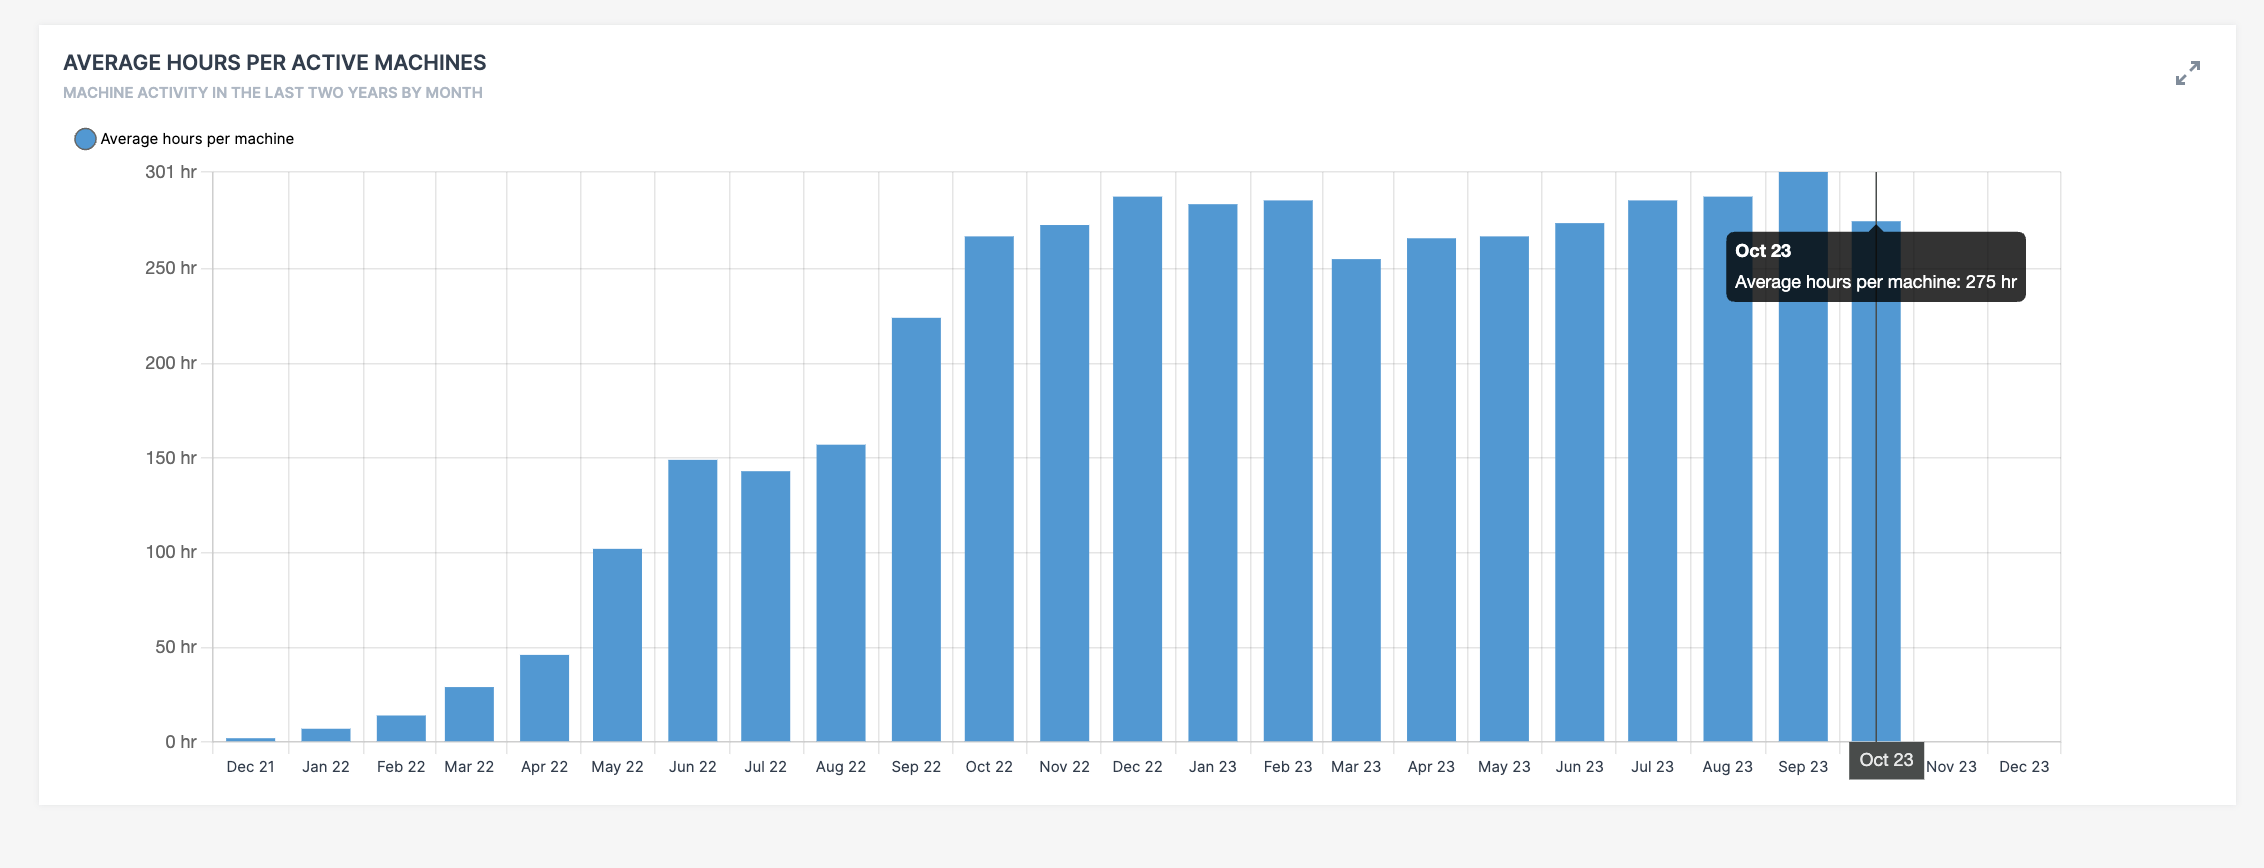
Figure 2: Average hours per active machines
-
-
DataPlatform User Activity, e.g.
-
User distribution by Organization Type
-
Active users per month
-