Machine Efficiency
Efficiency reporting enables machine owners to calculate and track efficiency for individual machines or for the fleet. In the DataPortal you can view the data as Efficiency History and Efficiency Snapshot reports or as a widget on the dashboard.
Machine Efficiency Requirements
The Machine Efficiency default configuration is done in the Efficiency Definitions.
Note
The Efficiency reports aren't accessible if no Efficiency definition exists.
Create Efficiency Report
Note
There are 2 report types to choose from:
- Efficiency Snapshot report: cumulative efficiency for the time range.
- Efficiency History report: efficiency broken down by bucket.
Configure an Efficiency report by following the steps below:
-
On the left-hand menu of the DataPortal dashboard select Reports.
-
Select Efficiency Snapshot or Efficiency History from the menu to open the configuration dialog.
-
Configure the Efficiency Report options as described below.
-
Once you have configured the report criteria, select the machines and click
 .
. -
The DataPortal then calculates the data and generates a report.
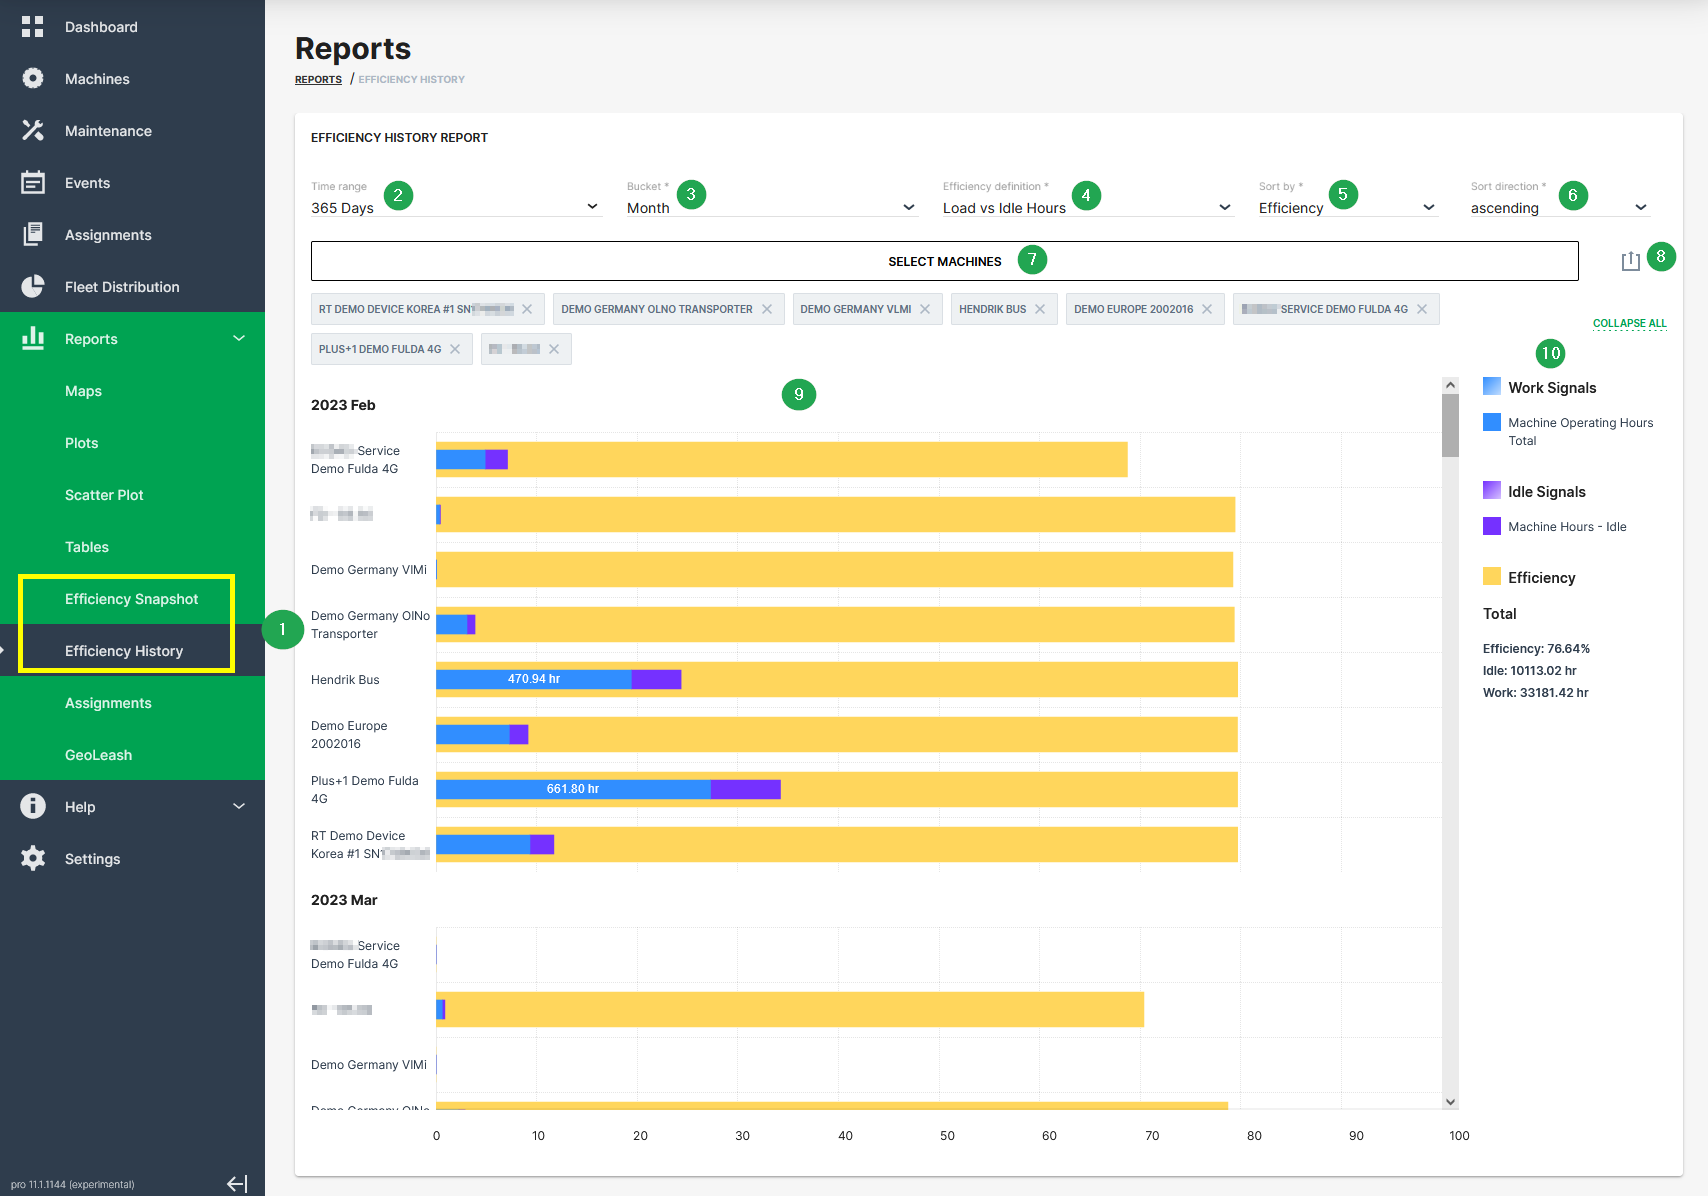
| # | Item | Description |
|---|---|---|
| 1 | Time range | Select the time period for the measurements up to the previous 2 years. |
| 2 | Bucket | Choose the time intervals between data points in the report. Please note that Bucket is only available if Efficiency History is selected. |
| 3 | Efficiency definition | Select a predefined efficiency definition. |
| 4 | Sort by | Choose between sorting by efficiency or by name. |
| 5 | Sort direction | Choose between ascending and descending. |
| 6 | Select Machines | Select machine(s) for which you want to display efficiency. |
| 7 | Export report | Allows you to export the report as CSV file or to share a link. |
| 8 | Bar chart | Graphical representation of the reporting. |
| 9 | Explanation of chart | Explains chart elements and displays summary. |