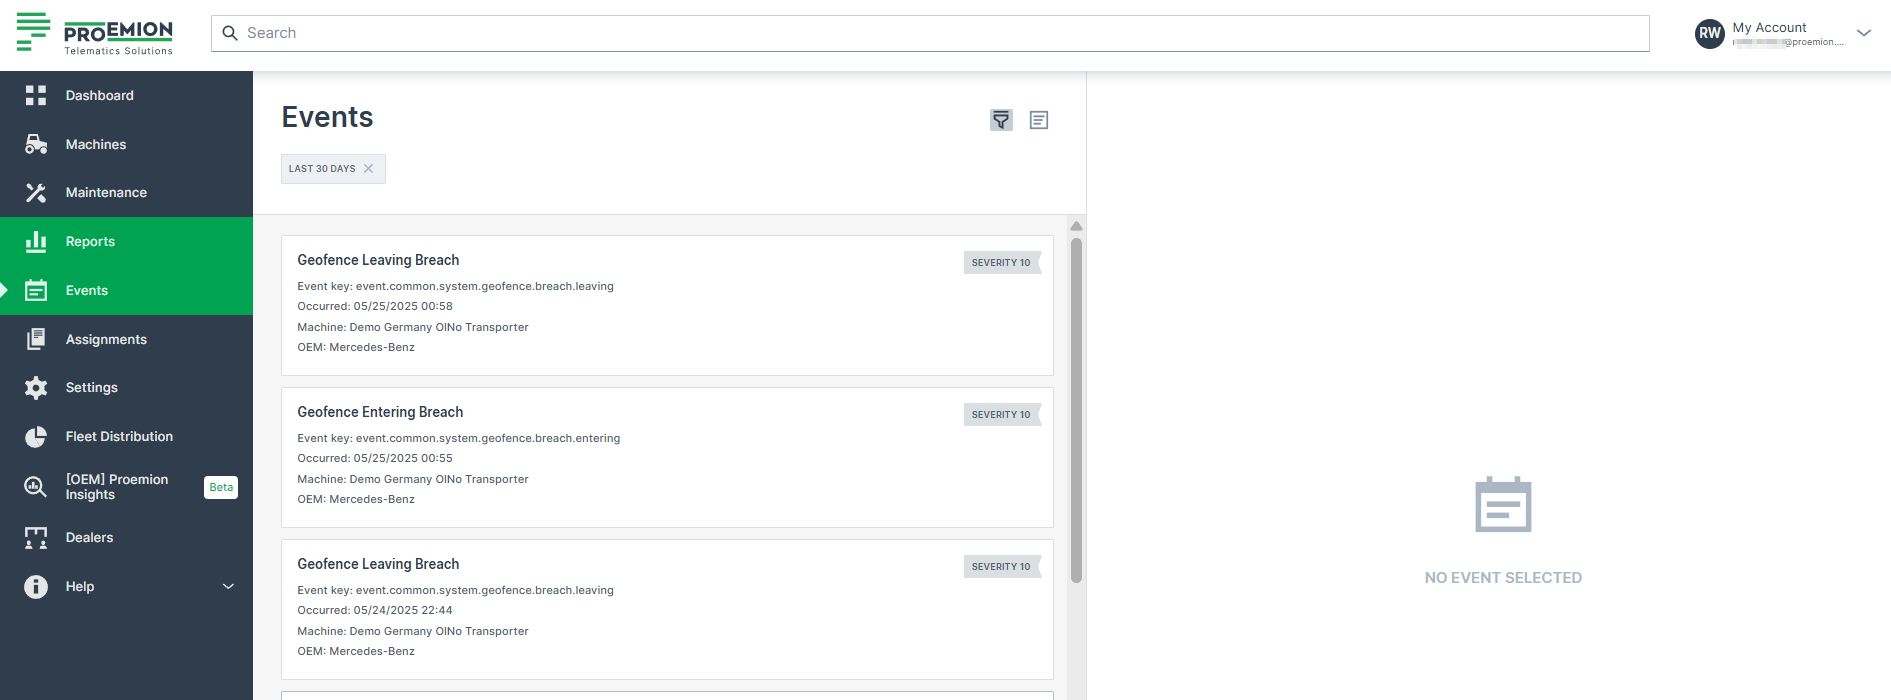
Events
The DataPortal visualizes standard events such as GeoLeash and Thresholds captured by the DataPlatform.
Note
This feature is available via Feature Switches, see Configuration
| Events | Description |
|---|---|
| GeoLeash | Tracks machine movement and enables automatic notification about machine relocation. |
| GeoFence | Monitors machine movements to determine if it is inside or outside a pre-defined GeoArea and detect when it crosses the boundary, i.e. enters/leaves the GeoArea. GeoFence events are self-contained; they store the GeoArea as it was at the time of creation. The visibility is restricted, for more information read the linked documentation. |
| Thresholds | Machine signal changes outside the defined normal signal value range. |
| Time Fence Breach | Detects if a machine is active outside a weekly schedule. |
| Realtime Sessions | Tracking and audit realtime sessions identifying who connected to a machine. |
| Fuel Guard | Detects fuel refill, loss and DEF/AdBlue refill events. See DataScience Manual → "Fuel Guard" for more information. |
| PDC Changes | Tracks PDC changes: The DataPlatform stores the update time. A PDC change event is generated for each update. Event types: Machine PDC change Model PDC change (event per machine) Machine model change (if PDC differs) |
| Software Version History | Tracks firmware versions, configuration versions and CODESYS application versions (for supported CANlink® mobile 10000 devices). |
Custom events are not captured by the platform as a standard feature. These events are implemented upon customer request.
Note
Events exposing location history are hidden from users with access only to the latest location. Access must be set by an organization admin.
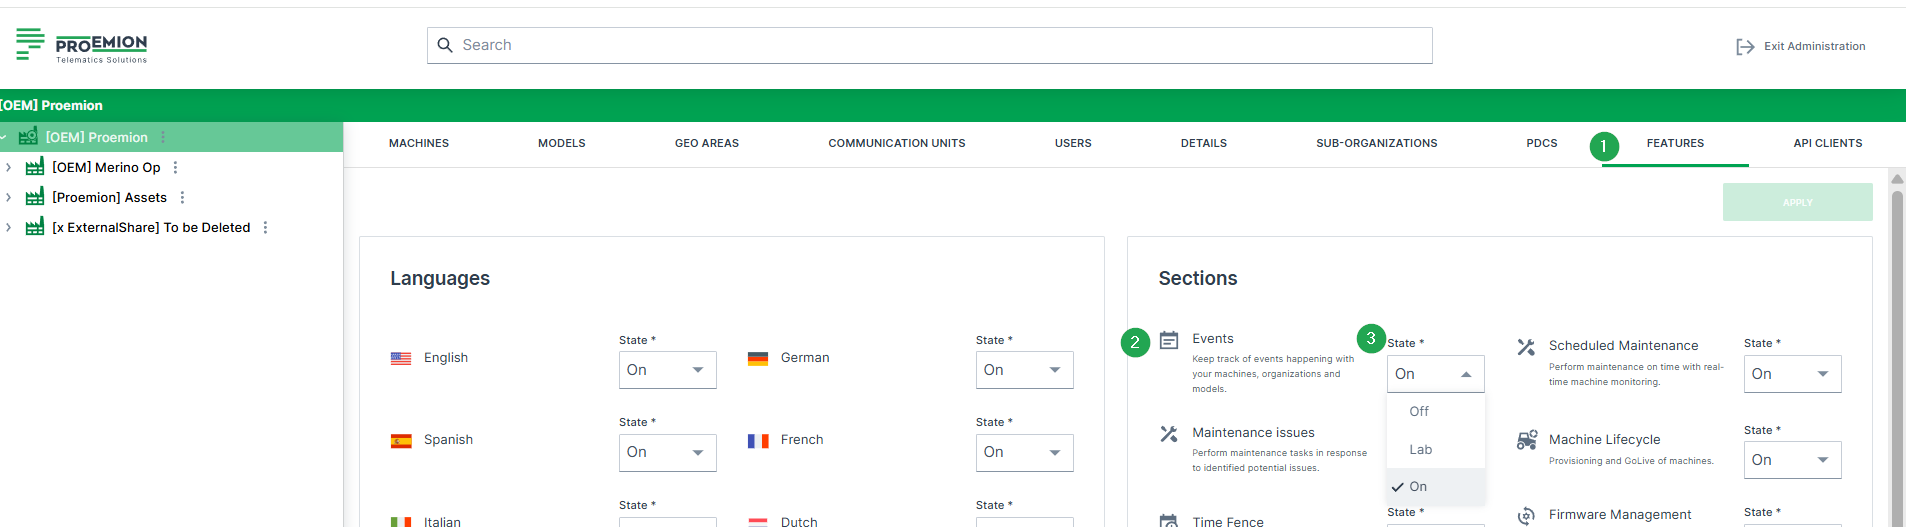
Configuration
Activate the menu to display implemented events via Settings > Features, see Feature Switch.
You can now select Events from the left side menu.
View Event
You can Filter and/or sort events by oldest, newest or by maximum or minimum severity.
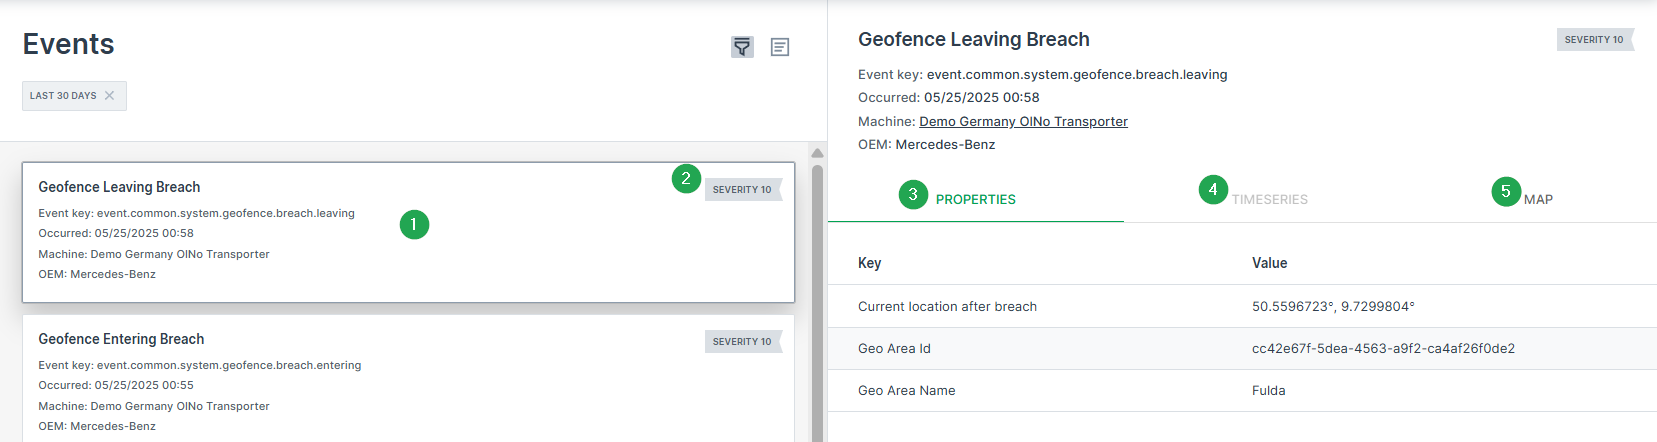
Selecting an event shows you the following items:
| # | Item /Description |
|---|---|
| 1 | Lists the Event data such as Key, name, status, timestamp, resource. |
| 2 | State Indicator: Events status are typically configured according to display severity in text or numerical form. |
| 3 | Properties show the Event attributes. |
| 4 | Show the time series |
| 5 | GeoFence events are also viewable on the map. 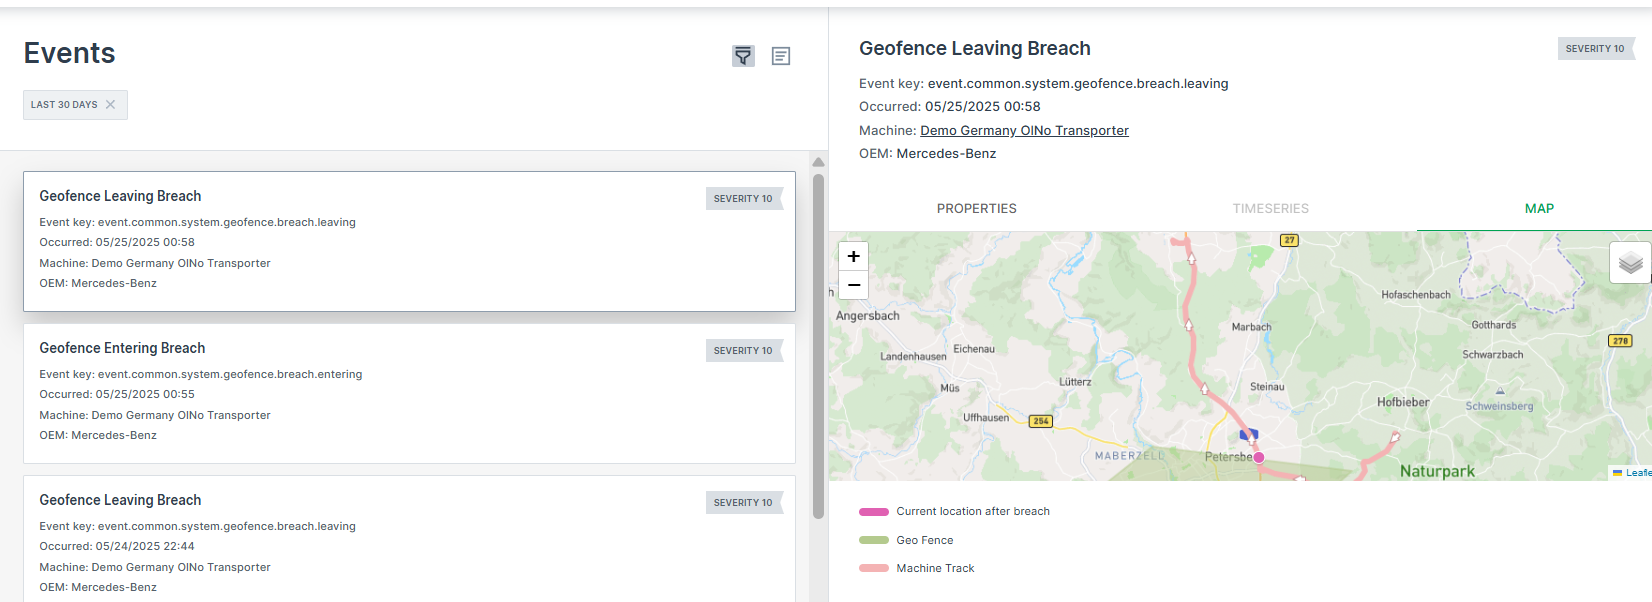 |
Filters
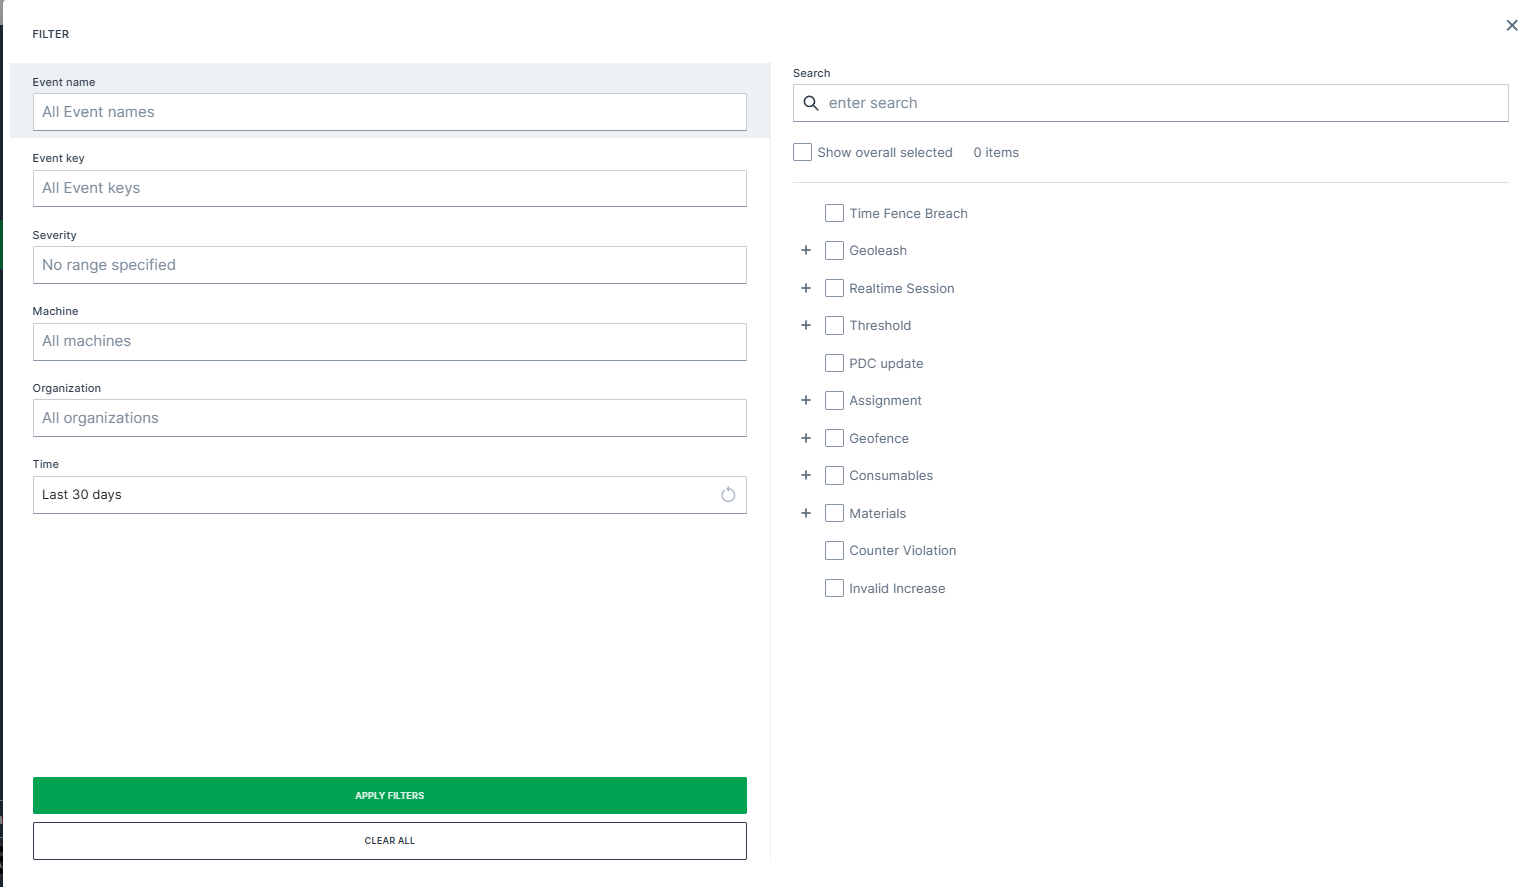
Filter events by:
- Name
- Key
- Severity
- Machine(s) - Select machine(s) to filter events .
- Organization
- Time range (filters by the selected time range during which the events occurred)
- or search a specific event
The right pane changes according to the selected filter.
Note
The filters are only available according to the available events, e.g. if there has no event occured for a specific key, it is not displayed.