Threshold Notification
The Proemion DataPortal features email notification of machine signal changes outside of normal signal value (or healthy) range. Values in the healthy range are defined by thresholds which are set by the OEM/manufacturer, see Threshold Configuration.
Notifications are triggered when a signal value breaches a threshold. A summary of threshold breaches is sent once per day
The summary includes all threshold breaches of the subscribed severity level.
Note
You won´t receive threshold notifications from machines which you can only access through a share.
Severity Levels
A severity level indicates the signal value is outside of (above or below) the healthy range. If a value breaches a threshold but later returns to the healthy range, the threshold is then rearmed.
Note
Every breach triggers a separate notification included as part of the daily summary for the severity level.
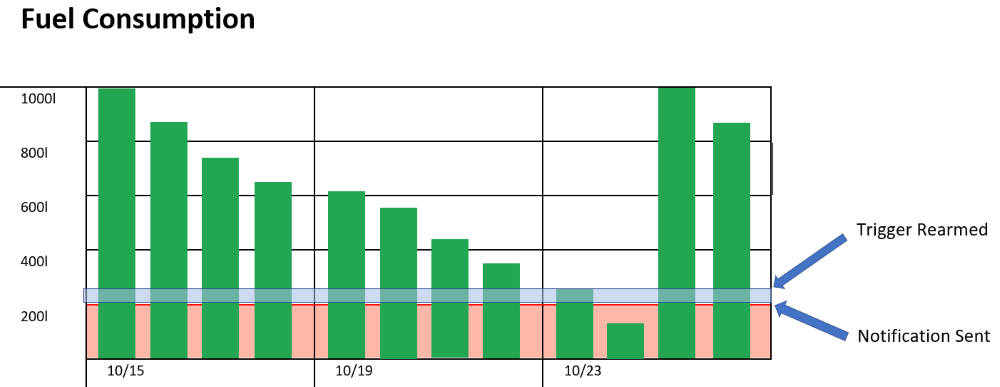
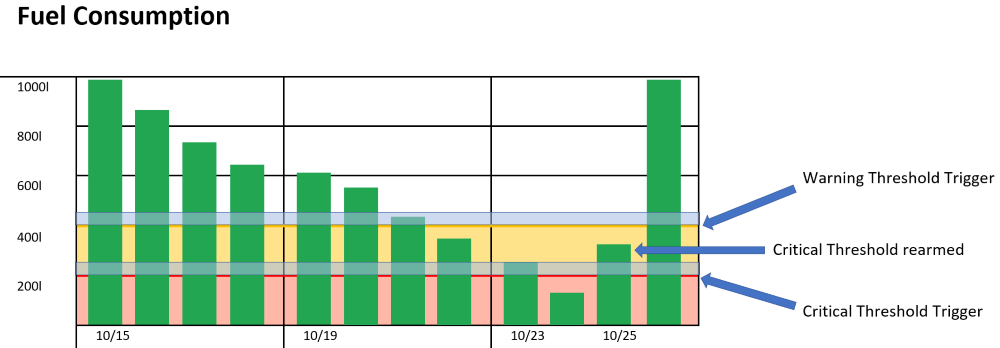
In the example, the red-shaded area represents a warning threshold. Once the threshold has been breached, a notification is included in the daily summary. The fuel level must be refilled filled past the blue-shaded area to rearm the trigger.
Samples
Thresholds only take into account the current signal value. So if more than one severity level is set for a signal, each threshold breach triggers a separate notification
There are some rules to keep in mind regarding severity levels:
-
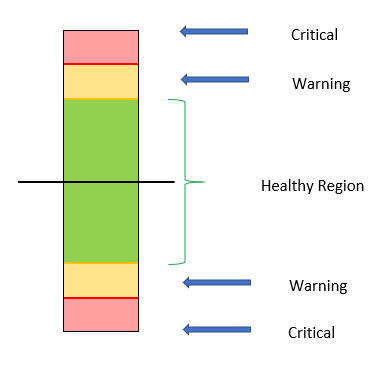
For successive low signal thresholds, the lowest signal value must have the highest severity level.
-
For successive high signal thresholds, the highest signal value must have the highest severity level.
-
The healthy region is determined by:
-
the signal values between the high and low thresholds
-
if all thresholds are high signal values the healthy region begins at the lowest value threshold until the maximum value for the signal
-
if all thresholds are low signal values, the healthy region begins at the highest value threshold until the minimum value for the signal
-
In the example, the critical threshold is rearmed on 10/25 yet the signal is still in the warning level range. On the following day the warning threshold is rearmed.
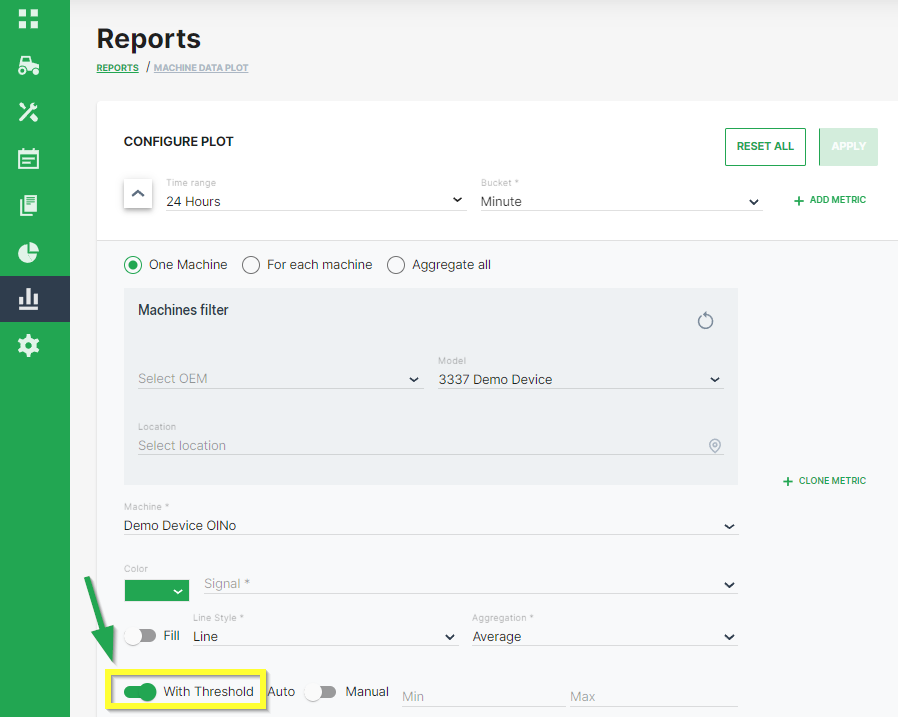
Once you have set severity levels for a signal, you can view the thresholds by setting the With Thresholds switch in the reports/plots Configure dialog to the on position (as shown)
The switch only appears for signals that have severity levels set in the Threshold Configuration.
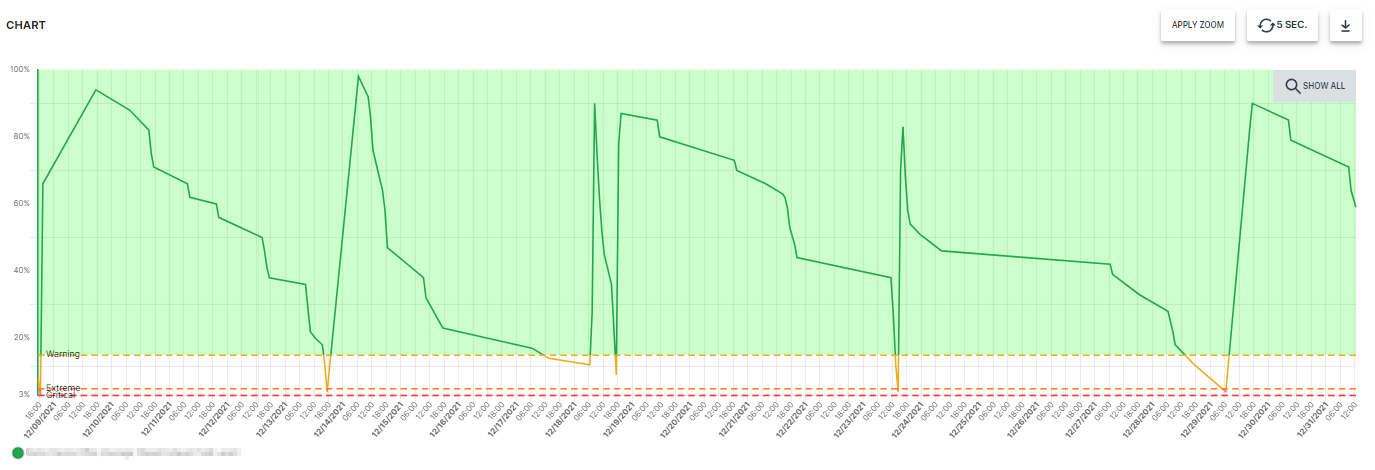
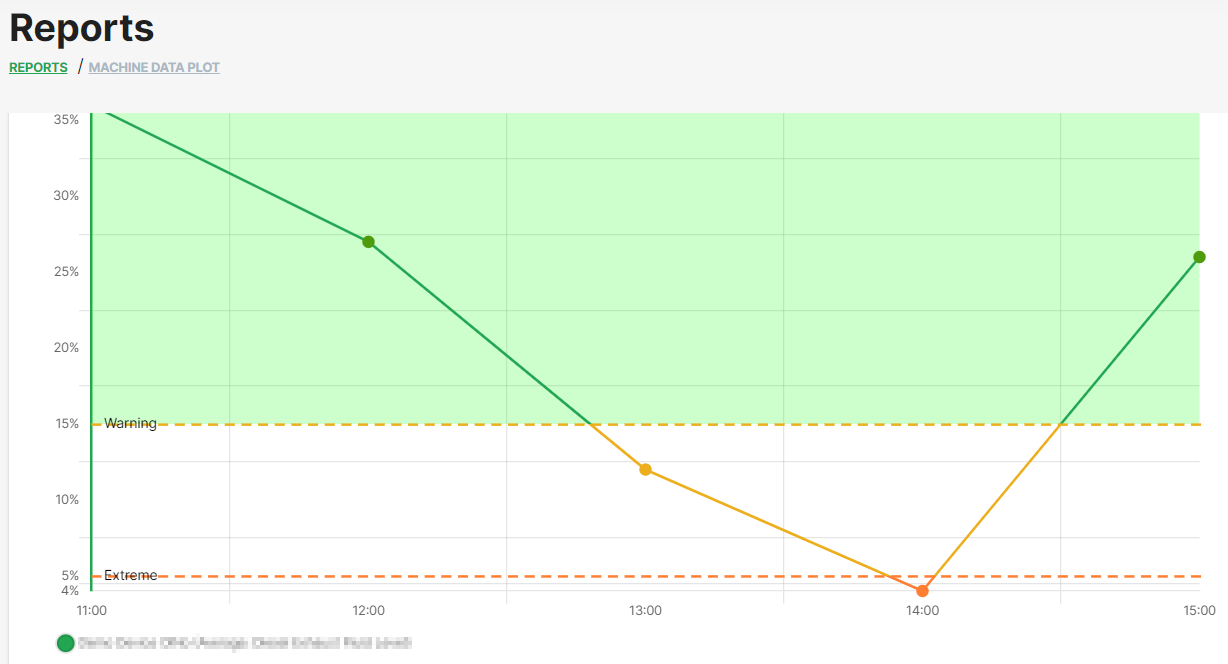
In the plot shown below, the Extreme label is triggered when the fuel level dips below 5%.
Subscribe to Thresholds Notifications
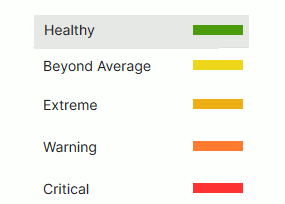
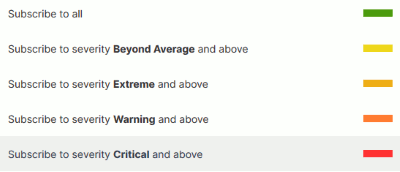
To subscribe to threshold notifications for your organization, configure your Notifications settings and choose the severity level for which you would like to receive notifications by choosing the color accordingly:
Severity Level
The notifications will be sent as a daily between 5 a.m. and 6 a.m.
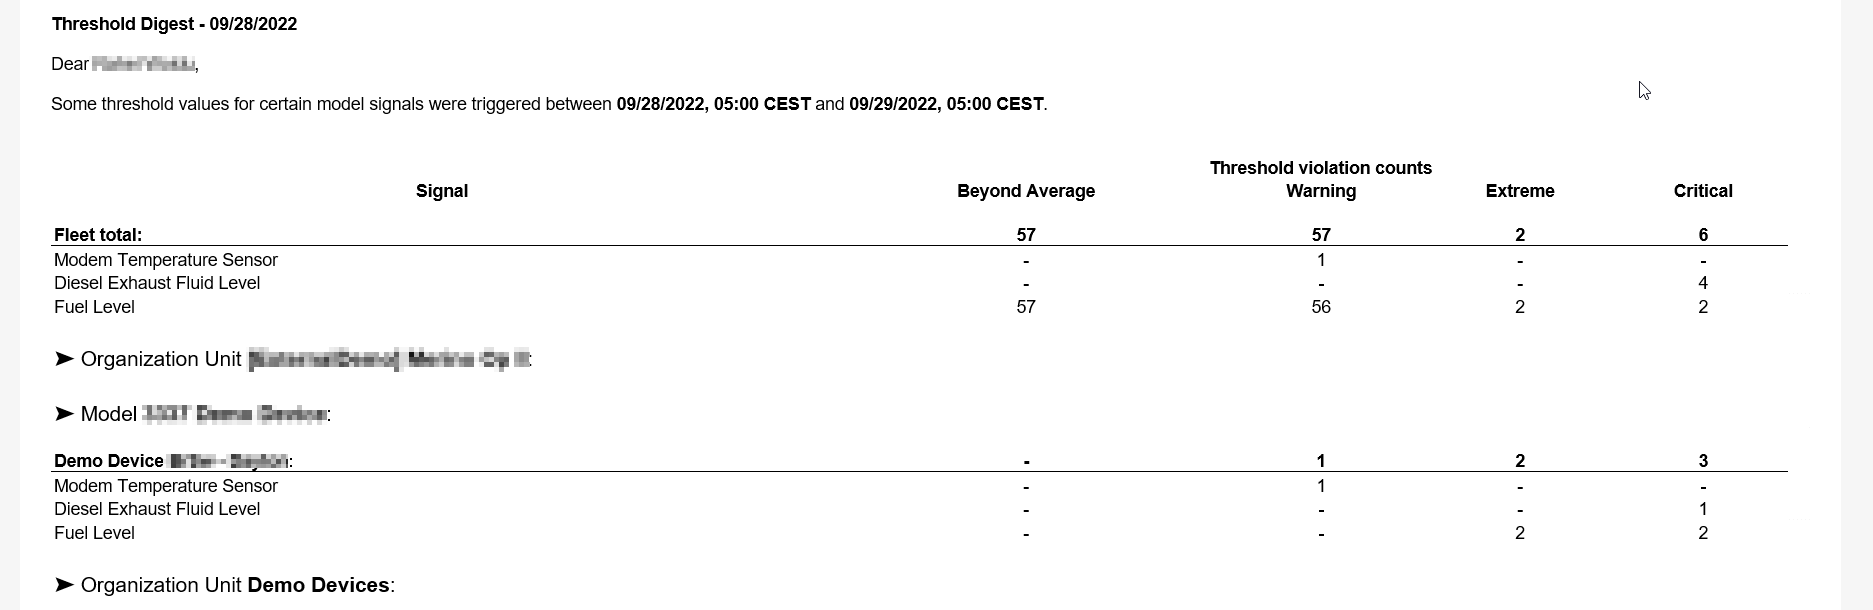
Example of a threshold notification content: