Common Parameters
Note
Note that due to rounding, the displayed values in tables and charts may differ slightly from the underlying data. Therefore, refer to the raw data for exact figures of a report. For exporting data, refer to Table Options.
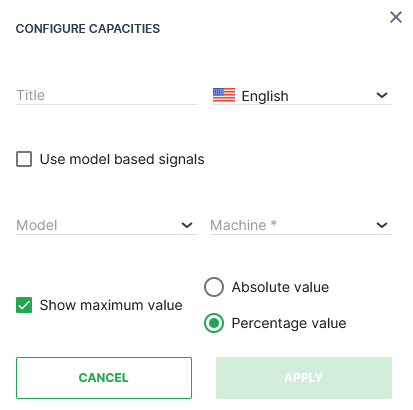
When configuring a widget on the Organization Dashboard you must first select the Standard Parameters Model and Machine. You can specify the accuracy for decimal place values; the default option is a single decimal place:
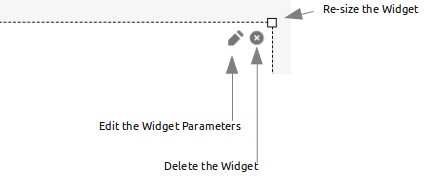
Options to drag, reposition, and resize are available in edit mode:
Time selection
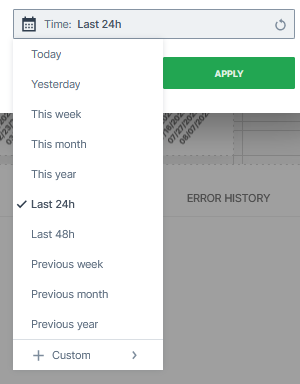
You can change the time range for the data displayed in the widgets on the DataPortal. You can specify a relative time range between now and up to the previous 2 years.
Select from either predefined time ranges, e.g. Last 24 hours or Previous month:
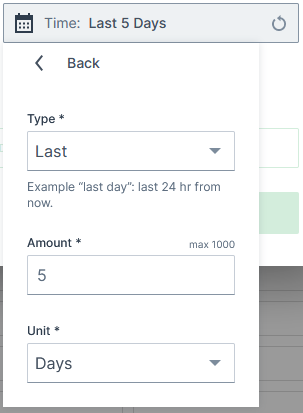
Or select a custom time range, e.g. This last (Type), 5 (Amount), Days (Unit):
In the Type field you can choose between Last, This Last and Previous. For the following examples, let's assume it's Wednesday, 10th of August, 16:30 hours and you would like to view information of the past 7 days and additionally 7 hours from now.
-
Last: calculates backwards from the current time. Examples:
-
Last 7 Days would show the values in the time range Wednesday, 03.08. 16:30 until Wednesday, 10.08. 16:30.
-
Last 7 Hours would show the values from Wednesday, 04.08. 09:30 until 16:30.
-
-
This Last: calculates from the last full unit for the start of the time range. Examples:
-
This Last 7 Days would show the values in the time range Thursday, 04.08. 00:00 until Wednesday, 10.08. 16:30.
-
This Last 7 Hours would show the values from Wednesday, 04.08. 10:00 until 16:30.
-
-
Previous: calculates from the previous unit. Examples:
-
Previous 7 Days would show the values in the time range Thursday, 03.08. 00:00 until Tuesday, 09.08. 00:00.
-
Previous 7 Hours would show the values from Wednesday, 04.08. 09:00 until 16:00.
-
-
In comparison, when selecting Previous week (predefined time range), it would show the previous calendar week, i.e. Monday 01.08. 00:00 until Sunday 07.08. 00:00.
The above described time range selection options are available for the following widgets:
Signal Labels
Signal labels allow you to display to end-users the meaning of a numeric signal value. Signals that represent error codes or numeric machine states can be presented as text, i.e. labels defined as substitutions for a certain ranges in a signal. The list below presents an example of engine states in text form:
| Default Engine State | Example Engine State as Text |
|---|---|
| 0 | OFF |
| 1 | Ignition ON |
| 2 | Engine Running - Idle |
| 3 | Engine Running - Work |
| 4 | Engine Running - Power |
| 5 | Error |
| You can disable signal labels when configuring a widget by toggling the Use state signal labels instead of values switch in the widget dialog: |

When enabled, hovering over the label shows the signal value:
The text display is available for the following widgets (and reports):
-
Signal State widget
-
Comparison widget
-
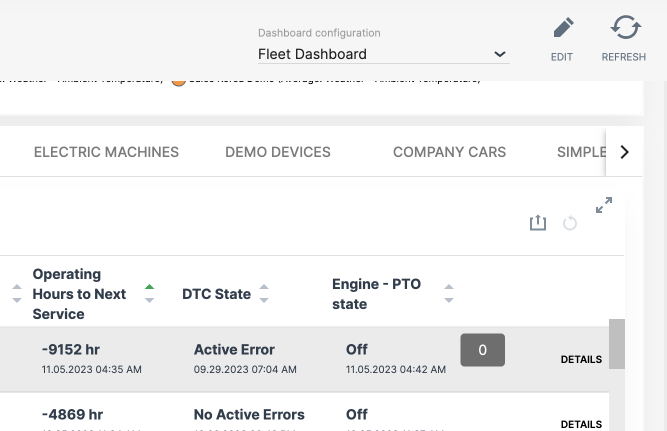
Machine List widget
-
Machine Table report
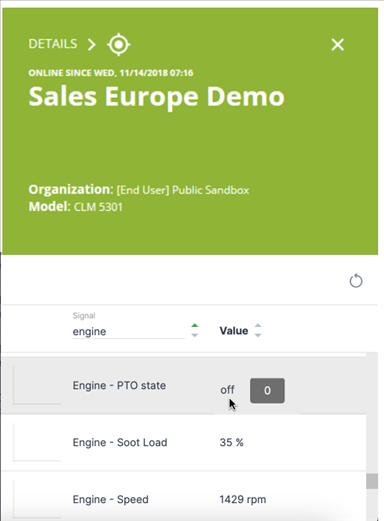
The label/text display is always activated in the Signal Overview Panel:
Note
Signal labels are configured in the PDC and not from the DataPortal directly.