Errors & Faults
The Active Errors widget provides machine owners with a visualization of active machine errors and error history up to 30 days.
Note
Custom DTCs by the machine manufacturer that are transferred on the CAN bus in the J1939 DM1 format can also be displayed in this widget
Consider that there is also the DTC widget for showing these error codes.
Note
This widget can only be selected from the Model Dashboard.
Configuration
Configure the widget and put it on the Model Dashboard by following the steps below:
It is highly recommended to adapt a Machine Page (Model Dashboard) centrally via the Machine Page Layout. If you need to configure the Machine Page for the selected machine only, proceed as follows:
-
In the selected Machine Page, select Manage Layout > Add widgets.
-
Select the desired widget. A preview will be shown.
-
Click Apply. This forwards you to the widget configuration dialog with the options described below.
If you need to adapt the Organization Dashboard, select the desired dashboard configuration and click Edit > Add  to open the widgets catalog, see also Add Widgets to the Organization Dashboard.
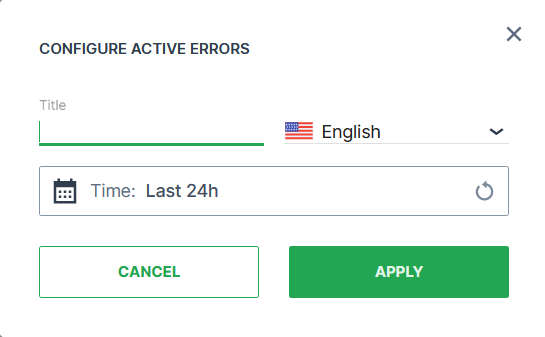
| Item | Description |
|---|---|
| Title | The label for the widget (English is the default, additional languages must be configured. See Language below). |
| Language | Select the language for the title of the widget. |
| Time | Select a predefined, relative time range, e.g. Last 24 hours or select a custom one, e.g. This last 5 Days, see Time selection. |
There are 2 tabs on the widget, Active Errors and Errors History.
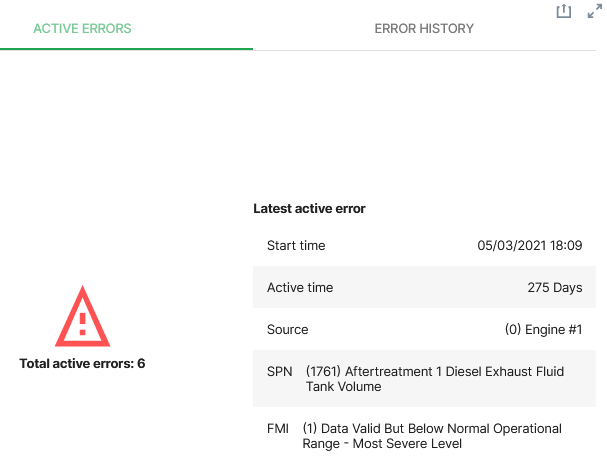
Active Errors Tab
The Active Errors tab shows:
| Item | Description |
|---|---|
| Total active errors | Most recent errors on the machine within the time period specified. |
| Latest active error | Error details. |
| Start time | When the error first appeared (local time). |
| Active time | The period of time the error is active. |
| Source | The unit on the machine where the error occurs. |
| SPN | The signal affected by the error. |
| FMI | Detailed error description. |
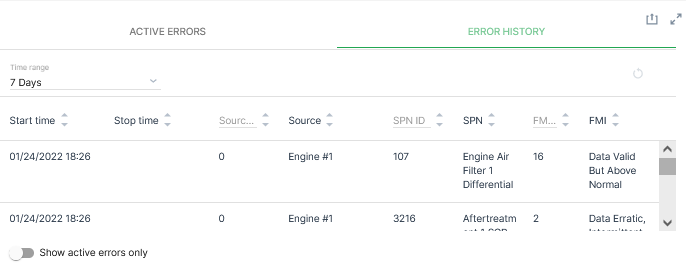
Errors History Tab
The Error History tab shows:
| Item | Description |
|---|---|
| List of errors | - |
| Time range | Select the time period for events from Relative (from the current time) or Absolute using a date picker. |
| Start time | When the error first appeared (local time). |
| Stop time | When the error was cleared* (local time). |
| Source | The unit on the machine where the error occurs. |
| SPN | The signal affected by the error. |
| FMI | Detailed error description. |
The Error History (DTC table) entries can be sorted by the Signal (SPN) or the Type of error (FMI).
Note
If the Stop time is empty, the error is still active.