Signal State
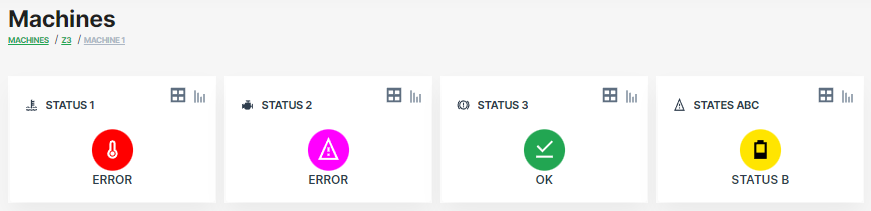
The Signal State widget allows you to display different signal values as states on a single widget. You can also display the signal state change history in a table.
Configuration
The widget is available both for the Organization Dashboard and the Model Dashboard.
It is highly recommended to adapt a Machine Page (Model Dashboard) centrally via the Machine Page Layout. If you need to configure the Machine Page for the selected machine only, proceed as follows:
-
In the selected Machine Page, select Manage Layout > Add widgets.
-
Select the desired widget. A preview will be shown.
-
Click Apply. This forwards you to the widget configuration dialog with the options described below.
If you need to adapt the Organization Dashboard, select the desired dashboard configuration and click Edit > Add  to open the widgets catalog, see also Add Widgets to the Organization Dashboard.
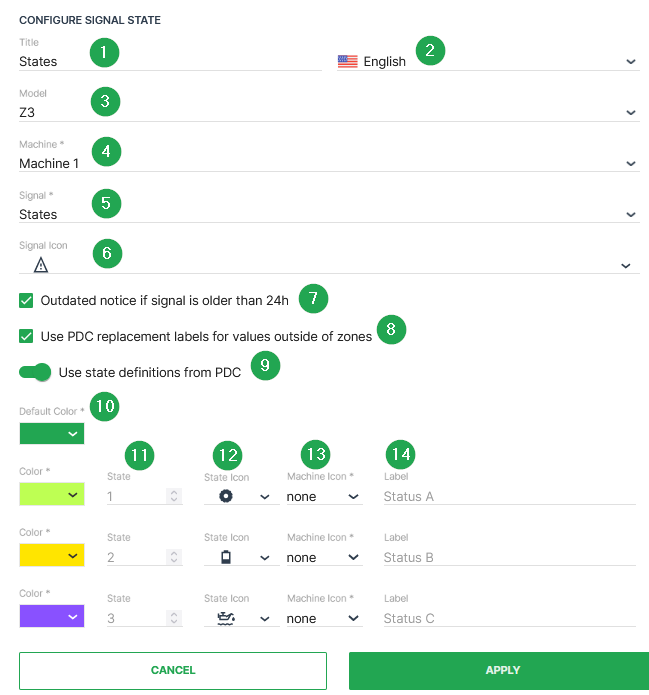
| # | Item | Description |
|---|---|---|
| 1 | Title | The label for the widget (English is the default, additional languages must be configured. See Language below). |
| 2 | Language1 | Select the language for the title of the widget. |
| 3 | Model2 | The model of the machine you select to display the state. |
| 4 | Machine2 | The machine that you select to display the state. |
| 5 | Signal | Select the signal to be displayed. |
| 6 | Signal Icon | Select the icon to represent the signal from the available options. |
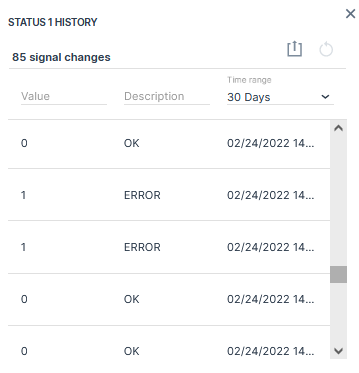
| - | Show button3 to see Signal history table | Display the signal value history including value, description and time of change. |
| 7 | Outdated notice if signal is older than 24h | If the current signal state is older than 24 hours the notice is displayed. |
| 8 | Use PDC replacement4 labels for values outside of zones | If enabled, a non-defined state is replaced by the text which is configured in the conditional replacement from the PDC View Definition. |
| 9 | Use state definitions[^5] from PDC | With this option enabled, the configured states from the PDC Value Definition are used. |
| 10 | Color | Select the color to represent the signal in the widget. |
| 11 | State | Original state value from device in binary or numeric format. |
| 12 | State Icon | Select the icon to represent the signal from the available options. |
| 13 | Machine Icon | Optional the machine icon can be also displayed below the state icon. |
| 14 | Label | Defines the string that should be used in place of the numerical value. |
| - | Language1 | Select the language for the label of the signal state. |
[^5] The Use state definitions from PDC option is the recommended method to translate boolean or numeric values into text. The advantage is that the PDC state definition can be also used for other widget layouts without any further efforts regarding the label's configuration. Please be aware that this option is only available when the assigned PDC has states defined according to PDC Value Definition.
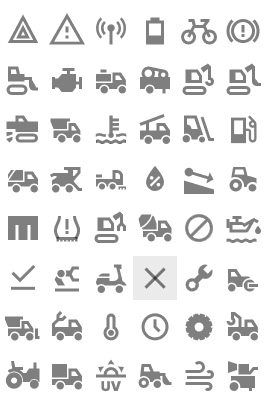
The Signal Icon and State Icon have a set of icons available that you can choose to represent the signal or state.
Sample
Selecting the Report ![]() icon you are brought to the Report Chart which displays the trends over time for this signal.
icon you are brought to the Report Chart which displays the trends over time for this signal.
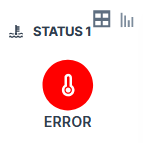
Selecting the History Table  icon you are forwarded to the signal history which displays all signal values received by the DataPortal.
-
Individual labels for the available languages of your DataPortal account can be configured. Please also note: When using the state definition from the PDC, the state labels for each language are used from the PDC and the language option for the state labels is hidden within the signal state configuration dialog. ↩↩
-
This option can only be selected when configuring the state widget at the DataPortal fleet dashboard. ↩↩
-
The Show button to see Signal history table option can only be selected for a single machine within the model based dashboard. ↩
-
This option is only working when conditional replacement is configured in the PDC View Definition. ↩