History
The History widget allows users to view historical signal values (for single or many machines/signals) on a chart.
Configuration
Configure the widget and put it on the Organization Dashboard and/or the Model Dashboard by following the steps below:
It is highly recommended to adapt a Machine Page (Model Dashboard) centrally via the Machine Page Layout. If you need to configure the Machine Page for the selected machine only, proceed as follows:
-
In the selected Machine Page, select Manage Layout > Add widgets.
-
Select the desired widget. A preview will be shown.
-
Click Apply. This forwards you to the widget configuration dialog with the options described below.
If you need to adapt the Organization Dashboard, select the desired dashboard configuration and click Edit > Add  to open the widgets catalog, see also Add Widgets to the Organization Dashboard.
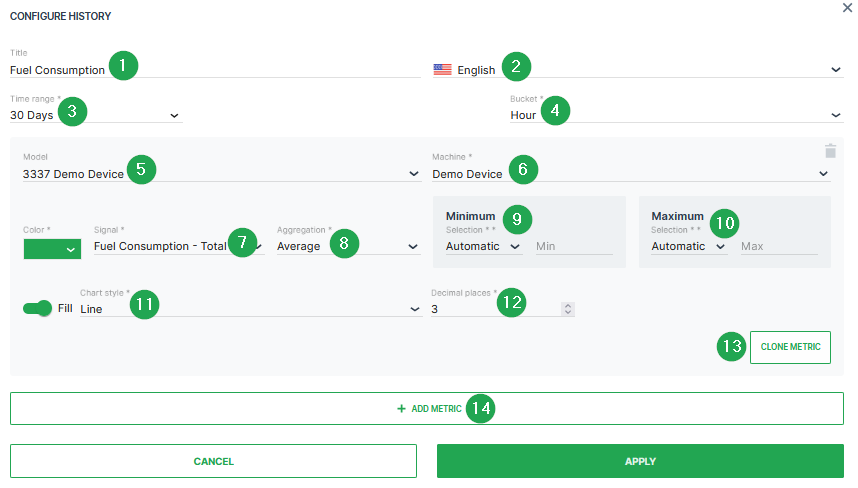
| # | Item | Description |
|---|---|---|
| 1 | Title | The label for the widget (English is the default, additional languages must be configured. See Language below). |
| 2 | Language | Select the language for the title of the widget. |
| 3 | Time | Select a predefined, relative time range, e.g. Last 24 hours or select a custom one, e.g. This last 5 Days, see Time selection. |
| 4 | Bucket | Choose the time intervals between data points in the report from hour, day or week, see below. |
| 5 | Model* | The model of the machine. |
| 6 | Machine* | The machine you want to select. |
| 7 | Signal | Select the signal to be displayed. |
| 8 | Aggregation | The value returned for the signal, calculated using all the measurements within each Bucket. |
| 9 | Minimum | Default scaling is Automatic. Optional you can select Manual. If the minimum value for the chosen signal is configured within the PDC, Predefined by OEM would be also an available scaling option. |
| 10 | Maximum | Default scaling is Automatic. Optional you can select Manual. If the maximum value for the chosen signal is configured within the PDC, Predefined by OEM would be also an available scaling option. |
| 11 | Chart Style | Choose the style from columns, lines or steps. |
| 12 | Decimal places | Select the number of decimal places for the value. |
| 13 | CLONE METRIC | Duplicate the settings from a configured signal. |
| 14 | ADD METRIC | Add another metric to the report. |
Note
*This config option can only be selected from the DataPortal Organization Dashboard.
Configure Buckets
As an admin with the Dashboard:Admin permission set, you may define default values for the bucket used for each (relative) time range
If the buckets are not defined, the following buckets will be selected automatically.
Note
The buckets are not selected when clicking the diagram icon which leads you to configuration of the Report Parameters, see also Sample below for an example.
| Relative Time Range | Bucket |
|---|---|
| Default | As specified by Dashboard:Admin |
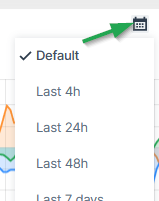
| Last 4h | minutes |
| Last 24h | hour |
| Last 48h | hour |
| Last 7 days | days |
| Last 30 days | days |
| Today so far | hour |
| Yesterday | hour |
| Current week | day |
| Current month | day |
| Current year | month |
| Previous week | day |
| Previous month | day |
| Previous year | month |
As an admin, you can also set the default configuration for the minimum and maximum values
When a user selects another time range than the default (by clicking the calendar icon), the automatic minimum and maximum values are selected (not the configured ones):
Sample
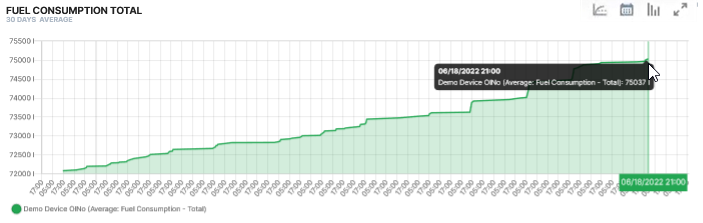
The History widget offers additional configuration options on the dashboard:
-
 Clicking on the diagram icon in the top-right of the widget opens the CONFIGURE PLOT window to create a Report.
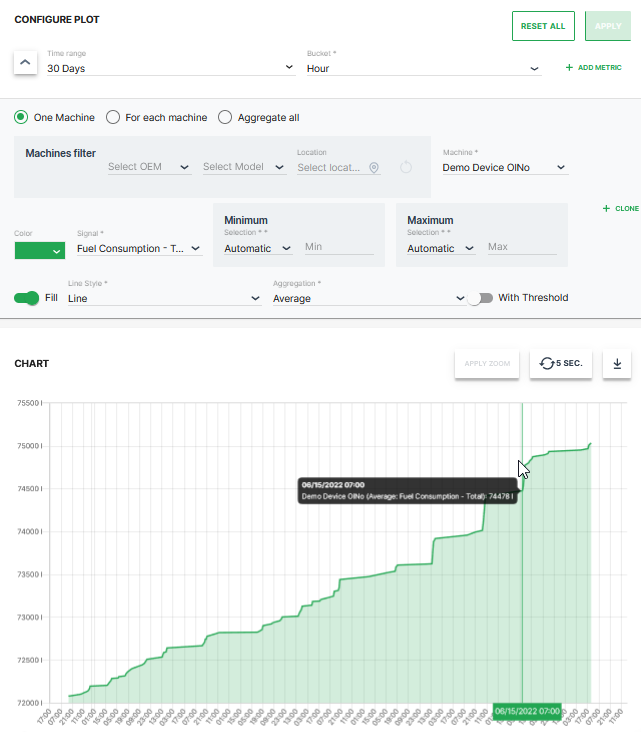
Figure 4: Report Example -
 The Total Delta Values icon is available in the History widget only for (continuous) counter signals with delta aggregation
Its function is to sum up the values for the selected time range allowing you to get an idea of totals without manual calculation for each signal in the widget
See the following example for machine operating hours: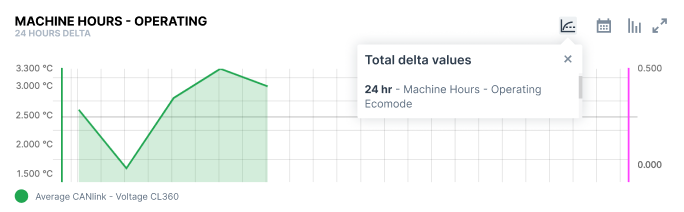
Figure 5: Total Delta Example