DataPortal User Manual
General

The information is organized into the following sections:
-
Get started with the Proemion DataPortal, browser settings, login and concepts.
-
The user interface, personalization, and search.
-
Introduction to widgets.
-
An overview of your machines.
-
Tools for the day-to-day operation of each machine.
-
Settings topics such as organization and model management, user permissions and interface design.
-
Tools for the day-to-day operation of your fleet.
The DataPortal is the front end of the DataPlatform, a REST-based web application. The documentation and API data can be accessed at our Document Library.
Introduction
Audience
OEM's are the primary Audience of this Manual, given that the content is related to permission and Accessibility to the various parts of the DataPortal.
Browser
The DataPortal is a responsive web-application that works flawlessly on any operating system. The 2 most recent releases of each of the browsers in the table are tested compatible with the DataPortal.
| Performance Rank | Browser |
|---|---|
| 1 | Google Chrome (recommended) |
| 2 | Mozilla Firefox |
| 3 | Edge (only current version) |
| 4 | Safari |
Viewing the DataPortal on mobile devices is optimized for the following screen sizes:
-
1920 x n
-
1024 x n
-
600 x n
-
380 x n (minimum supported width)
The DataPortal is demoed on phones and we strive to support the following pages for viewing (not editing):
Browser Troubleshooting
In case there is an issue with a certain browser, perform the following steps:
-
Update the browser to the latest version
-
Check if the problem exists with an up-to-date version of a different browser from the list
-
Contact support with the details and steps to reproduce the issue
Note
Proemion will no longer actively support the use of Internet Explorer to access DataPortal.
Login Page
To sign in to the DataPortal, proceed as follows:
-
Open a web browser and go to DataPortal.
-
Enter your Username and Password.
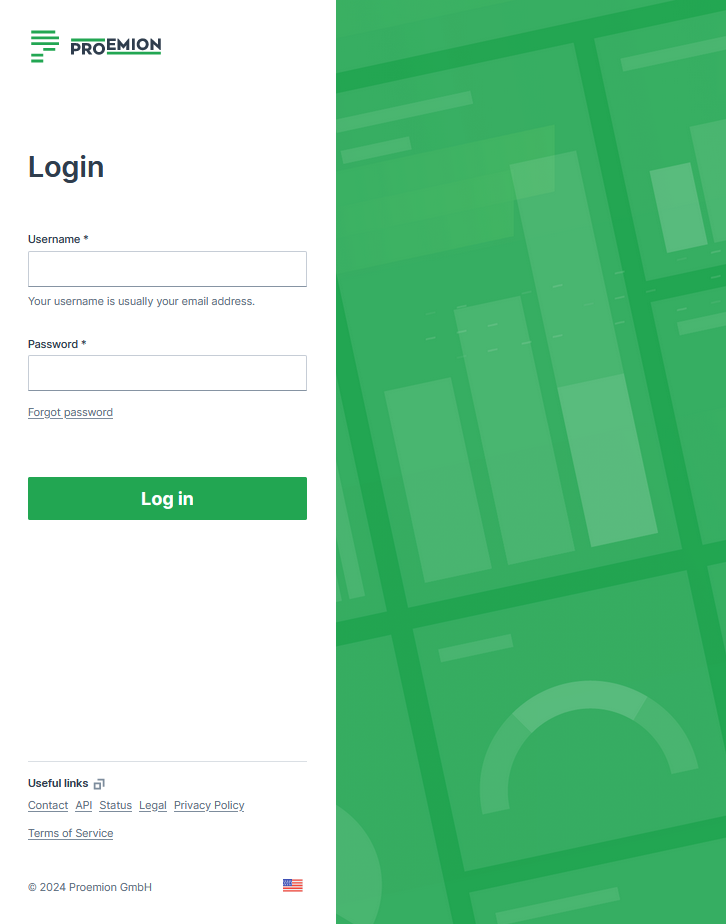
Figure 1: Enter your Username and Password -
Select Log in
If you enter an incorrect password multiple times, the login screen may be temporarily locked. If you forgot your password, see Password Reset.
You can change the language in the footer. The Login page can be customized in Themes.
The default URL for the Proemion login page is https://dataportal.proemion.com/.
If you use an OEM-branded access to the DataPortal, use the URL provided by your OEM.
Usernames for DataPortal are not case-sensitive.
Sign out behaviour
When users sign out of the DataPortal:
- The user´s session ends.
- The user is returned to the login page.
- No redirect to an external URL occurs.
Alias Email
For the email address, usually used as the username, it is allowed to use email subaddresses, provided that your email provider supports it. By that, you can have multiple accounts with 1 email address, e.g. myemail+machine-owner@oem-mail.com.
This feature supports Dealers that work on multiple OEMs; there might be many users that need multiple emails to log in to different OEMs' DataPlatform accounts. It can also help a single OEM's user to create test users for different organization unit types or even subcustomers, e.g. myemail+dealer@oem-mail.com, myemail+customer-a@oem-mail.com.
Alternative method for alias email
If the method described above does not work, consider the following option to make it work:
Use machine-owner+myemail@oem-mail.com, instead of myemail+machine-owner@oem-mail.com.
Some providers require the alias directly before the @ symbol, i.e. "current-username+alias@oem-mail.com". For concrete examples, see the following list:
-
Gmail (Google): Format:
username+alias@gmail.com-
You do not need to create a new email or user to receive these emails to your primary Gmail account.
-
You may need to create an official alias within Gmail to reply FROM your account without exposing your actual Gmail address.
-
-
Microsoft: Format:
username+alias@domain.comfor Outlook services (such as Live.com, Outlook.com and possibly more)- You may need to create an official alias within Outlook to reply FROM your account without exposing your actual Outlook address.
-
Proton Mail (proton.me): Format:
username+alias@proton.me
The use of the "+" symbol in email addresses, often referred to as "plus addressing" or "subaddressing," is described in RFC 5233 "Sieve Email Filtering: Subaddress Extension" and RFC 5321 "SMTP" section 4.5.1. Between RFC 5321 SMTP and RFC 5233 Sieve Email Filtering: Subaddress Extensions, the lack of a universal standard allows providers to interpret placement individually, leading to variations in how subaddressing is implemented across different email systems.
Password Policy
New users are asked to create a new password with the following criteria:
The password must have:
-
Min 12 characters.
-
Max 64 characters. Any character is allowed.
-
Different from username or email.
-
Max 2 consecutive characters.
Password Reset
Users can reset their password by selecting the Forgot password link. You are then prompted to enter the account email address and a link to change the password will be sent. Enter your new password according to the Password Policy.
Note
The link for the password reset is valid for 10 minutes.
Note that as an admin you may also Force Password Reset, Suspend Users and Inactive Users or Delete Users.
Note that when an admin used the Force Reset Password option, you as the user don't receive an email and can't log in unless you create the new password via Forgot password as described.
Permissions
In the DataPortal, you can assign each user individually a Permission Set.
A Permission Set is a group of entitlements consisting of levels and subjects that can be organized by user roles. User roles combine specific Permission Sets to represent a functional role within your organization. Permission Sets are assigned during user account creation. For details, see User Management.
The following documentation gives you an overview of:
- the subjects including the entitlements for each level
- the assignment of user roles
Levels
The level defines which actions the user can perform for a given subject.
Beginning with level View, each successive level contains the capability provided for in the previous level.
| Level | Description |
|---|---|
| None | The user can sign in to the DataPortal but has no subject visibility. |
| View | The user can consume the subject data but cannot remove or change the configuration. The account is limited to read access. |
| Maintain | The user can perform management operations (i.e. set password, change name) on a pre-set configuration for the subject |
| The user however usually cannot perform create/delete operations. | |
| Admin | Full operation capability including create/delete for a given subject in all visible organizations. The account is able to perform CRUD (create, read, update and delete) operations for users and subjects for all visible organizations for the subject. |
Note
Keep in mind that Permission Set Levels are applied across all child organization units.
Subjects
The Permission subject defines the DataPortal entity or object that the level applies to. The principle DataPortal subject, descriptions and permissions levels are described in this section.
The following subjects are available for assigning permission levels to users:
Subject Descriptions
The following tables list the available subjects along with their descriptions for each permission level.
Assignment Subject
The Assignment Permission Set is allows users to edit and maintain Assignments.
| Level | Description |
|---|---|
| View | Allows access to assignments. |
| Maintain | Allows updating the: |
| - assignment title | |
| - assignment description | |
| - assignment time range | |
| - assignment external key | |
| - assignment status | |
| - assignment machines | |
| Admin | Allows creating a new assignment. |
| Allows deleting a new assignment. |
Note
Assignments access is limited to exact organization unit match.
Contract Subject
The Contract Permission Set allows users to edit and manage the contracts of the machines' CU.
| Level | Description |
|---|---|
| View | View contract data for the machine with the basic attributes: |
| - contract identifier | |
| - order number | |
| - state | |
| - end date | |
| Submit a contract renewal request. | |
| Maintain | View the contract attributes: |
| - tariff description | |
| - activation date | |
| - start date | |
| - next billing date | |
| - tariff begin date | |
| - tariff end date | |
| Perform Go Live requests on provisioned machines. | |
| Admin |
Dashboard Subject
The Dashboard Permission Set allows users to edit and manage organization and model dashboards for their organization(s).
Note
This permission can be only granted to users within tenant organization and of Organization Type "OEM".
| Level | Description |
|---|---|
| None | The user is not allowed to edit or create dashboards. |
| Admin | Allows to edit and manage dashboards. |
Note
Assignment of additional dashboards to lower level organizations will break the chain of inheritance. Please refer to chapter Dashboard.
ECU Subject
The ECU Permission Set allows users to access and manage ECU Firmware Over-the-Air (ECU FOTA) features, including Software Repositories, Electronic Architectures, and ECU update requests. For further information read the ECU FOTA documentation.
Note
The ECU Permission Set is only available when ECU FOTA has been activated for the organization by Proemion. Contact your Account Manager or Field Application Engineer (FAE) to request activation.
| Level | Description |
|---|---|
| Admin | Allows access to Software Repositories and firmware version management. |
| Allows creating and configuring Electronic Architectures and ECU definitions. | |
| Allows creating and managing ECU update requests. |
Location Subject
The Location Permission Set governs user access to location data for all events, tracking, reports, maps and notifications. Location access is set to none by default and must be configured by an administrator.
| Level | Description |
|---|---|
| None | The user is not allowed to see any location data. |
| Latest location | The user location data view is restricted to the current location. |
| Location history | The user can view the latest location and location history. |
Maintenance Task Subject
The "Task" subject is referred to as the Maintenance Task Subject within this manual.
The Maintain permission level for this subject is typically granted to the Dealer user role
Tasks can be seen if the user can access the machine.
| Level | Description |
|---|---|
| View | - Enables users to see the scheduled Maintenance Tasks. |
| - Users with solely machine view permission can also see them. | |
| - The status Upcoming, Overdue, Completed and Skipped can be viewed, but not edited. | |
| - Checklist item updates can be viewed only when the maintenance task has been completed, but not in the History | |
| They will appear as "Pending" until the task is completed, then will show as the actual state. | |
| - Print Maintenance Tasks. | |
| - View the feature Acknowledge Maintenance Tasks | |
| Maintain | Can change the status of a maintenance tasks for a machine |
| Can update the activities checkboxes and the completion note | |
| Can view the History of the assigned maintenance task. | |
| Admin | Can assign a maintenance task to another user |
| Can view the History of all maintenance tasks | |
| View the signature for Acknowledge Maintenance Tasks. |
Operational Subject
The Operational:View Permission Set allows read-only access to Product Data and selected Related Service Data via the Proemion REST API. It was introduced to support compliance with the EU Data Act (Regulation (EU) 2023/2854) and is only used for the creation of REST API Clients to facilitate data access. The Operational:View Permission Set can replace the previous Permission Set for relevant endpoints, enabling secure access to the required data.
For example, if an endpoint previously required Machine:Admin Permission Set for reading Related Service Data, it can now be accessed with either the Machine:Admin or the Operational:View Permission Set.
| Level | Description |
|---|---|
| View | Allows API clients to retrieve readily available Product Data and selected Related Service Data. This level does not allow modification of machines, configurations, actions, or services and does not provide access to Derived Information. |
Organization Subject
The Organization Permission Set allows users to edit and manage users and machines of the organization (unit).
| Level | Context | Description |
|---|---|---|
| View | - | User can view organization units. |
| Maintain | Org Unit | View: - OEM external key (filter and sort) |
| Move: - machines to a different organization unit - users to a different organization unit |
||
| Update: - organization unit parent based on the candidate list - organization unit type - organization unit Name - user Permission Sets |
||
| Retrieve a list of: - organization unit parent candidates - user Permission Sets |
||
| Create an organization unit. | ||
| Delete an organization unit. | ||
| Share machines to a different organization unit. See Machine Share Definitions |
||
| User | Retrieve a list of all users or a single user's details. | |
| Update: - user details - user email |
||
| Create new user. | ||
| Change a user's ban status. | ||
| Resend and invitation email to an inactive user. | ||
| View the last login and the email address of users. | ||
| Details | Allows access to the data analytics instances of your organization unit. | |
| Admin | Org Unit | Create and change the OEM external key (only as admin of the parent organization) |
| User | Create new user. | |
| Assign user roles. | ||
| Change a user's ban status. | ||
| Resend and invitation email to an inactive user. | ||
| View the last login and the email address of users. | ||
| Dashboard | Create Edit and Delete sets of metrics used in efficiency definitions. |
Realtime Subject
The Realtime Permission Set controls access to real-time related functionality, pages, and device behavior and allows users to change settings for the CANlink® mobile 3600.
| Level | Description |
|---|---|
| View | Grants read-only access to protected real-time data. |
| Allows to view real-time events on the Events page. | |
| Allows to view real-time related information on the Diagnostics page. | |
| Grants read-only access to the Remote Machine Tunnel feature. | |
| Admin | Provides full control over real-time functionality, e.g. endpoint management for the Remote Machine Tunnel . |
| Can switch the CANlink® mobile 3600 to Realtime/Logging. |
Report Subject
The Report Permission Set is used for Reports.
| Level | Description |
|---|---|
| View | Enables user to view report pages. |
| Maintain | - |
| Admin | - |
Tenant Subject
The Tenant Permission Set allows users to edit subjects on the tenant level.
| Level | Description |
|---|---|
| View | - |
| Maintain | - |
| Admin | Can Configure the DataPortal Imprint document. Can upload legal documents (Privacy Policy and EUA) in different languages. |
Theme Subject
The Theme Permission Set allows users to edit and manage themes for their organization.
| Level | Description |
|---|---|
| None | The user is not allowed to manage the theme. |
| Admin | Allows to edit and manage themes. |
GeoArea Subject
The Geo Area permission allows users to manage Geo Areas.
There is no distinction between the levels. One Permission Set allows to create, modify, delete geographical areas bound to organizations.
AEMP Subject
Note
The AEMP Export API is a read-only (unidirectional) interface and thus only the view level is applicable.
The AEMP permission set allows users to access the DataPlatform via the AEMP API interface by using API clients
AEMP permission is by default set to none for new accounts and can be enabled via the DataPortal
For more information about accessing the AEMP interface, read Access AEMP Service.
| Level | Description |
|---|---|
| None | The user is not allowed to use AEMP export/import service. |
| View | Allows access to the DataPlatform via the AEMP API interface. |
Machine Subject
The Machine permission set allows users to configure and manage machines.
| Level | Description |
|---|---|
| View | Enables user to view machine data. |
| Allows activating GeoLeash on this machine. | |
| Allows deactivating GeoLeash on this machine. | |
| Allows access to GeoLeash configuration and history for this machine. | |
| Allows configuring Timefence. | |
| Allows changing the: - machine name - GeoLeash length configuration for this machine |
|
| Maintain | Allows assigning a model to a machine. |
| Allows switching CU's communication mode between logging and realtime. | |
| Allows starting a realtime diagnosis session for the current user on this machine. | |
| Allows starting a realtime diagnosis session for the current user. | |
| Admin | Provisioning |
| Enables user to transfer files to and from the machine via browser including viewing history. | |
| Allows: | |
| - modify machine serial number | |
| - modify machine PIN (Product Identification Number) | |
| - modify machine VIN (Vehicle Identification Number) | |
| - view PDCs | |
| - assign a PDC to a machine | |
| - view configurations and bundles | |
| - view current and historical COTA requests of a machine | |
| - create a COTA request for a machine | |
| - view current and historical FOTA requests of a machine | |
| - create a FOTA request for a machine |
Model Subject
The Model permission set allows users to configure and manage the machine models.
| Level | Description |
|---|---|
| View | Enables user to view machine model data. |
| Maintain | Allows changing the: |
| - model name |
|
| - model description | |
| - model image file | |
| - model data configuration (PDC) | |
| Allows overriding the data configuration (PDC) assigned to machines at model level by assigning a data configuration to a specific machine. |
|
| Allows the assignment of Asset Types. | |
| Admin | Allows create/update: |
| - a new model | |
| - a threshold for a signal | |
| - a new Asset Types (only as OEM organization unit) | |
| Allows deleting: - a model - a threshold for a signal - an Asset Types (only as OEM organization unit) Allows management of PDC files: - view PDCs - upload - download - assign to a model - assign to a machine Allows management of COTA and FOTA - view configurations and bundles - create configurations and bundles - download configuration files - view current and historical COTA requests of a machine - create a COTA request for a machine - view current and historical FOTA requests of a machine - create a FOTA request for a machine |
Note
Models assigned to the parent organization of a machines org unit are visible to the machine owner.
Personal User Settings
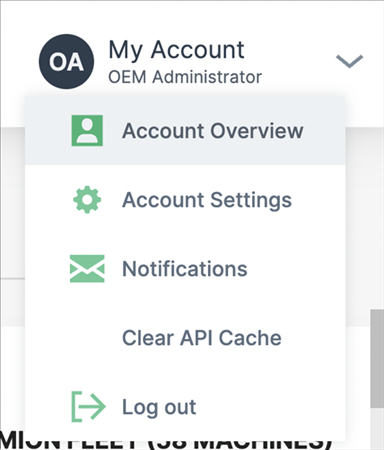
The Account Settings menu in the top right-hand corner of the DataPortal allows you to personalize your preferences:
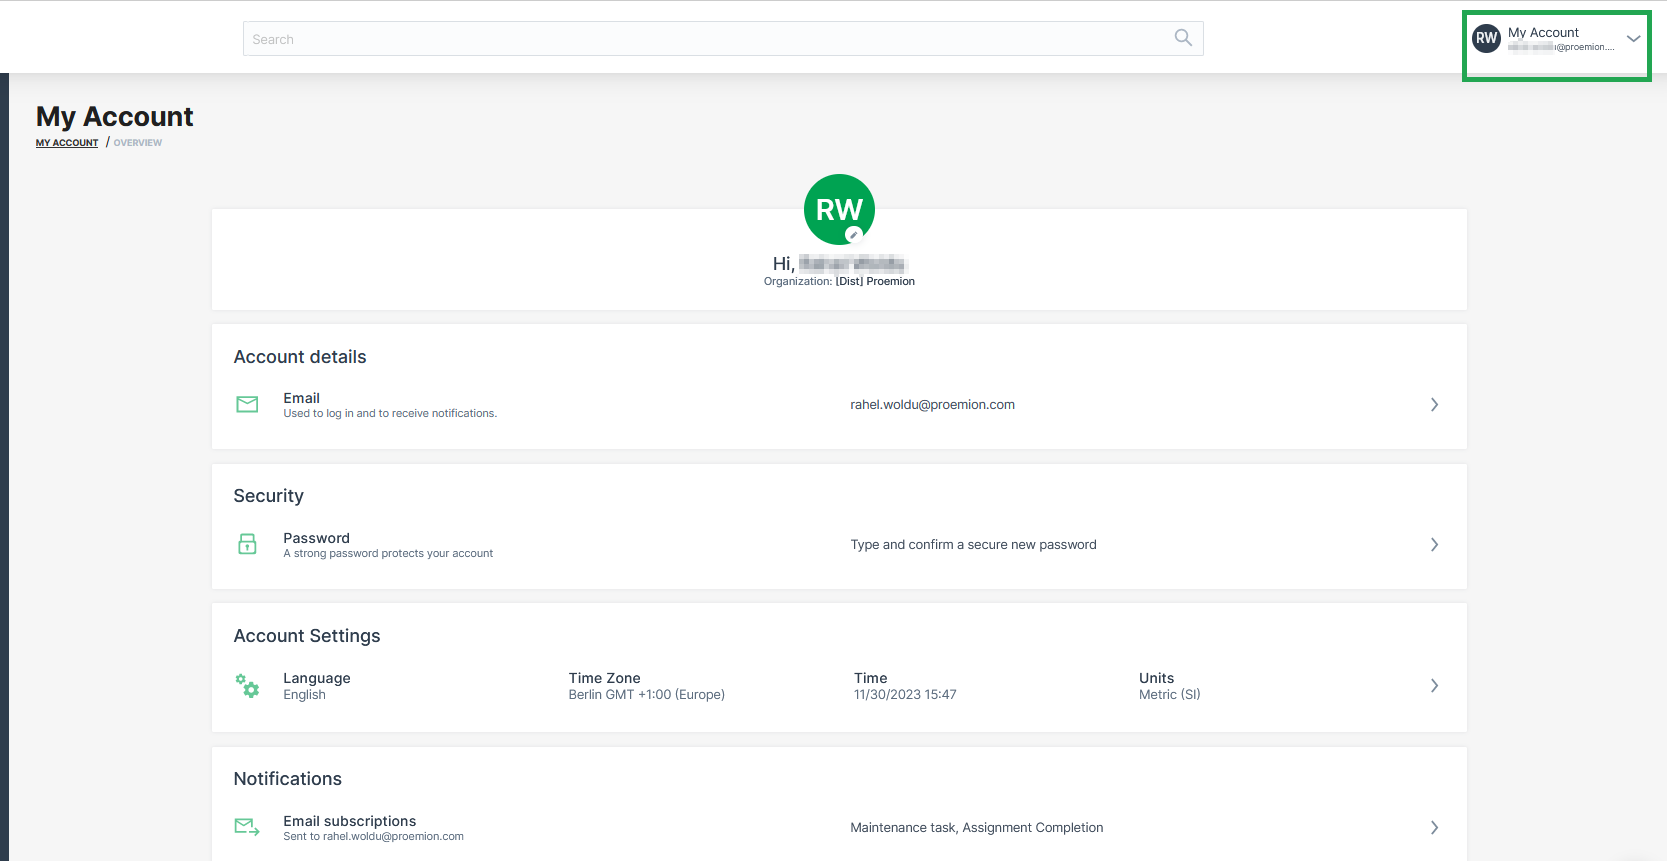
Selecting Account Overview you can view and change:
-
Name
-
Organization
-
Username
-
Email
-
Password
-
Language
-
Time Zone
-
Date & Time format
-
Notifications
The permission sets panel displays your authorizations.
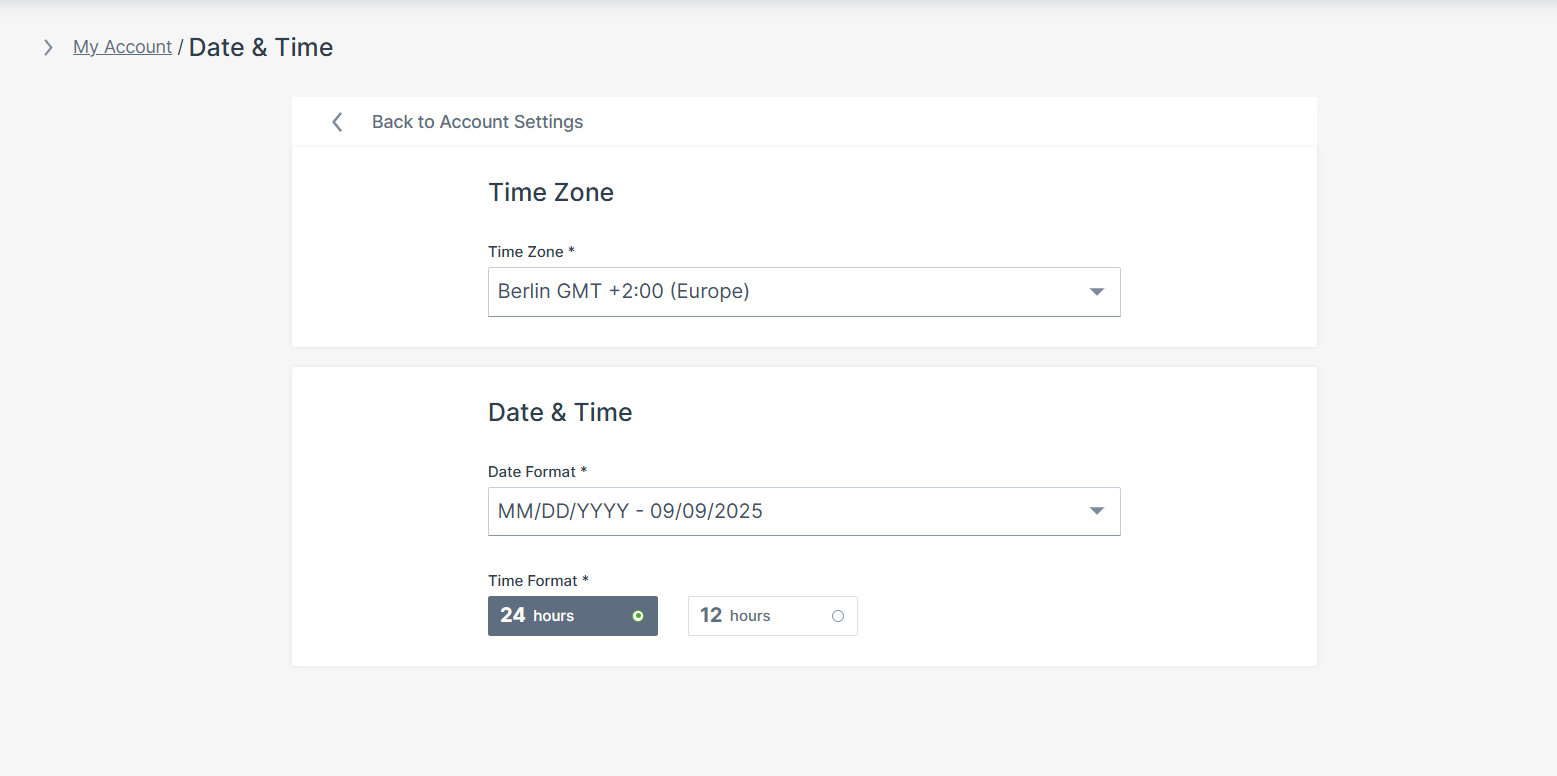
Date & Time
In the Account Settings menu, you can configure your time zone and date format preferences. All machine data displayed in the DataPortal uses the time zone set here. By default, this is your browser´s time zone.
Lab Mode
In the Account Settings menu, the Lab Mode enables functionalities in an experimental state activated via Feature Switch in the Organization Administration menu
The Feature Switches are available for features regarding Data Science, Sections and Languages.
You have the option to enable Lab Mode in your Personal User Settings.
Note
Note that the Lab Mode must be activated first for each feature, see Lab Mode Activation.
To change the status of Lab Mode for your user profile, proceed as follows:
-
Select the Account Settings in the top right-hand corner of the dashboard.
-
Select Lab mode.
-
Toggle the status ON or OFF.
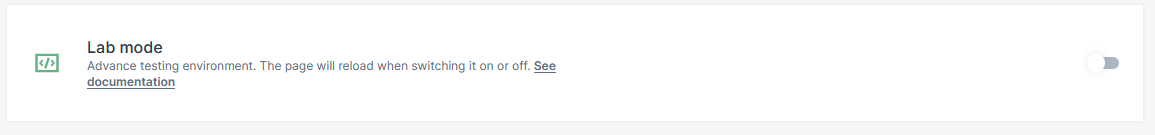
Once Lab Mode is enabled for the profile, features activated are visible in the DataPortal interface.
Numbers Formatting
In the section numbers formatting, the unit system, the decimal separator and the thousand separator can be defined.
-
In My Account, click Account Settings.
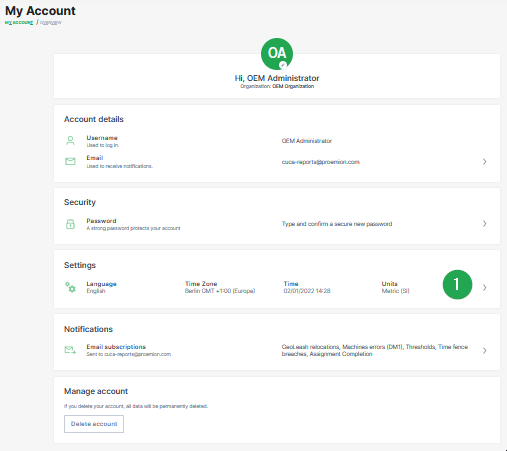
Figure 5: My Account Settings -
Click Numbers formatting.

Figure 6: Select Numbers Formatting -
Select a unit system.
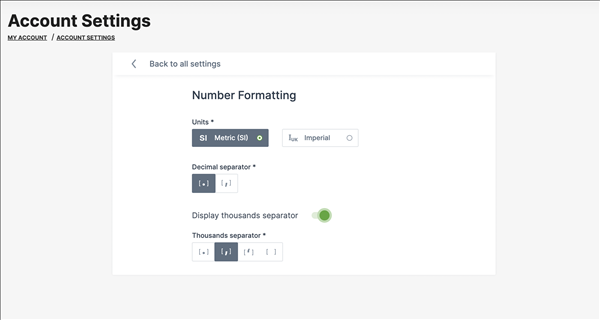
Figure 7: Definition Numbers Formatting -
Select the desired type of decimal separator.
-
Enable optional a thousand separator and select the desired type for it.
Notifications
Subscribe to DataPortal Notifications
The DataPortal has a number of features that allow you to subscribe to daily notification per email.
Note that for receiving notifications about Assignment Completion you must have at least maintain permission.
To access the subscription's settings page:
-
Select My Account in the upper right corner of the DataPortal Dashboard.
-
Select Notifications to open the notification settings page.
-
Depending on your assigned Permission Sets the dialog will appear as shown:
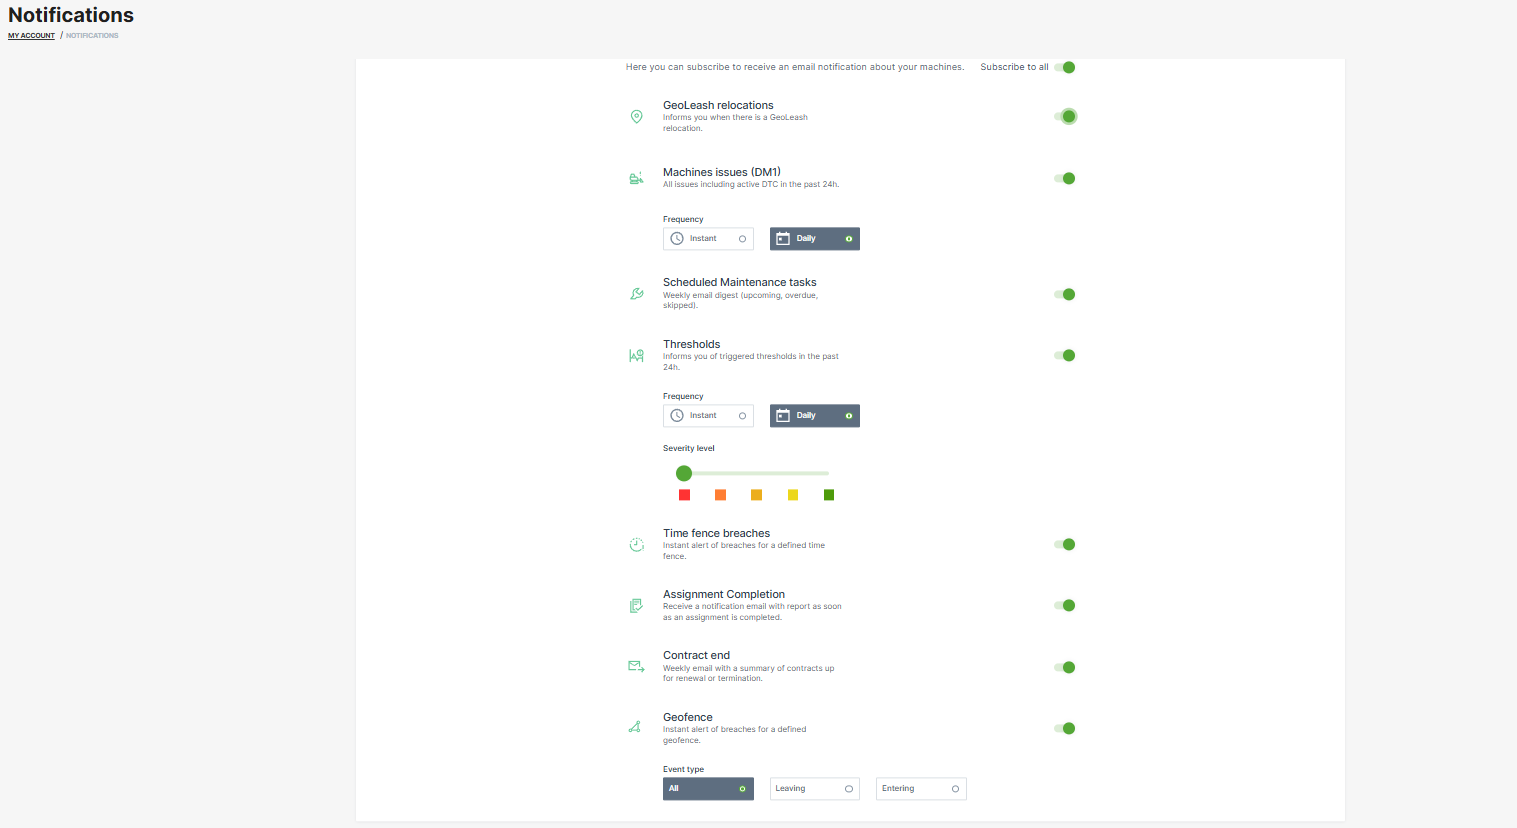
- You can now activate and configure the notifications for the following events:
| Notification | Description |
|---|---|
| GeoLeash | An email is sent immediately when a GeoLeash event occurs for a machine. |
| Machine Errors | You can choose from Daily or Instant (when the code is triggered) event notifications with a list of machines that have registered a DTC within the past 24 hours |
| NOTE: You won´t receive DTC or threshold notifications from machines which you can only access through a share. | |
| Maintenance Tasks | Receive a weekly summary of maintenance tasks and their current status for your machines |
| The email includes an Excel attachment containing the same structure as in exporting Maintenance tasks, and additionally the machine's location. | |
| Thresholds | You can choose from Daily or Instant event notifications that includes a summary of threshold breaches of the subscribed security level and the location of the machine of the past 24 hours |
| NOTE: You won´t receive DTC or threshold notifications from machines which you can only access through a share. | |
| Time Fence | An email is sent immediately when a Time Fence event occurs for a machine. |
| Assignment Completion | Receive a notification email with report as soon as an assignment is completed. |
| Contract end | Receive a weekly notification email about contracts ending soon. |
| GeoFence | Receive a notification email when a machine from the buisness unit enters or leaves a GeoFence; requires Location:Location history Permission Set. |
Note
Location data access (visibility) for notifications must be set by an organization admin.
DTC Notification
The Proemion DataPortal features a daily email summary of machines with DTCs (diagnostic trouble codes or errors codes) within the previous 24 hours (active and cleared errors). This feature enables machine owners to quickly identify machine issues and track their resolution
Notifications are sent once per day and include a list of and links to machines with DTCs.
Note
You won´t receive DTC notifications from machines which you can only access through a share.
Notification Content
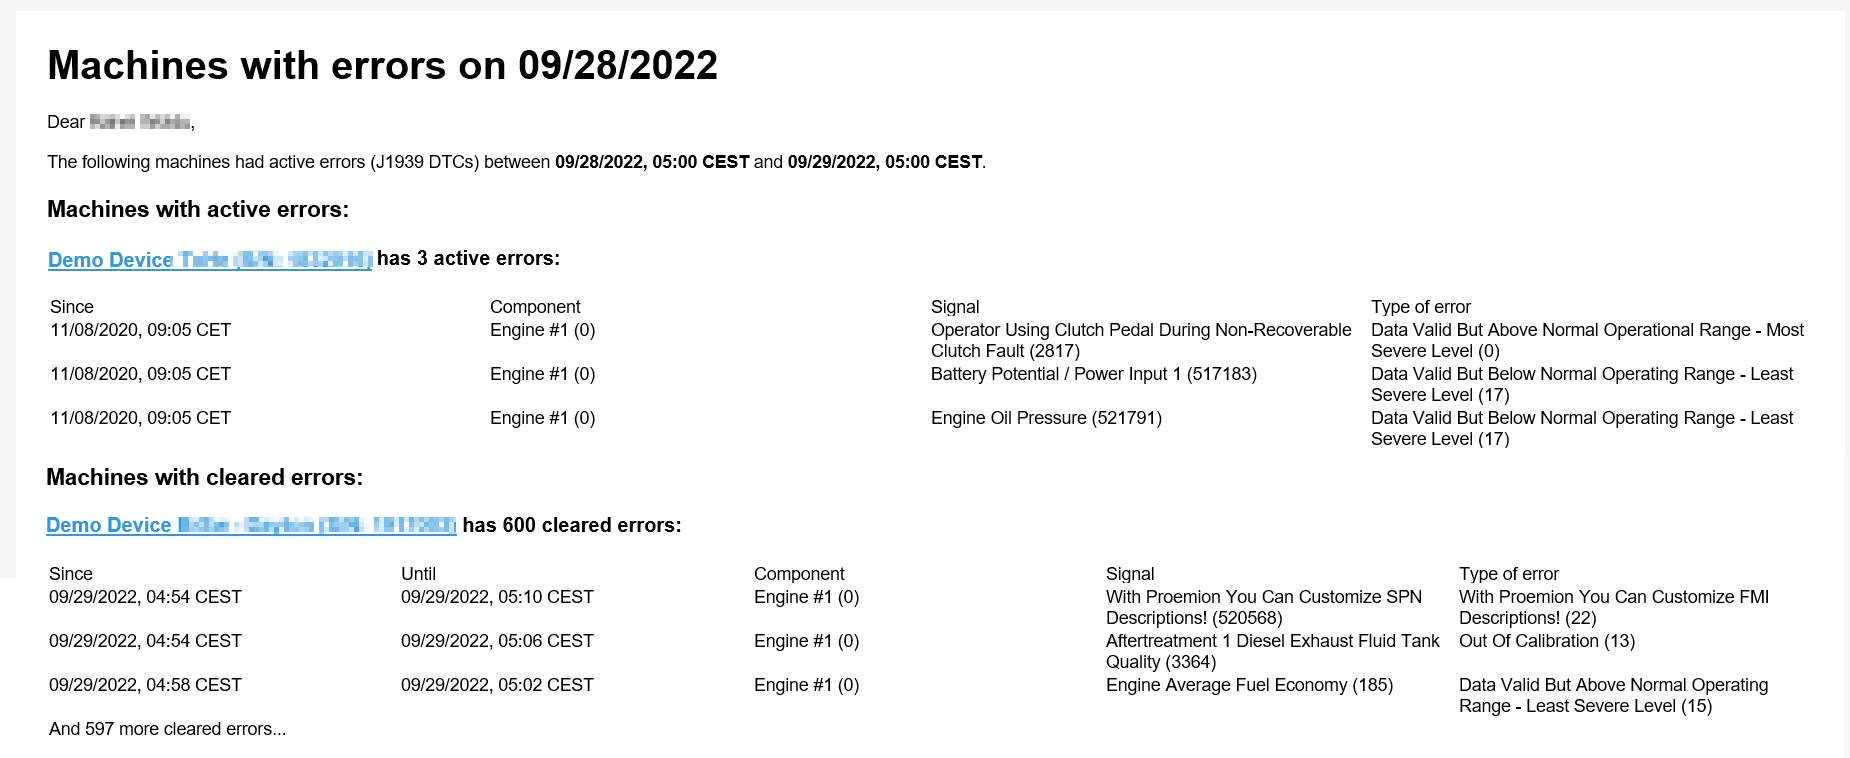
The email contains the information described in the table below.
| Element | Description |
|---|---|
| Machine | Links to the Machine Page in the DataPortal. |
| Time | Shows when the error started, resp. when it ended (for Machines with cleared errors). |
| Component | Machine component. |
| Signal | Signal that shows erroneous behaviour. |
| Type of error | Type of failure detected.. |
| Severe Level | Level of severity, e.g. "Least Severe Level (17)". |
| Excessive Indicator | If there are more than 3 error entries or more than 100 machines with errors, this will be indicated in the summary. |
Subscribe to DTC Notifications
To subscribe to DTC notifications for your organization, configure the Machines errors (DM1) in your Notifications settings.
Once notifications are configured the user will receive DTC Notifications for all the machines in their visible organization(s)
The notifications are sent daily between 5 a.m. and 6 a.m (local time).
Threshold Notification
The Proemion DataPortal features email notification of machine signal changes outside of normal signal value (or healthy) range. Values in the healthy range are defined by thresholds which are set by the OEM/manufacturer, see Threshold Configuration.
Notifications are triggered when a signal value breaches a threshold. A summary of threshold breaches is sent once per day
The summary includes all threshold breaches of the subscribed severity level.
Note
You won´t receive threshold notifications from machines which you can only access through a share.
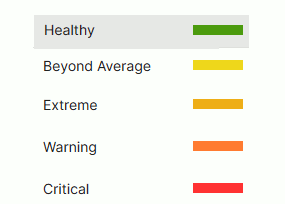
Severity Levels
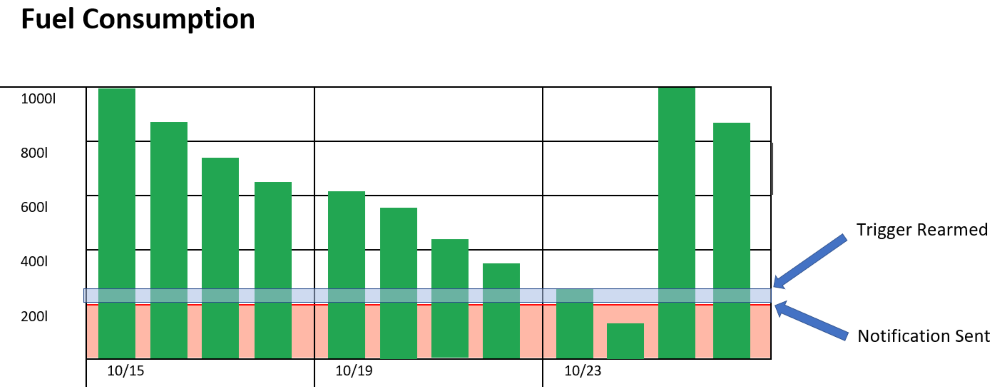
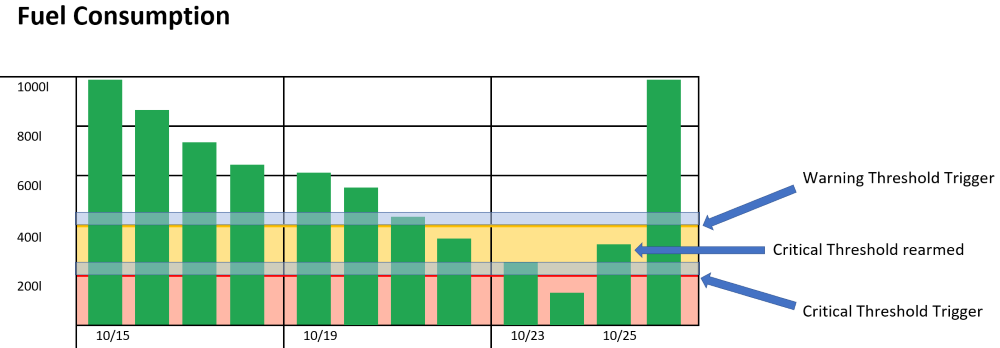
A severity level indicates the signal value is outside of (above or below) the healthy range. If a value breaches a threshold but later returns to the healthy range, the threshold is then rearmed.
Note
Every breach triggers a separate notification included as part of the daily summary for the severity level.
In the example, the red-shaded area represents a warning threshold. Once the threshold has been breached, a notification is included in the daily summary. The fuel level must be refilled filled past the blue-shaded area to rearm the trigger.
Samples
Thresholds only take into account the current signal value. So if more than one severity level is set for a signal, each threshold breach triggers a separate notification
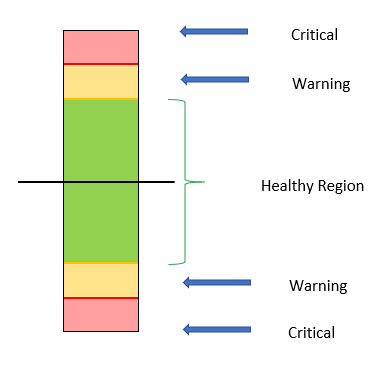
There are some rules to keep in mind regarding severity levels:
-
For successive low signal thresholds, the lowest signal value must have the highest severity level.
-
For successive high signal thresholds, the highest signal value must have the highest severity level.
-
The healthy region is determined by:
-
the signal values between the high and low thresholds
-
if all thresholds are high signal values the healthy region begins at the lowest value threshold until the maximum value for the signal
-
if all thresholds are low signal values, the healthy region begins at the highest value threshold until the minimum value for the signal
-
In the example, the critical threshold is rearmed on 10/25 yet the signal is still in the warning level range. On the following day the warning threshold is rearmed.
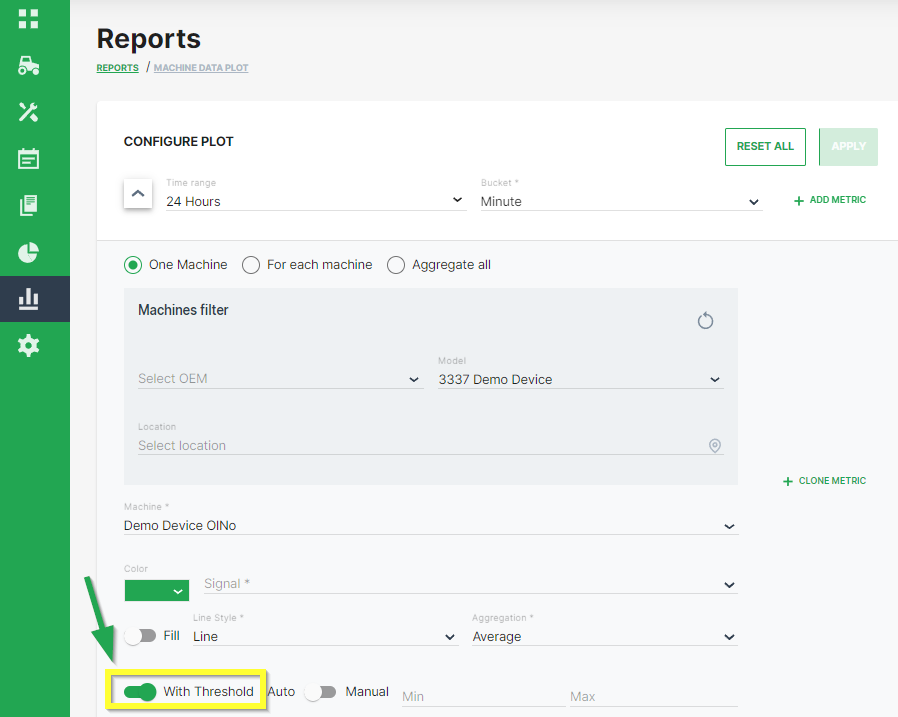
Once you have set severity levels for a signal, you can view the thresholds by setting the With Thresholds switch in the reports/plots Configure dialog to the on position (as shown)
The switch only appears for signals that have severity levels set in the Threshold Configuration.
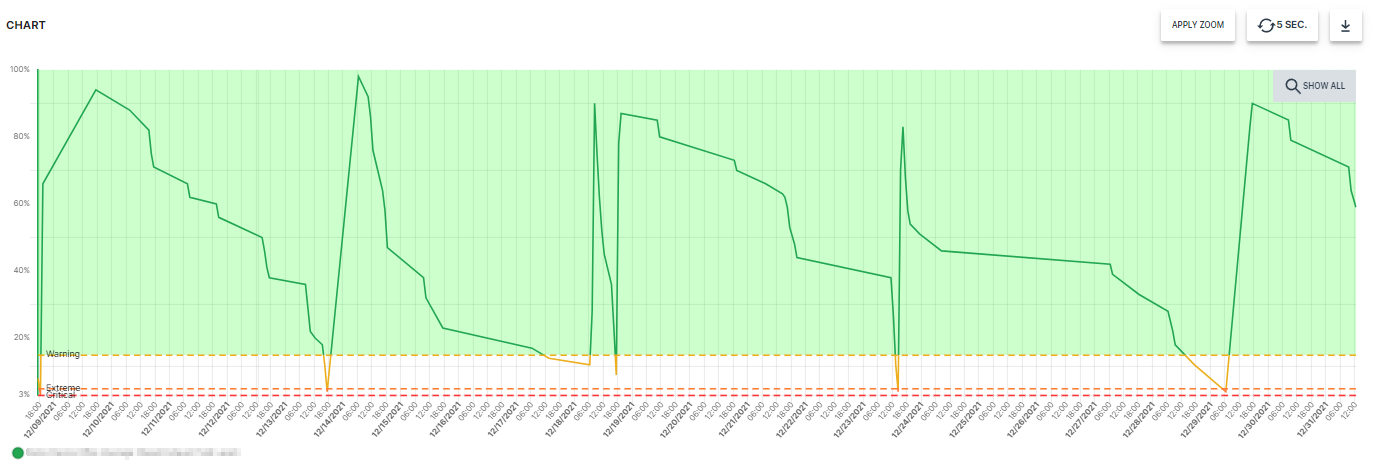
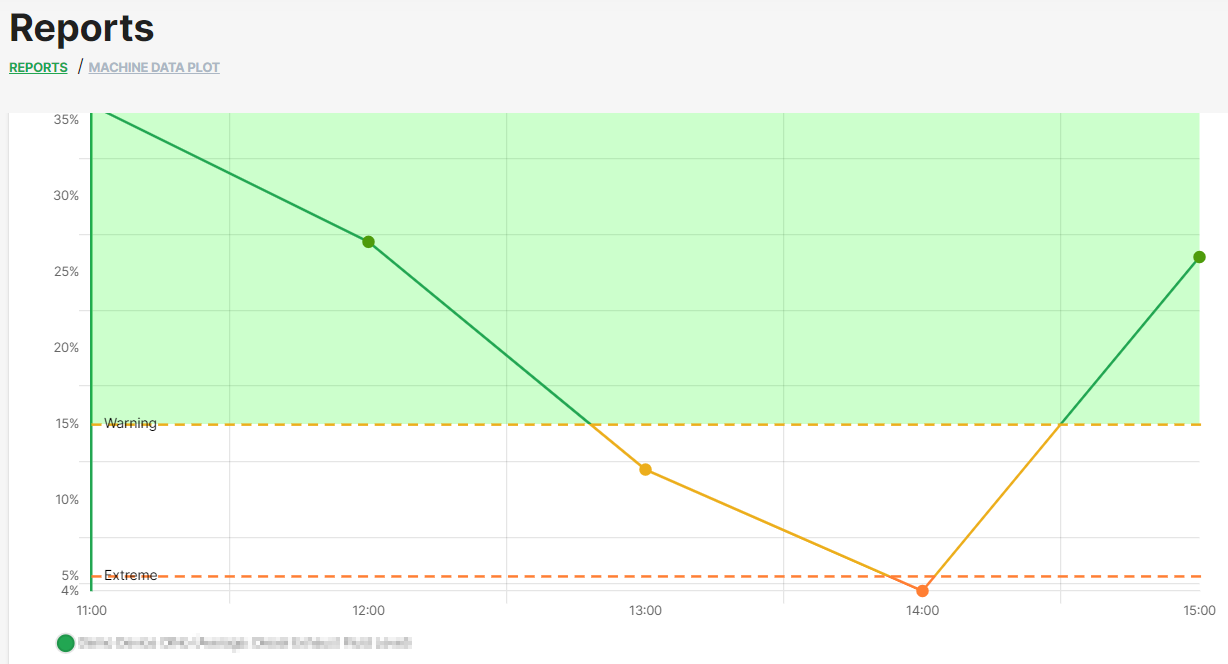
In the plot shown below, the Extreme label is triggered when the fuel level dips below 5%.
Subscribe to Thresholds Notifications
To subscribe to threshold notifications for your organization, configure your Notifications settings and choose the severity level for which you would like to receive notifications by choosing the color accordingly:
Severity Level
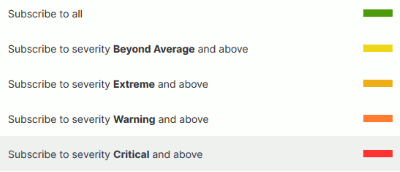
The notifications will be sent as a daily between 5 a.m. and 6 a.m.
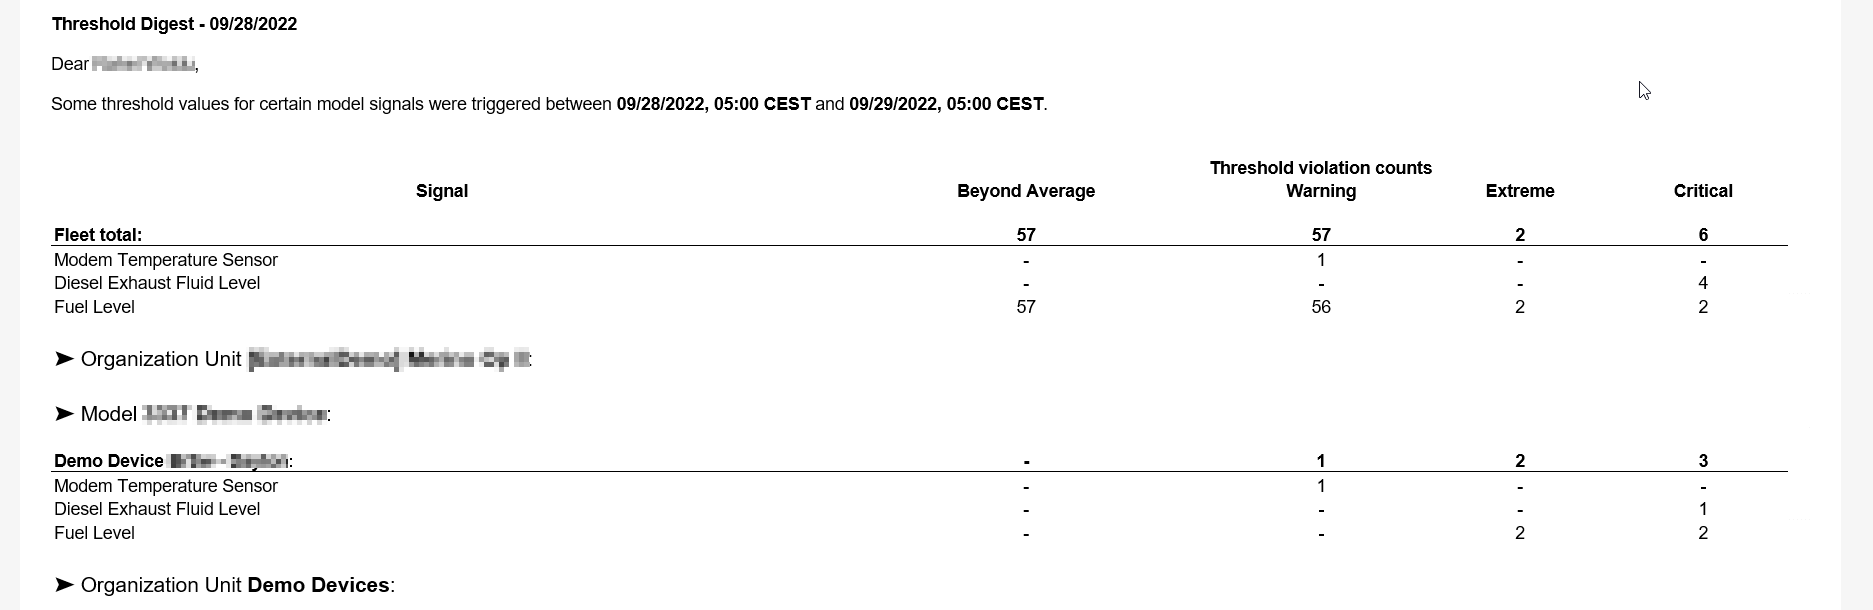
Example of a threshold notification content:
Contract End Notification
You can receive email notifications for machine contracts about:
- renewal requests - a customer of yours or any other user with interest in the machine but without enough permissions to renew a contract has expressed interest in extending the telematics contract on a machine.
(The renewal request is done in the Machine Page, i.e. via the Master Data Widget.) - already expired - see note below
- to expire soon - see note below
Timinig of Notifications
Notifications for contracts that are about to expire are generated 18 weeks before the contract end date. This behavior is intentional to give users enough time to review and renew contracts.
Note
Consider that contracts in the Active state will be renewed automatically when not cancelled within the notice period.
Contracts in the active (cancelled) state may be renewed manually until the contract end date (consider the days left for renewal) if still needed, see Contract Renewal.
If there are contracts to be expired or renewed, you will receive the email.
If there are no contracts due within the next time, no email will be sent.
Subscribe to Contract End Notifications
This feature is enabled by default for organizations of Type "Dealer" and new users.
If not enabled, you must toggle the feature "Contract End Digest" in the Feature Switch for the according organization unit(s), e.g. of Organization Type "OEM".
You must have the following permission set to both enable and receive notifications:
Contract:View.
Then, you can enable the notifications for Contract End, see Subscribe to DataPortal Notifications for receiving the Contract End Notification email.
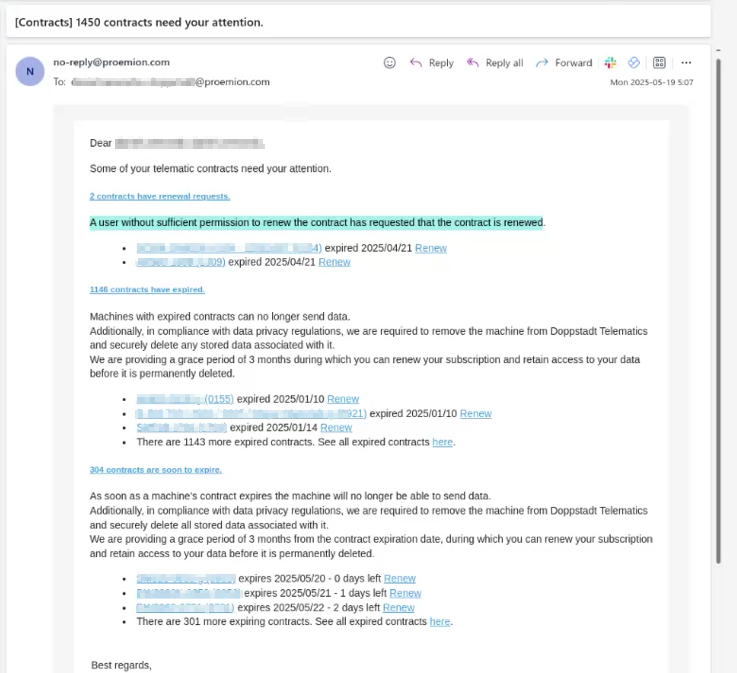
Notification Content
The Contract End Notification email containing the information described above looks as follows:
You can also unsubscribe from the Contract End Notifications.
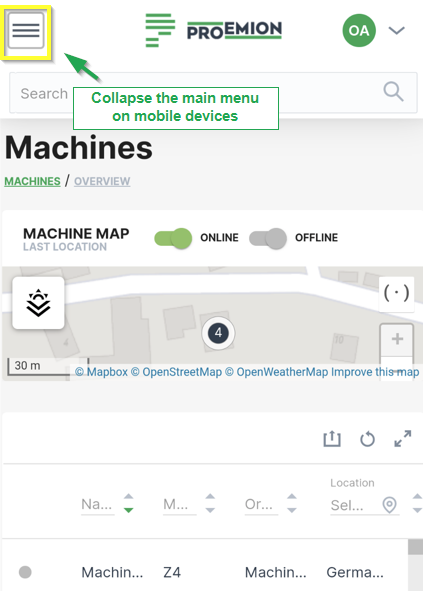
Left-side Menu
The left-side menu contains the DataPortal functionality. The item or function from the most recent session opens by default.
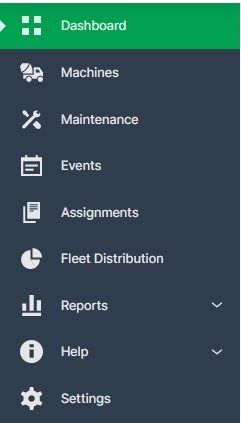
Select a topic from the list to jump to that section in the manual: - Organization Dashboard - Machines - Maintenance - Events - Assignments - Reports - Settings
Note
On tablets or mobile mode, the left-side menu is collapsed as shown in the image below:
Search
The DataPortal includes a search field that allows you to perform a single-click global search for the following objects:
-
Machines (machine name or IMEI number of CU)
-
Vehicle identification number (VIN)
-
Product Identification Number (PIN)
-
Serial number
-
Users*
-
Organizations* (a search by Organization Type is also possible)
-
Models*
Note
*Searching users, organizations and models is only possible from the Administration panel.
By entering a search term in the field, an autocomplete results window will appear as long as there is a match
Selecting an entry from the results forwards you to the Machine Page for the communication unit.
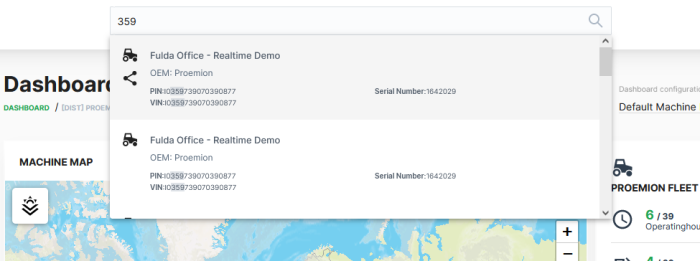
In the list of results that appears, the matches are displayed in bold.
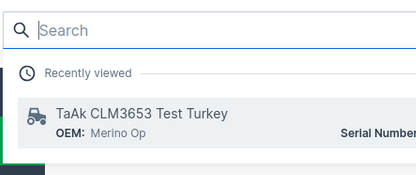
Recent Search
Opening the search field without performing a specific search shows you the three last recently viewed machines in the search results:
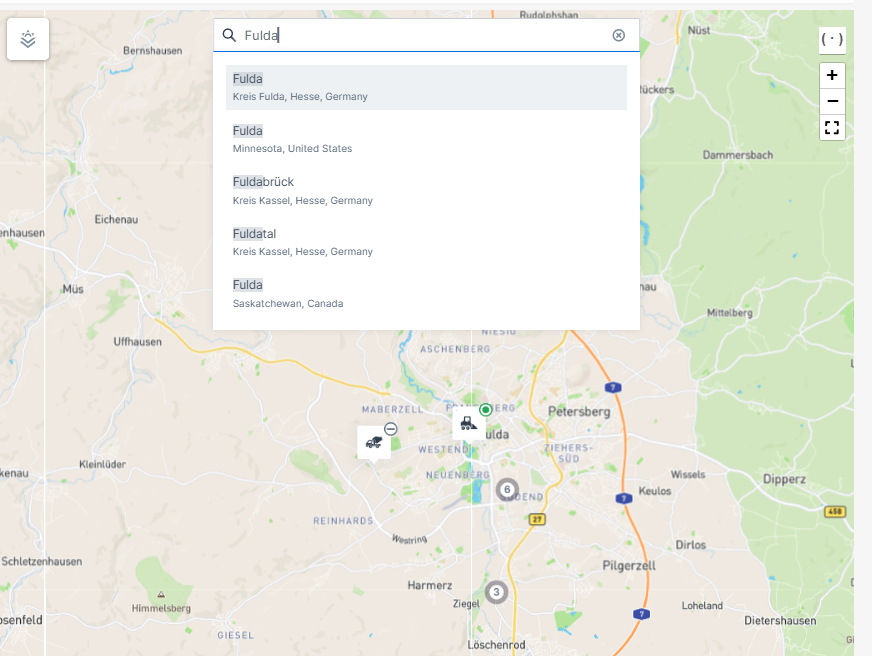
Search within Map
You have the possibility to search directly within maps.
When you type in a specific name of a location, the map will be zoomed to this location while showing the machines within this location.
Hierarchical Geo Data
The DataPortal provides hierarchical geo data for machines in your organization to use as filter criteria in reports and machines lists. Any machine that has position data also has hierarchical geo data. This functionality enables filtering all machines within a continent > country. Herewith you can categorize or aggregate reports and data by location.
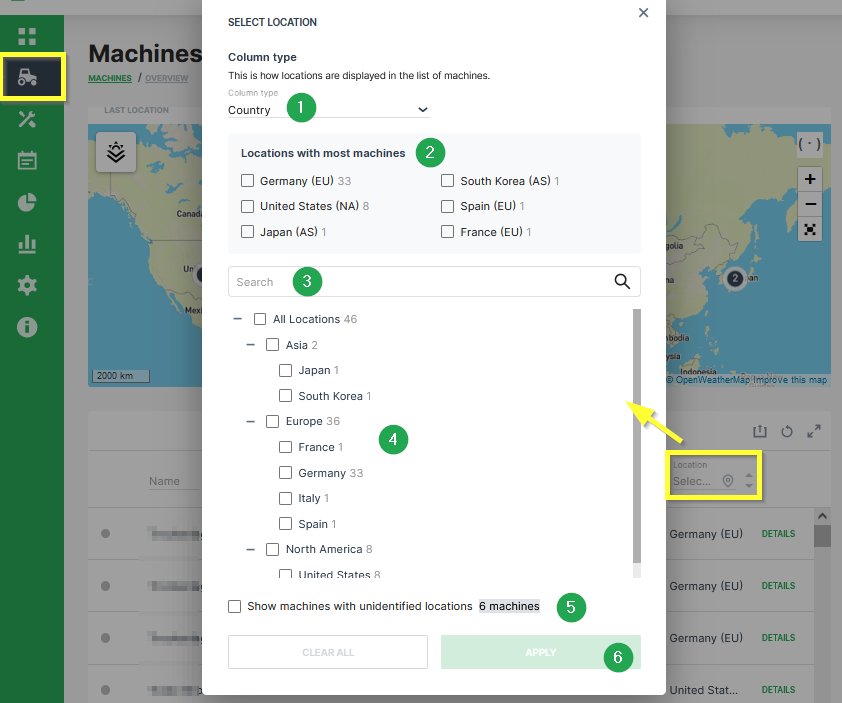
| # | Item | Description |
|---|---|---|
| 1 | Column type | User can filter machines of a specific Country or Continent. |
| 2 | Locations with most machines | List of locations with most machines is displayed here. User can enable a filter for the given countries or continents. |
| 3 | Search | Input field if a user wants to search for a specific location. |
| 4 | All Locations | Tree of all locations and the distribution of the machines is displayed here. Enable the checkbox for the required continent or country. |
| 5 | Machines with unidentified locations | Enable this checkbox to also list machines with Unknown location. |
| 6 | APPLY | Button to APPLY the location filter. If the filter settings needs to be removed, click on CLEAR ALL |
Note
Only users with the Machine: View and Latest location or Location history permission sets have access to this functionality. Location history is necessary to retrieve the data via API.
Note
The Geo Data Location Filter can only be applied to machines where the setting for the Geo permissions in the assigned PDC also allows visibility of the location for the respective organization type. If a machine has a PDC without Geo permission for the user's organization type, the Location of this machine is displayed as Unknown Location. For further information regarding the permission settings, please refer to PDC Manual - Permissions.
The table below shows the availability of the GEO Data Location Filter in the DataPortal.
| Feature/Menu Item | Module/ Column | Filter? Y/N | Navigation |
|---|---|---|---|
| Machines Overview | - | Y | Machines > Machine list > Location column |
| Maintenance | - | Y | Maintenance > Filter > Machine > Machines filter: Location |
| Events | - | Y | Events > Filter > Machine > Machines filter: Location |
| Assignments | - | Y | Assignments > Filter > Machine > Machines filter: Location |
| Reports | |||
| Maps | Y | Reports > Maps > Configure Maps > One machine > Machines filter: Location | |
| Plots | Y | Reports > Plots > Configure Plot > One machine > Machines filter: Location | |
| Scatter Plots | Y | Reports > Scatter Plot > Configure Scatter Plot > One machine > Machines filter: Location | |
| Tables | Y | Reports > Table > Configure Tables > One machine > Machines filter: Location | |
| GeoLeash | N | Reports > Filter GeoLeash Events > Select machine | |
| Machine Efficiency | Y | Reports > Efficiency Snapshot > Select machines | |
| Y | Reports > Efficiency History > Select machines | ||
| Assignments | N | Reports > Assignments > Assignment Report > Configure report | |
| Settings > Administration > Organization Structure | |||
| Machines Management | Y | List of machines | |
| Models | N | New machine model > Machines > Select machine | |
| Communication Units | N | Settings > Administration > Organization Structure > Communication Units tab | |
| Contracts | N | Settings > Administration > Contract > Contracts list |
Table Options
Tables are used to represent data in several menus and elements of the DataPortal. Within these tables you have different options to view, search or filter data:
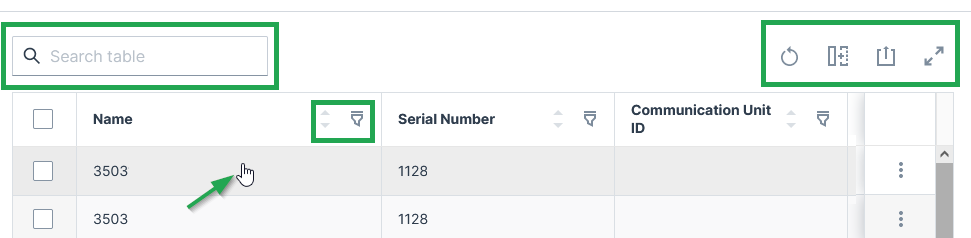
Each row is clickable and leads you to the details of the machine. You can search throughout the table or specific columns, see below.
Sort and Filter Table
-
 Reset all options to default values.
 -
 You can remove or add each column from the table.
 -
 You can sort by each column in the table by selecting the arrows above the column.
 -
 Via the 3-dots icon by the end of each row, you find further actions and options in the drop-down menu, see Machines Overview for an example of available options.
 -
 Filter and search of specific columns are available by clicking the filter icon and entering the searched text into the fields at the top of each column.
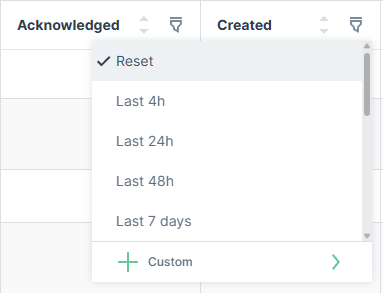
For date columns, the filter offers relative time presets (e.g. Last 4h, Last 24h, Last 48h, Last 7 days) or a Custom option to define a specific date-time range.
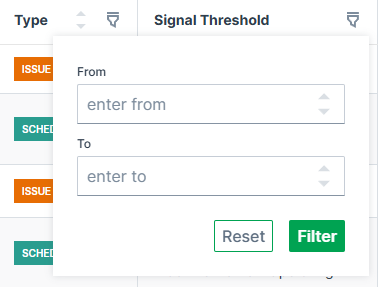
For number columns, the filter offers a numeric range with From and To input fields.
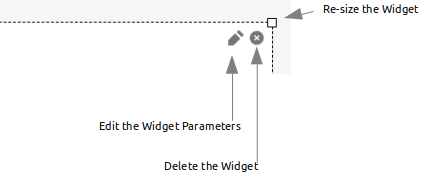
Resize Columns
Columns can be resized by dragging the handle at the right edge of the column, which shows a double-headed arrow icon with two vertical lines in the middle, see screenshot below:
![]()
Any columns resized by the user are saved locally and restored when reopening the table.
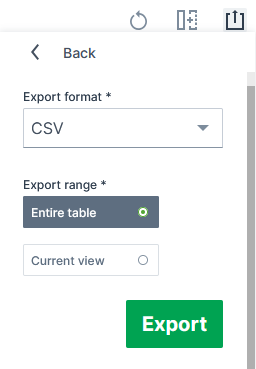
Export Table
![]() Via the export icon, tables can be exported.
Via the export icon, tables can be exported.
You can select to export all columns or only specific columns as viewed in the DataPortal:
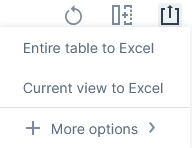
You can select to export the tables mostly as a CSV, JSON or XLSX file and PDF file:
Depending on the exported table, the column headers include the units (for the "Signal" column) and the time zone GMT+0:00 (for the "Last updated" column).
Important note on rounding
Consider that due to rounding, the displayed values in tables and charts may differ slightly from the underlying data.
Therefore, refer to the raw data displayed in the exports for exact figures of a report (instead of, for example, summing up the values displayed in a chart) as the values are displayed in full precision.
Note that in the XLSX exports, 3 decimals at maximum are displayed by default, yet the full precision raw value remains.
Dashboards
Introduction
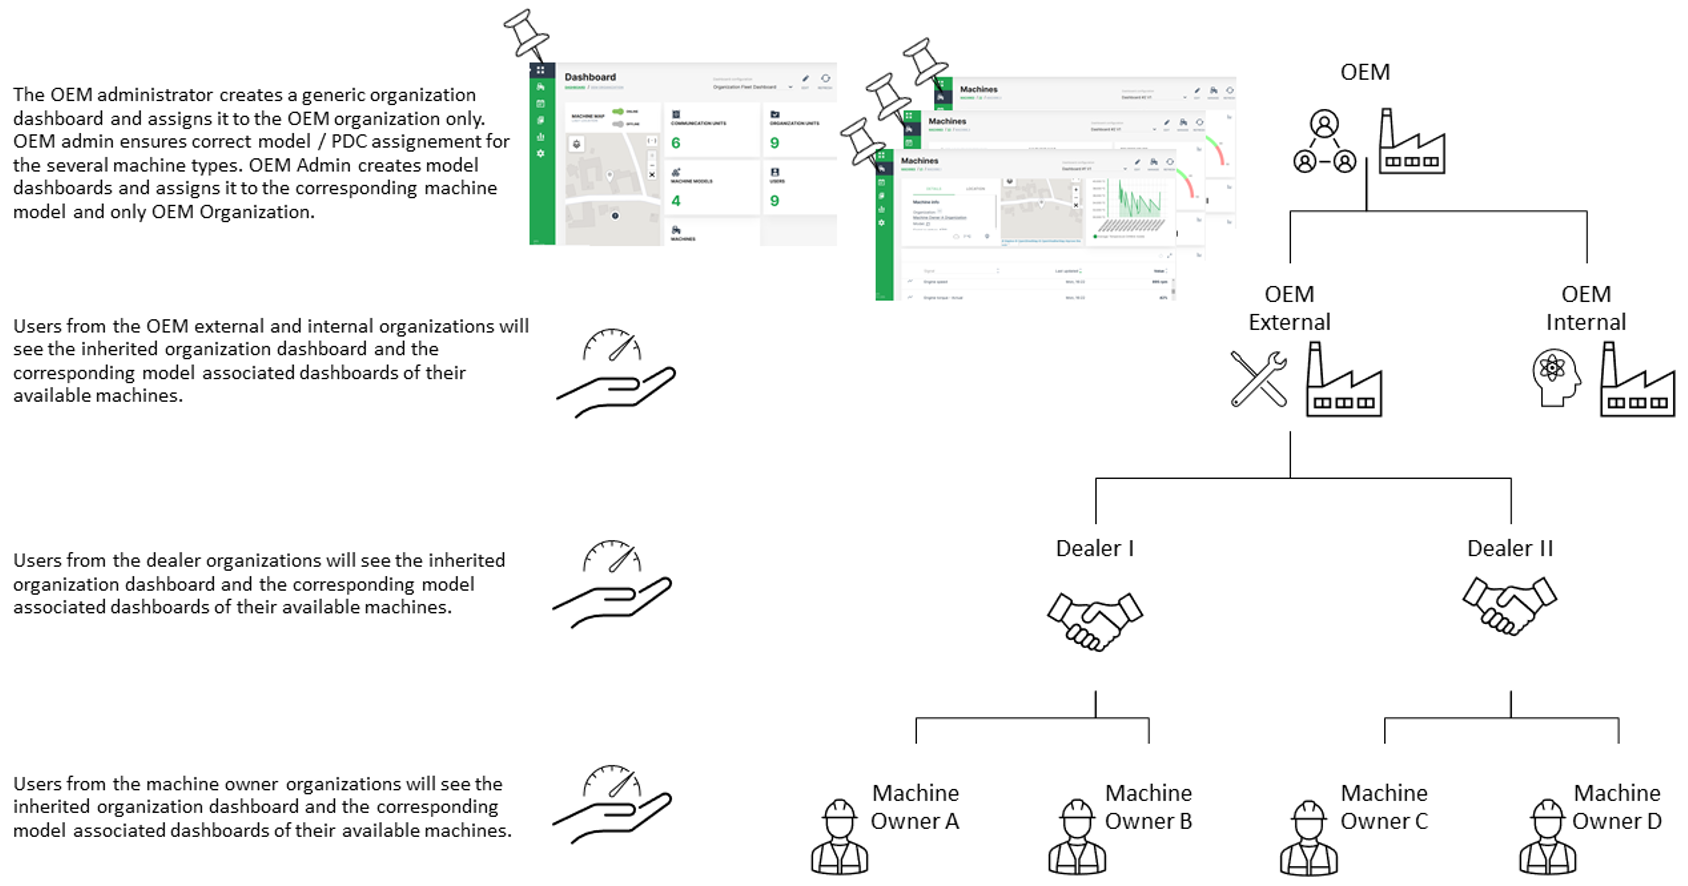
In the DataPortal there are two different types of dashboards available for customization with an individual widget layout. The organization associated dashboard provides an overview of your machine fleet and data on an organizational level. A model associated dashboard can be configured to display specific signals and states for a certain machine and its corresponding model when opening the machine page. For both types of dashboards, the same set of widgets is available for configuration of a customized widget layout.
Since there are certain rules for displaying the several dashboards, it is essential to distinguish between organization associated dashboard and model associated dashboard. The basic idea of an organization associated dashboard is to show the most relevant parameters for the entire fleet and organization. The model associated dashboard is aimed to show machine and machine model specific data. Please be aware that the organization associated dashboard is bound to an organization and a model associated dashboard is bound to the organization type.
Especially when having a rather complex organization tree and a fleet with different machine types and models, the assignment of a dashboard to the organization and model has an important role for the visibility down to the machine owner organization through the entire organization tree.
Recommendations for handling of organization associated dashboards:
-
It is highly recommended for organization associated dashboards to just assign it to the top level organization and leave the organization units below unchecked. The lower level organizations will automatically inherit the organization associated dashboard from their parent account then.
-
Since the management of multiple dashboards requires additional administration efforts at the lower level organization units, it is also recommended to keep the organization associated dashboard as generic as possible. So it can be used for all available types of accounts.
Recommendations for handling of model associated dashboards:
- Create a basic dashboard layout for one model and assign it to other models or and duplicate it for configuring different dashboards layouts.
INFORMATION
As of January 2023, model associated dashboards are assigned to the organization type, e.g. OEM or Dealer, and not the organization (unit) itself. Thereby, all organizations (and their organization units) of that organization type inherit the layout of the model associated dashboards.
Note
INFORMATION A video tutorial on how to create and assign a customized dashboard for the lower level organization units can be downloaded at the following link Dashboard Management Part 1. In case that an updated version of the dashboard needs to be pushed to the lower level organization units, please refer to Dashboard Management Part 2.
Organization Dashboard
The organization associated dashboard displays the required datasets and information for the entire organization. Depending on user permission sets, users are able to adjust the layout of this page, see Dashboard Page Layout.
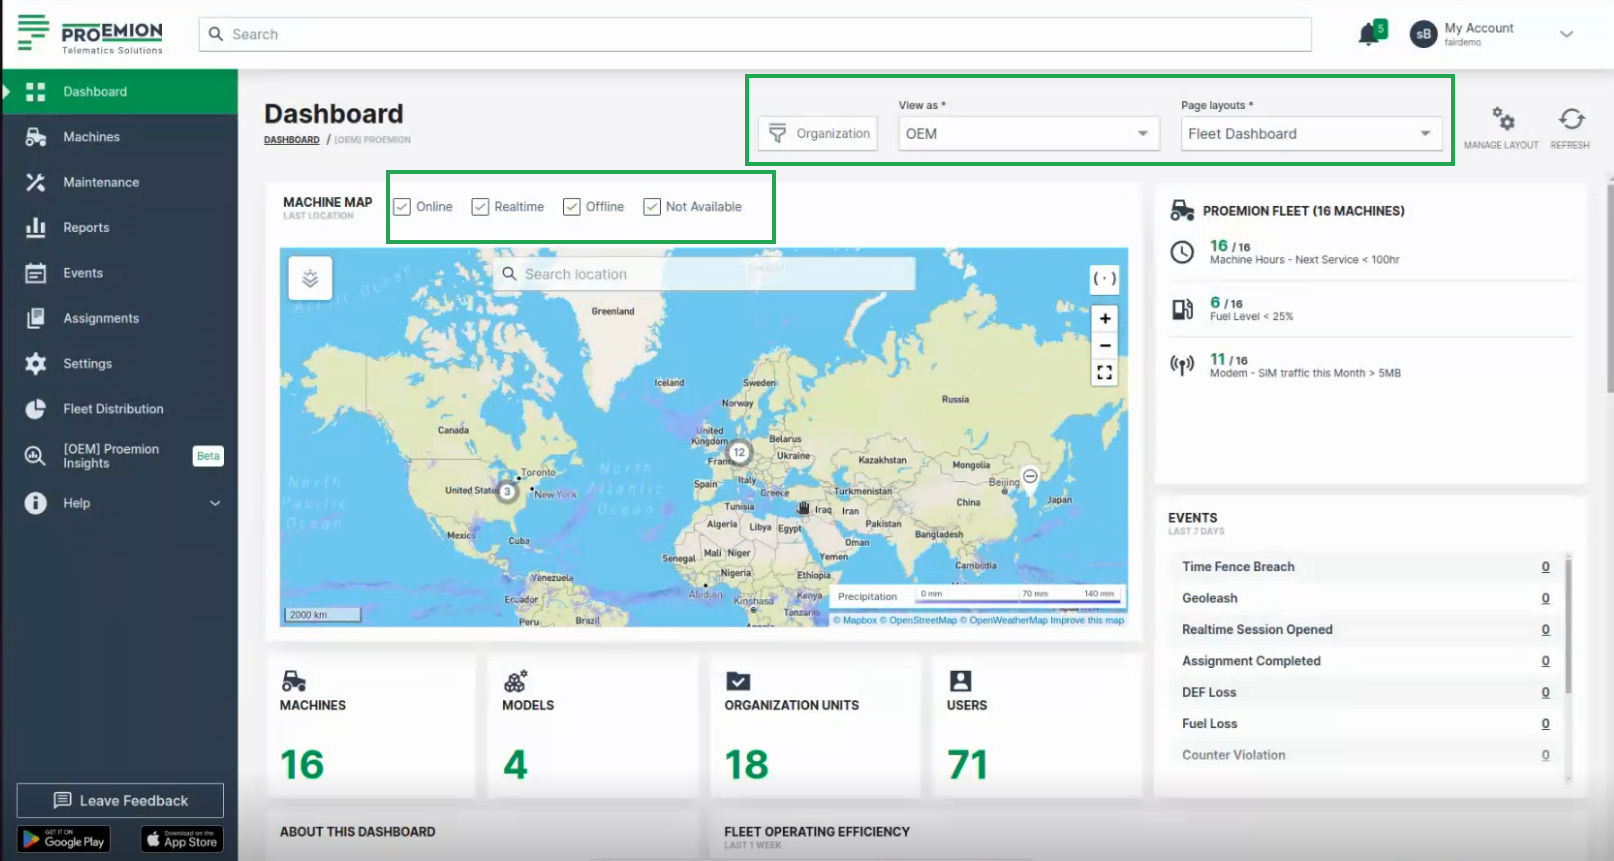
Consider to activate the filters shown above the map for displaying machines in the map that are:
- Online
- Realtime (having a Realtime session)
- Offline
- Not available (for 3rd party machines, i.e. none CANlink® mobile machines)
Organizations
An organization comprises groups of users in hierarchical org units that carry out management tasks. The highest rank in the hierarchy is the distributor level org unit that has visibility of the entire organization. The distributor creates and performs administrative functions for child org units. Generally an organization manages machine models, machines, data and objects such as reports and widgets. The primary org unit types are:
| Classification | Visibility | Description |
|---|---|---|
| Distributor | manufacturer (OEM), dealer, machine owner | Provides telematics devices, services, 1st-level support and escalation to 2nd-level support. |
| OEM | Dealer, machine owner | Machine/equipment manufacturer. |
| Dealer | Machine owner | Provides machines including customer service to end-customers. |
| Machine Owner | Operators and machines | Owner/operator of the machine in operation. |
Org unit members can view child org units but not parent or sister org units.
Org units contain users, models, machines and communication units. Users are assigned entitlements or permissions that allow them to perform functions, manage users, data and machines.
The primary roles are "Admin" and "Maintainer, see Permission levels.
The Admin is responsible for creating the structure of the organization (creating org units, models, widgets) including configuring permissions for Maintainers.
The Maintainer is responsible for managing models, widget layouts, machines and users in org units.
Filter by Organizations
As the Organization Dashboard shows data in the widgets of the entire organization tree, you can filter the dashboard by the organization units for your individual view in the DataPortal. This can be done for every dashboard configuration.
To filter the dashboards, proceed as follows:
-
In the Dashboard menu, open to the Organizations drop-down.
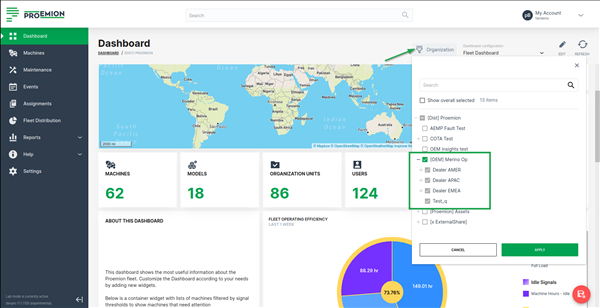
Figure 2: Organization associated Dashboard - Organizations Filter -
Select the organizations that you want to view their data in the dashboard (widgets). When selecting an organization (parent), all its children organizations are selected, too, and will be greyed out. This means that all widgets will fetch information for the selected organization together with its children.
-
As a result, the dashboard shows data only from the selected organizations. An icon will be displayed in the widgets that show the filtered data.

Note
The filter criteria are preserved when switching between dashboards during a session in the DataPortal.
Filter by View
You can filter the organization dashboard by an organization type for your individual view. That means, selecting this filter changes your view of the organization dashboard to the one of either an OEM, Dealer or Machine Owner.
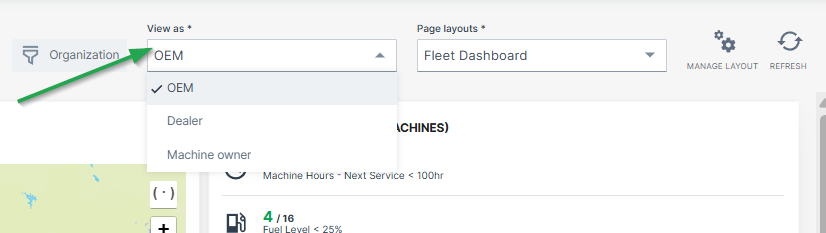
To define organization types for each organization dashboard, go to Visibility level/Binding in the Dashboard Page Layout
Filter by Page Layout
It is also possible to create and save multiple organization dashboards/layouts that display different widgets and/or time range.
In this case, the desired organization dashboard must be selected from the drop-down menu:
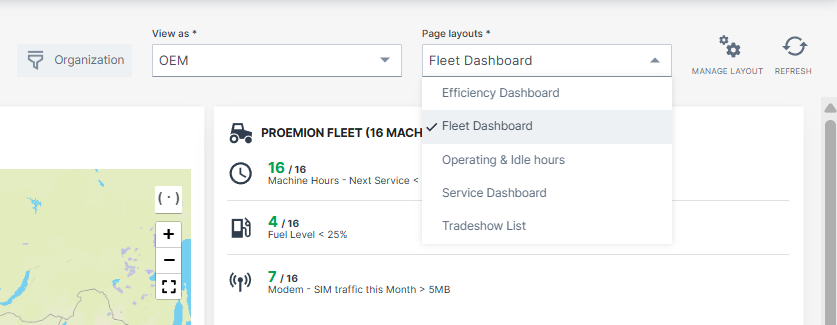
To define different layouts of organization dashboards, go to Duplicate/Create Layout in the Dashboard Page Layout
Model Dashboard
The model associated dashboard displays the required datasets and information for specific machine models and herewith for all machines which are assigned to this model. The dashboard is displayed in a dedicated Machine Page for each machine belonging to this model.
A user viewing a machine page gets a widget layout based on the template assigned to the model of the machine. Depending on user permission sets, users are able to adjust the layout of this page.
Machine Model
The model describes the type of machine as a set of attributes and is assigned to the parent org unit (typically OEM or manufacturer) within the organization. An example is a dump truck or shredder. The machine model concept places management (configure features, edit attributes, assign to a list of machines) at manufacturer (OEM) level, and visibility is restricted to the currently selected organization.
By default, the admin for a model created in the Proemion DataPortal is the user that created it.
Concept
Model represents a type of machine, and can also be understood as the class, while machine is an instance of that class.
Model Management on the DataPortal enables the following:
-
Grouping machine types (such as small, medium or large), or machine model series (e.g. Shredder 7 series, Dump Truck XR series)
-
Entry point for feature enabling and configuration for a type or series
-
Handling identical machines in a uniform manner
-
Base widget layouts on the model and organizational unit
-
Add links to documentation and brochures in multiple languages. Links added here will be visible in the widget layout of all machines of this model.
A common application in the DataPortal is the execution of data operations/ comparisons and calculations for one or more machine types.
Manage Dashboards
In some cases it might be necessary to add new widgets and functions to an existing dashboard. Changes affect all organizations that may use the layout of the dashboard for the Machine Page based on their organization type.
In the Machine Page Layout configuration for Model Dashboards and in the Dashboard Page Layout for Organization Dashboard, an admin may change the visibility, thus the availability of the dashboard layout for organizations based on their organization type.
By removing the layout binding from the model or even deleting the layout completely, the dashboard is removed from all Machine Pages assigned to this model.
Furthermore, the admin may use one layout for multiple models.
Note
Consider that changing this layout affects all models, resp. the dashboard for all organizations.
Widgets
Introduction
A Widget is a configurable indicator that enables you to access and display machine data on the dashboard. In the DataPortal widgets can be added to the dashboard at Organization level and on the model level, i.e. Machine Page.
Add Widgets to the Organization Dashboard
Note
The Dashboard:Admin permission set is needed to Manage Dashboards.
The Organization Dashboard contains an overview of your fleet. Widgets that are visible here are linked to the entire fleet.
Note
The Model Dashboard contains the details for a specific machine assigned to a model displayed within each Machine Page
Widgets for the Machine Page can be configured in the Machine Page Layout.
The following section describes how to add widgets to the Organization Dashboard
Furthermore, read how to arrange the position of widgets in Machine Page Layout.
-
In the upper right corner of the dashboard, select Edit
 to open the dashboard configuration menu.
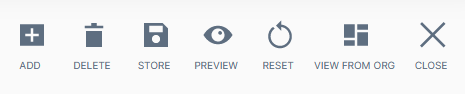
Figure 1: Dashboard edit options Item Description Add Open a widget from the list on the left. Delete WARNING: This will remove the entire dashboard of the organization as well as ALL sub-organizations, that inherit this dashboard. Store Save Dashboard Preview Display your dashboard layout before saving. Reset Restore the default dashboard and widget layout. View From Org View the dashboard for the sub-organization perspective. Note
Note that there is also the Tab Container for organizing the widgets in groups.
-
Select ADD in the Edit options
A dialog opens with all available widgets.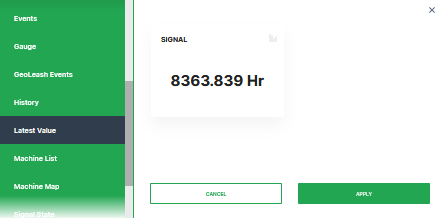
Figure 2: List of Widgets -
Select the desired widget on the left-side panel to open the configuration settings.
-
Preview your widget.
-
Click Apply. This forwards you to the widget configuration dialog
Read also Add Widget in the Machine Page Layout on how to move or resize widgets. -
Once you have completed configuring the widget, save your settings.
Save Dashboard
There are two options to update the dashboard.
-
The first option is to update the existing dashboard and Save it directly. This will keep your structure simple and straight forward, but you have to be aware that all users will directly see the effect.
-
It is also possible to create an updated copy of an already existing dashboard
Therefore, select Edit > modify the dashboard according to your needs and click on Store > Save As to save a new version of the dashboard for your own and your subsequent organization units.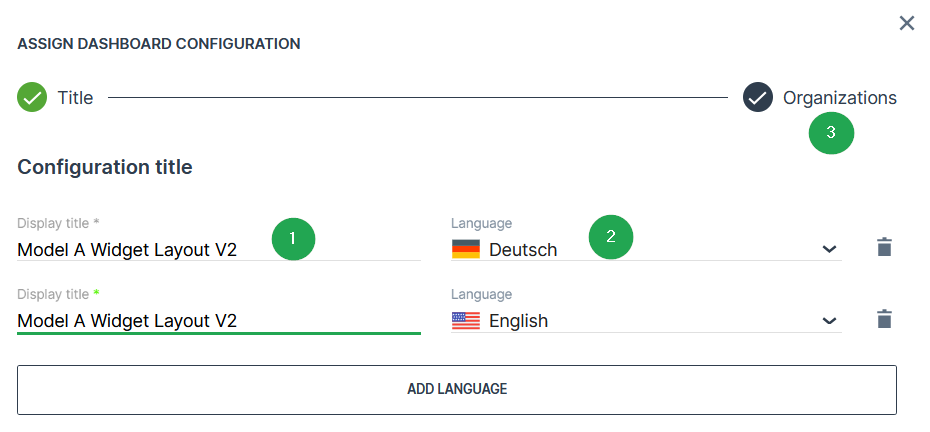
Figure 3: Dashboard Title # Item Description 1 Display Name of the dashboard configuration in the drop-down list. 2 Language Select the language for the dashboard name. To add a language, click the ADD LANGUAGE button. 3 Organizations Select the Organizations assignment panel.
Delete Saved Dashboard
-
Open Edit and select View From Org
 icon.
icon. -
Select the organization where you want to remove the dashboard in the panel.
-
Click Close from the Edit Options menu.
-
Select the Dashboard you want to delete from the Dashboard Configuration drop-down menu.
-
Open Edit Options again.
-
Click the Delete icon
 to remove the dashboard.
Common Parameters
Note
Note that due to rounding, the displayed values in tables and charts may differ slightly from the underlying data. Therefore, refer to the raw data for exact figures of a report. For exporting data, refer to Table Options.
When configuring a widget on the Organization Dashboard you must first select the Standard Parameters Model and Machine. You can specify the accuracy for decimal place values; the default option is a single decimal place:
Options to drag, reposition, and resize are available in edit mode:
Time selection
You can change the time range for the data displayed in the widgets on the DataPortal. You can specify a relative time range between now and up to the previous 2 years.
Select from either predefined time ranges, e.g. Last 24 hours or Previous month:
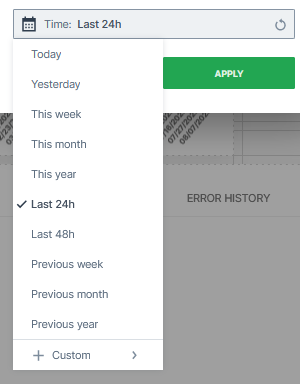
Or select a custom time range, e.g. This last (Type), 5 (Amount), Days (Unit):
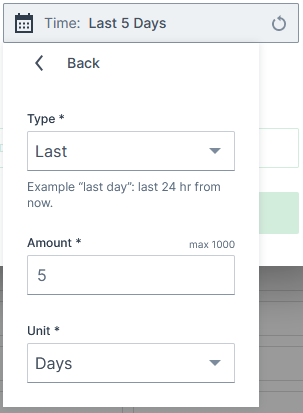
In the Type field you can choose between Last, This Last and Previous. For the following examples, let's assume it's Wednesday, 10th of August, 16:30 hours and you would like to view information of the past 7 days and additionally 7 hours from now.
-
Last: calculates backwards from the current time. Examples:
-
Last 7 Days would show the values in the time range Wednesday, 03.08. 16:30 until Wednesday, 10.08. 16:30.
-
Last 7 Hours would show the values from Wednesday, 04.08. 09:30 until 16:30.
-
-
This Last: calculates from the last full unit for the start of the time range. Examples:
-
This Last 7 Days would show the values in the time range Thursday, 04.08. 00:00 until Wednesday, 10.08. 16:30.
-
This Last 7 Hours would show the values from Wednesday, 04.08. 10:00 until 16:30.
-
-
Previous: calculates from the previous unit. Examples:
-
Previous 7 Days would show the values in the time range Thursday, 03.08. 00:00 until Tuesday, 09.08. 00:00.
-
Previous 7 Hours would show the values from Wednesday, 04.08. 09:00 until 16:00.
-
-
In comparison, when selecting Previous week (predefined time range), it would show the previous calendar week, i.e. Monday 01.08. 00:00 until Sunday 07.08. 00:00.
The above described time range selection options are available for the following widgets:
Signal Labels
Signal labels allow you to display to end-users the meaning of a numeric signal value. Signals that represent error codes or numeric machine states can be presented as text, i.e. labels defined as substitutions for a certain ranges in a signal. The list below presents an example of engine states in text form:
| Default Engine State | Example Engine State as Text |
|---|---|
| 0 | OFF |
| 1 | Ignition ON |
| 2 | Engine Running - Idle |
| 3 | Engine Running - Work |
| 4 | Engine Running - Power |
| 5 | Error |
| You can disable signal labels when configuring a widget by toggling the Use state signal labels instead of values switch in the widget dialog: |

When enabled, hovering over the label shows the signal value:
The text display is available for the following widgets (and reports):
-
Signal State widget
-
Comparison widget
-
Machine List widget
-
Machine Table report
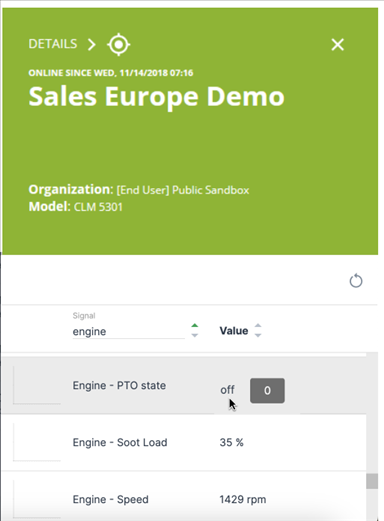
The label/text display is always activated in the Signal Overview Panel:
Note
Signal labels are configured in the PDC and not from the DataPortal directly.
Widgets Catalog
Capacity
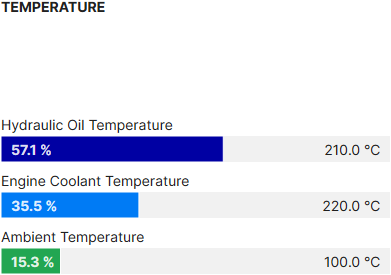
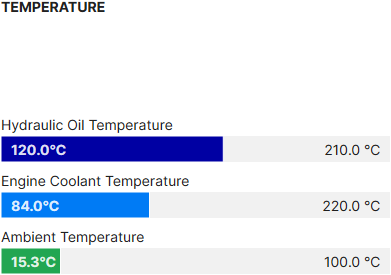
The Capacity widget allows you to select and display a value for an individual signal and total remaining capacity. The signal can be displayed as either an absolute value (e.g. 0oC - 220oC) or as a percentage (e.g. 0-100%).
Note
The capacity widget can only display positive values.
Configuration
Configure the widget and put it on the Organization Dashboard and/or the Model Dashboard by following the steps below:
It is highly recommended to adapt a Machine Page (Model Dashboard) centrally via the Machine Page Layout. If you need to configure the Machine Page for the selected machine only, proceed as follows:
-
In the selected Machine Page, select Manage Layout > Add widgets.
-
Select the desired widget. A preview will be shown.
-
Click Apply. This forwards you to the widget configuration dialog with the options described below.
If you need to adapt the Organization Dashboard, select the desired dashboard configuration and click Edit > Add to open the widgets catalog, see also Add Widgets to the Organization Dashboard.
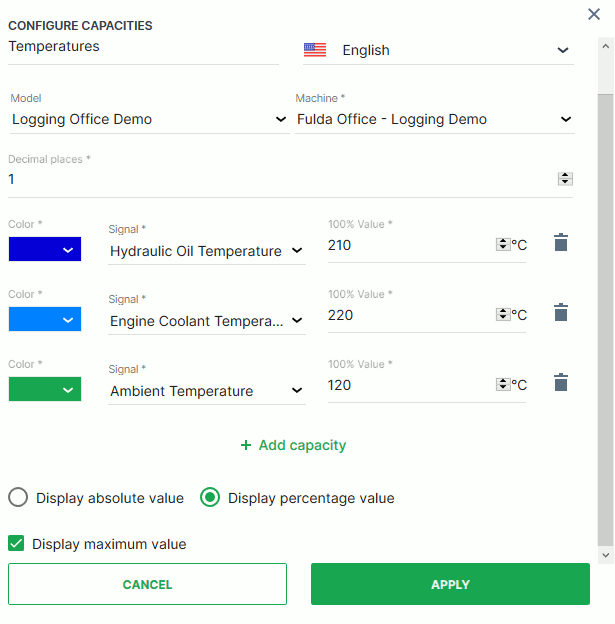
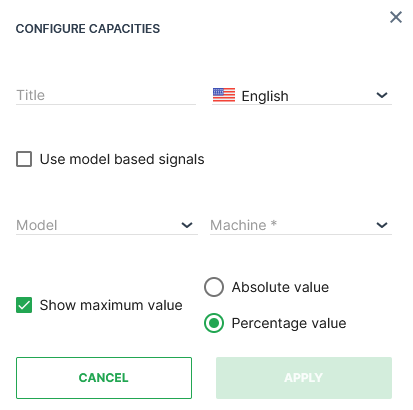
| Item | Description |
|---|---|
| Title | The label for the widget (English is the default, additional languages must be configured. See Language below). |
| Language | Select the language for the title of the widget. |
| Model | The model of the machine you select to display the capacity (see Info). |
| Machine | The machine that you select to display the capacity (see Info). |
| Decimal Places | Select the number of decimal places for the value. |
| Color | Select the color for the indicator. |
| Signal | Select the signal to be displayed. |
| 100% Value | The maximum value or usage capacity of the signal. |
| Add Capacity | Configure an additional signal to measure its capacity. |
| Display absolute/percentage value | Toggle between absolute value in units or value as a percentage on a scale from 0 to 100%. |
| Display maximum value | Display the maximum value of the signal range. |
Note
Model and Machine configuration options can only be selected from the DataPortal dashboard.
Sample
Suggested usage of the Capacity widget: For temperatures, tank levels, battery charge levels.
Cluster Heat Map
The Cluster Heat Map widget shows the variation of specific signals within a time period. Different Aggregation functions of the signal are available for representation and can be grouped in either hours or days.
Configuration
Configure the widget and put it on the Organization Dashboard and/or the Model Dashboard by following the steps below:
It is highly recommended to adapt a Machine Page (Model Dashboard) centrally via the Machine Page Layout. If you need to configure the Machine Page for the selected machine only, proceed as follows:
-
In the selected Machine Page, select Manage Layout > Add widgets.
-
Select the desired widget. A preview will be shown.
-
Click Apply. This forwards you to the widget configuration dialog with the options described below.
If you need to adapt the Organization Dashboard, select the desired dashboard configuration and click Edit > Add to open the widgets catalog, see also Add Widgets to the Organization Dashboard.
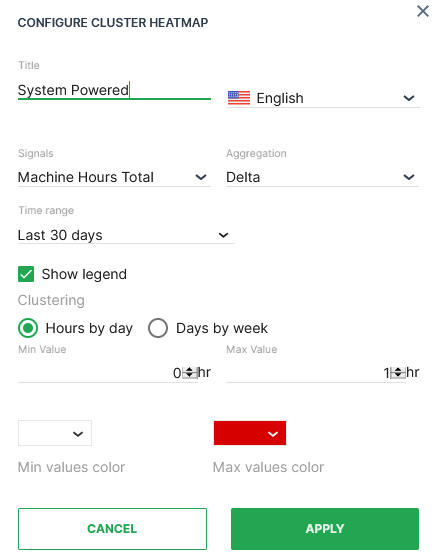
| Item | Description |
|---|---|
| Title | The label for the widget (English is the default, additional languages must be configured. See Language below). |
| Language | Select the language for the title of the widget. |
| Model* | Model name (see Note). |
| Machine* | Machine name (see Note). |
| Signal | Select the signal to be displayed. |
| Aggregation | The value returned for the signal, calculated using all the measurements within each Bucket. |
| Time | Select a predefined, relative time range, e.g. Last 24 hours or select a custom one, e.g. This last 5 Days, see Time selection. |
| Show Legend | Toggle the display of the tooltip (on hover) and the key underneath the map. |
| Clustering | How to group the values to apply Aggregation. |
| Min Value | Where the counter will start. |
| Max value | Peak value where the limits of signal capacity or usage are reached. |
| Colour Theme (Min/Max) | Select the color graduation to indicate the change in signal value. |
Note
*These config options can only be selected from the Organization Dashboard.
Sample
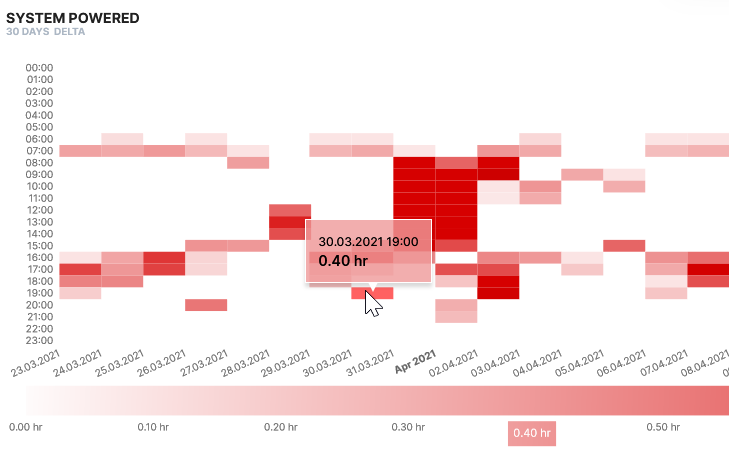
The sample above shows the average temperature variation from -10 degrees to 40 degrees over a period of 180 days measured each day of the week. Hover over a heatmap segment to display the timestamp/signal value on the heatmap and the signal value beneath the table.
Comment
The Comment widget is useful for general information or comments that apply to all or a majority of DataPortal users.
Configuration
Configure the widget and put it on the Organization Dashboard and/or the Model Dashboard by following the steps below:
It is highly recommended to adapt a Machine Page (Model Dashboard) centrally via the Machine Page Layout. If you need to configure the Machine Page for the selected machine only, proceed as follows:
-
In the selected Machine Page, select Manage Layout > Add widgets.
-
Select the desired widget. A preview will be shown.
-
Click Apply. This forwards you to the widget configuration dialog with the options described below.
If you need to adapt the Organization Dashboard, select the desired dashboard configuration and click Edit > Add to open the widgets catalog, see also Add Widgets to the Organization Dashboard.

| Item | Description |
|---|---|
| Title | The label of the comment box. |
| Language | Select the language for the title of the widget. |
| Text Box | Free text to appear in on the widget. |
Suggested Usage: For free text and lists.
Comparison
The Comparison widget allows you to compare values within a time period and display the increase or decrease (value and percentage) in comparison to the actual value.
Configuration
Configure the widget and put it on the Organization Dashboard and/or the Model Dashboard by following the steps below:
It is highly recommended to adapt a Machine Page (Model Dashboard) centrally via the Machine Page Layout. If you need to configure the Machine Page for the selected machine only, proceed as follows:
-
In the selected Machine Page, select Manage Layout > Add widgets.
-
Select the desired widget. A preview will be shown.
-
Click Apply. This forwards you to the widget configuration dialog with the options described below.
If you need to adapt the Organization Dashboard, select the desired dashboard configuration and click Edit > Add to open the widgets catalog, see also Add Widgets to the Organization Dashboard.
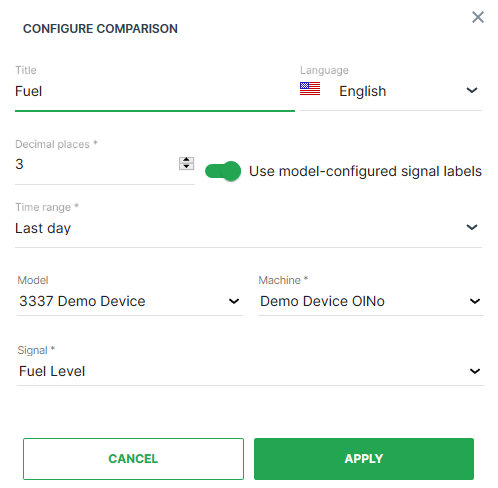
| Item | Description |
|---|---|
| Title | The label for the widget (English is the default, additional languages must be configured. See Language below). |
| Language | Select the language for the title of the widget. |
| Decimal Places | Select the number of decimal places for the value. |
| Use model-configured signal labels | Use signal labels in place of signal numeric values. |
| Time | Select a predefined, relative time range, e.g. Last 24 hours or select a custom one, e.g. This last 5 Days, see Time selection. Consider how the widget calculates the comparison[^1]. |
| Model | Select the model of the machine. |
| Machine | Select the machine for the comparison. |
| Signal | Select the signal to be compared. |
[^1] Calculation of the comparison
The Comparison widget checks if there was an increase or decrease using the "signal's latest datapoint within the selected time range" and subtracting the "latest datapoint before the time range" from it. Consider that the widget doesn't use aggregated values.
Machine-operating-hours example:
-
Selected time range: 15th of May until 31st of May.
-
Measured value on the 31st of May: 21.8 hours.
-
Measured value on the 14th of May: 10 hours.
-
Comparison widget calculates as follows:
21.8 - 10 = 10.8 hours
No-data example: When choosing "Last month", but the machine has sent data only for the past 3 weeks, the widget won't do a comparison.
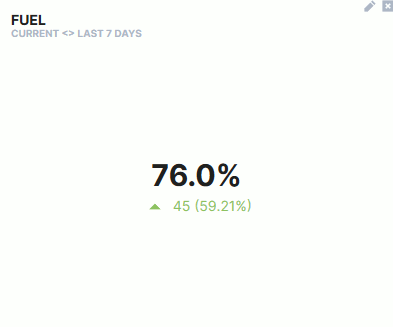
Sample
Suggested Usage: Applicable to all signals.
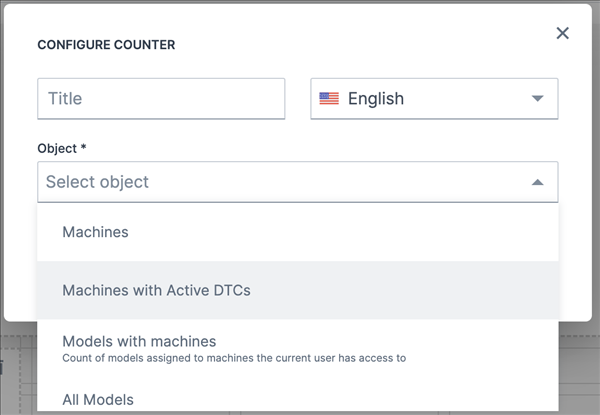
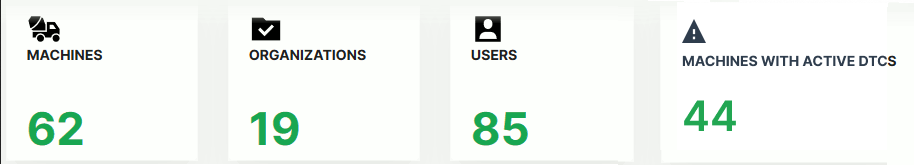
Counter
The Counter widget allows you to display the current count of objects in the organization. Additionally, you can display a subset of machines by filtering signal values.
Note
This widget can only be selected from Organization Dashboard.
Configuration
Configure the widget and put it on the Organization Dashboard by following the steps below:
It is highly recommended to adapt a Machine Page (Model Dashboard) centrally via the Machine Page Layout. If you need to configure the Machine Page for the selected machine only, proceed as follows:
-
In the selected Machine Page, select Manage Layout > Add widgets.
-
Select the desired widget. A preview will be shown.
-
Click Apply. This forwards you to the widget configuration dialog with the options described below.
If you need to adapt the Organization Dashboard, select the desired dashboard configuration and click Edit > Add to open the widgets catalog, see also Add Widgets to the Organization Dashboard.
| Item | Description |
|---|---|
| Title | The label for the widget (English is the default, additional languages must be configured. See Language below). |
| Language | Select the language for the title of the widget. |
| Object | Select from: |
| - Machines - Shows the number of all machines visible to the user. | |
| - Machines with Active DTCs - Shows the number of machines with active DTCs.. For information on the DTCs, see DTC Notification. | |
| - Models with machines - Shows the number of models with machines in the user's fleet. Example: If there are 2 models but only one has machines, then the count of models will be 1 instead of 2. | |
| - All Models - Shows the number of all models visible to the user, no matter any other criteria. | |
| - Distributed Models - Shows the number of active models distributed to machine owners. That means, counting only the models that are publicly available and doesn't count models with machines in the OEM space that are for internal use only. | |
| - Communication Units - Shows the number of all CUs visible to the user. | |
| - Organization Units - Shows the number of all OUs visible to the user. | |
| - Users - Shows the number of all users visible to the user. |
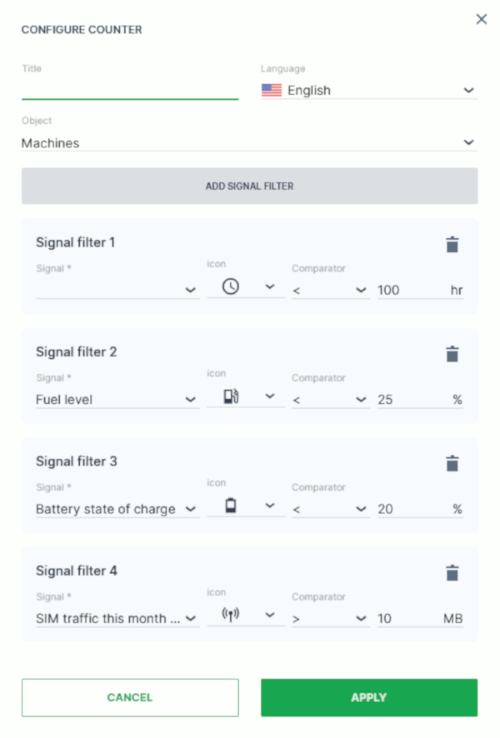
Filter by Signal Value
You can filter a subset of machines by signal value comparison. For example, configuring a counter for machines + 'Fuel level < 25%' would show the number of machines in your organization with less than 25% fuel level on the organization dashboard.
Configure a machine counter filtered by machines with the following procedure:
-
Follow the steps above to add the counter widget.
-
Select Machines from the Object drop-down list.
-
Select Add Signal Filter.
-
Select the Signal you want use to filter the number of machines shown on the widget.
-
Select the icon you want to use to represent the signal.
-
Select the Comparator you want to use to filter the machines.
-
Select the signal Value you want to use to make a comparison.
-
Select Apply to save your configuration.
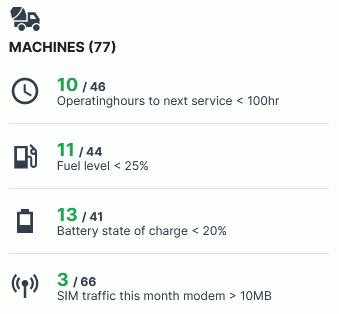
After saving, the Counter widget will show the signals as follows:
DTC
The DTCs widget allows the user to see if there are any Diagnostic Trouble Codes (DTC) codes transmitted within a specified time period.
Configuration
Configure the widget and put it on the Organization Dashboard and/or the Model Dashboard by following the steps below:
c
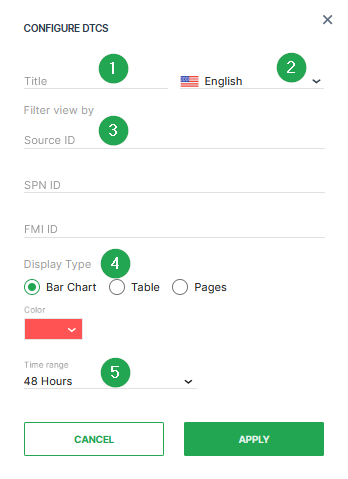
| # | Item | Description |
|---|---|---|
| 1 | Title | The label for the widget (English is the default, additional languages must be configured. See Language below). |
| 2 | Language | Select the language for the title of the widget. |
| 3 | Filter view by | This option allows to set a filter for the Source ID, SPN ID or FMI ID. By default, all filters are open. |
| 4 | Representation | Select the Display Type (Bar Chart, Table or Pages) and the Color. |
| 5 | Time | Select a predefined, relative time range, e.g. Last 24 hours or select a custom one, e.g. This last 5 Days, see Time selection. |
Note
The DTC entries in the widget are sorted according to SPN.
Once you have completed configuring the DTC widget, select Apply to save your settings.
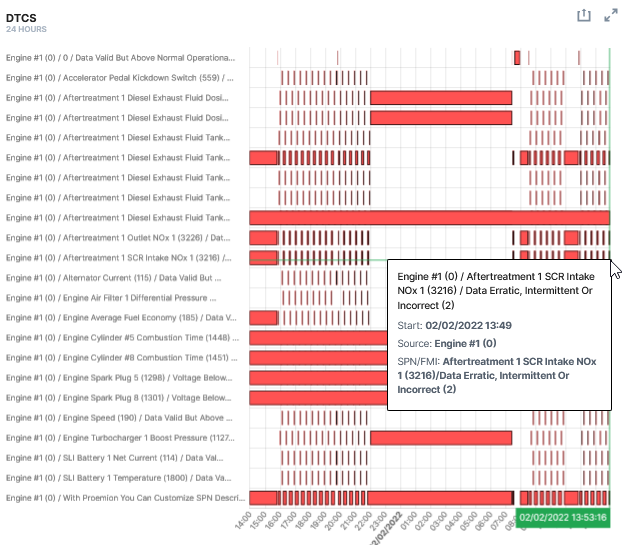
Sample
You can view the chart in fullscreen mode by selecting the icon in the upper right-hand corner of the widget.
Suggested Usage: Detect any fault or recurring issues on the Machines or component.
Efficiency
The Efficiency Snapshot and Efficiency History widgets enable machine owners to calculate and track efficiency for individual machines or for your fleet. The functionality enables the following:
-
Compare efficiency for individual machines or an entire fleet
-
View efficiency for an individual machine or an aggregated set of machines (i.e. organization)
-
Visualize the data as a chart, graph or table.
Note
To configure the efficiency widget you must first create an Efficiency Definition.
Configuration
Once you have configured the efficiency definition, Configure the widget and put it on the Organization Dashboard and/or the Model Dashboard by following the steps below:
It is highly recommended to adapt a Machine Page (Model Dashboard) centrally via the Machine Page Layout. If you need to configure the Machine Page for the selected machine only, proceed as follows:
-
In the selected Machine Page, select Manage Layout > Add widgets.
-
Select the desired widget. A preview will be shown.
-
Click Apply. This forwards you to the widget configuration dialog with the options described below.
If you need to adapt the Organization Dashboard, select the desired dashboard configuration and click Edit > Add to open the widgets catalog, see also Add Widgets to the Organization Dashboard.

| Item | Description |
|---|---|
| Title | The title for the widget (English is the default, additional languages must be configured. See Language below). |
| Language | Select the language for configuring the title of the widget. |
| Time | Select a predefined, relative time range, e.g. Last 24 hours or select a custom one, e.g. This last 5 Days, see Time selection. |
| Sort | Choose between sorting by efficiency or by name, ascending or descending. |
| Efficiency Definition | The signals that are applied to the efficiency calculation and the purpose of the definition. |
| Bucket* | Choose the time intervals between data points in the report from minute, hour, day. |
| Display Form | Visualize the data as either a bar graph or a table. |
| Type * | Choose between Collection (efficiency for each selected machine) or Aggregation (cumulative efficiency data of selected machines). |
* Bucket is only available if Efficiency History is selected.
* Type is only available if Efficiency Snapshot is selected.
Select the options for the calculation in the Configure Efficiency Snapshot dialog
Click Select Machines to filter and select the machines that will be listed in the widget.
You can select the machines by the following options:
By Model*:
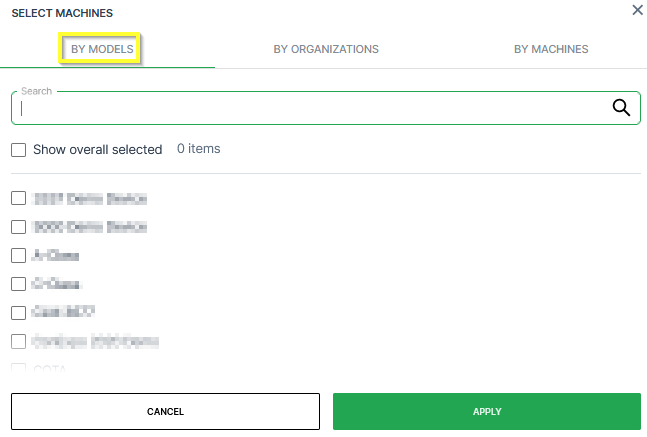
In the By Models tab, you can select the machines belonging to certain models:
-
Search: Search a specific model.
-
Models list: Select the models individually in the list of models.
-
Show overall selected: Display which models have been selected already.
By Organization:
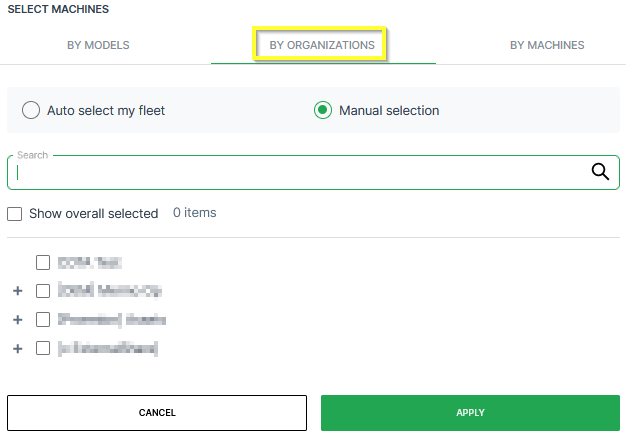
In the By Organizations tab, you can select the machines belonging to certain organization units:
-
Auto-select my fleet: Select all the organization units together with the sub-organizations that your user has access to.
-
Manual selection: Select individual organization units in the list of organizations. When selecting the top-level, all sub-organizations will be selected.
-
Search: Search a specific organization.
-
Show overall selected: Display which organizations have been selected already.
By Machine:
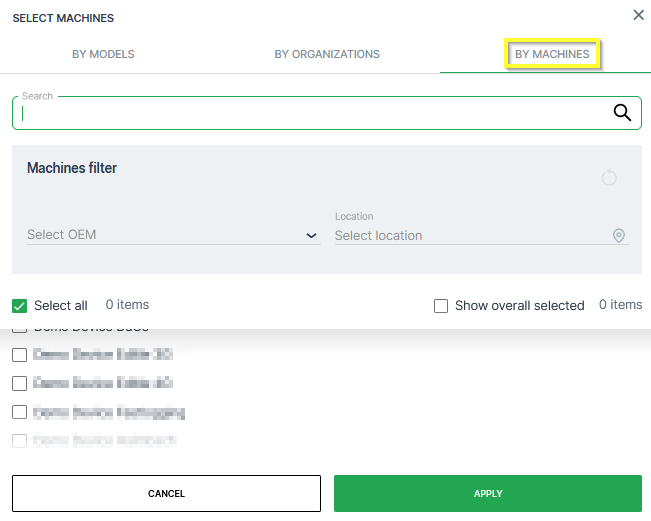
In the By Models tab, you can select the machines individually:
-
Search: Search a specific machine.
-
Machines filter: Filter the list of machines by OEM or Location.
-
Select all: Select all available machines that your user has access to.
-
Show overall selected: Display which machines have been selected already.
-
List of Machine: Select specific machines.
Once you have selected the machines for the calculations, click Apply to see the efficiency calculated on the dashboard.
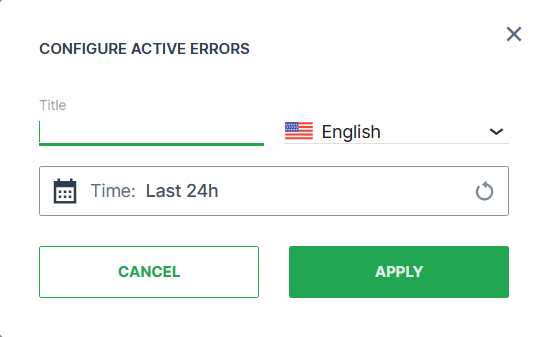
Errors & Faults
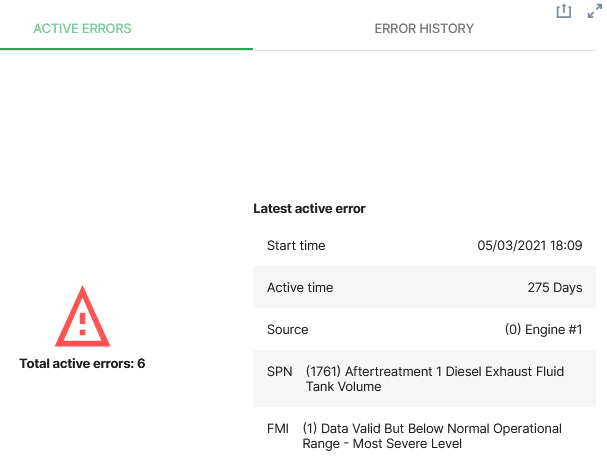
The Active Errors widget provides machine owners with a visualization of active machine errors and error history up to 30 days.
Note
Custom DTCs by the machine manufacturer that are transferred on the CAN bus in the J1939 DM1 format can also be displayed in this widget
Consider that there is also the DTC widget for showing these error codes.
Note
This widget can only be selected from the Model Dashboard.
Configuration
Configure the widget and put it on the Model Dashboard by following the steps below:
It is highly recommended to adapt a Machine Page (Model Dashboard) centrally via the Machine Page Layout. If you need to configure the Machine Page for the selected machine only, proceed as follows:
-
In the selected Machine Page, select Manage Layout > Add widgets.
-
Select the desired widget. A preview will be shown.
-
Click Apply. This forwards you to the widget configuration dialog with the options described below.
If you need to adapt the Organization Dashboard, select the desired dashboard configuration and click Edit > Add to open the widgets catalog, see also Add Widgets to the Organization Dashboard.
| Item | Description |
|---|---|
| Title | The label for the widget (English is the default, additional languages must be configured. See Language below). |
| Language | Select the language for the title of the widget. |
| Time | Select a predefined, relative time range, e.g. Last 24 hours or select a custom one, e.g. This last 5 Days, see Time selection. |
There are 2 tabs on the widget, Active Errors and Errors History.
Active Errors Tab
The Active Errors tab shows:
| Item | Description |
|---|---|
| Total active errors | Most recent errors on the machine within the time period specified. |
| Latest active error | Error details. |
| Start time | When the error first appeared (local time). |
| Active time | The period of time the error is active. |
| Source | The unit on the machine where the error occurs. |
| SPN | The signal affected by the error. |
| FMI | Detailed error description. |
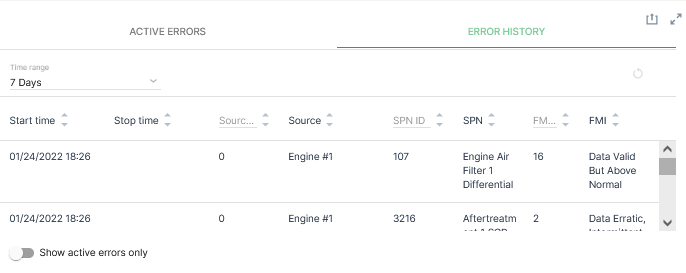
Errors History Tab
The Error History tab shows:
| Item | Description |
|---|---|
| List of errors | - |
| Time range | Select the time period for events from Relative (from the current time) or Absolute using a date picker. |
| Start time | When the error first appeared (local time). |
| Stop time | When the error was cleared* (local time). |
| Source | The unit on the machine where the error occurs. |
| SPN | The signal affected by the error. |
| FMI | Detailed error description. |
The Error History (DTC table) entries can be sorted by the Signal (SPN) or the Type of error (FMI).
Note
If the Stop time is empty, the error is still active.
Events
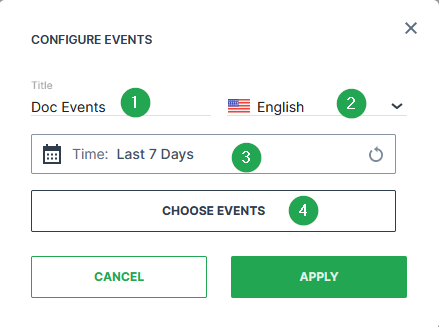
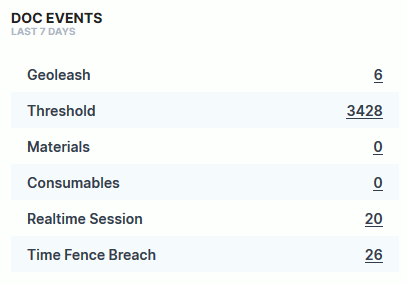
The Events widget allows you to view the number of selected events for your organization. For more information about this functionality, see Events.
Configuration
Configure the widget and put it on the Organization Dashboard and/or the Model Dashboard by following the steps below:
It is highly recommended to adapt a Machine Page (Model Dashboard) centrally via the Machine Page Layout. If you need to configure the Machine Page for the selected machine only, proceed as follows:
-
In the selected Machine Page, select Manage Layout > Add widgets.
-
Select the desired widget. A preview will be shown.
-
Click Apply. This forwards you to the widget configuration dialog with the options described below.
If you need to adapt the Organization Dashboard, select the desired dashboard configuration and click Edit > Add to open the widgets catalog, see also Add Widgets to the Organization Dashboard.
Events selection:
| # | Item | Description |
|---|---|---|
| 1 | Title | The label for the widget (English is the default, additional languages must be configured. See Language below). |
| 2 | Language | Select the language for the title of the widget. |
| 3 | Time range | Select the time period for the display of events up to the previous 2 years. |
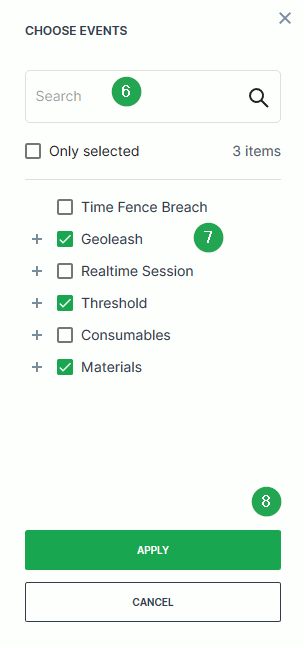
| 4 | Choose Events | Select the events that should be displayed in the widget. |
| 5 | Search Field | Search for internal or custom events implemented and made available to your organization. |
| 6 | Only selected (checkbox) | Only display events with a check mark next to it in the list. |
| 7 | Apply | Save your changes. |
Sample
Gauge
The Gauge widget allows the user to present signal data on a relative scale, including peak values.
Configuration
Configure the widget and put it on the Organization Dashboard and/or the Model Dashboard by following the steps below:
It is highly recommended to adapt a Machine Page (Model Dashboard) centrally via the Machine Page Layout. If you need to configure the Machine Page for the selected machine only, proceed as follows:
-
In the selected Machine Page, select Manage Layout > Add widgets.
-
Select the desired widget. A preview will be shown.
-
Click Apply. This forwards you to the widget configuration dialog with the options described below.
If you need to adapt the Organization Dashboard, select the desired dashboard configuration and click Edit > Add to open the widgets catalog, see also Add Widgets to the Organization Dashboard.
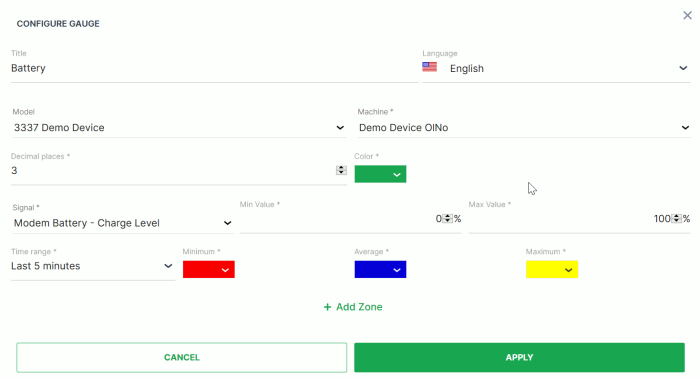
| Item | Description |
|---|---|
| Title | The label for the widget (English is the default, additional languages must be configured. See Language below). |
| Language | Select the language for the title of the widget. |
| Model* | The model of the machine you select to display the gauge (see Info). |
| Machine* | The machine that you select to display the gauge (see Info). |
| Decimal Places | Select the number of decimal places for the value. |
| Signal | Select the signal to be displayed. |
| Min Value | Where the counter will start. |
| Max value | Peak value where the limits of signal capacity or usage are reached. |
| Time | Select a predefined, relative time range, e.g. Last 24 hours or select a custom one, e.g. This last 5 Days, see Time selection. |
| Zones | A distinct value range on the gauge and many zones can be added on the gauge |
Note
*These config options can only be selected from the Organization Dashboard.
Sample
Additional Functionality: As shown in the picture below, clicking on the top-right icon redirects to the Report Chart to display the trends over time for this specific signal.
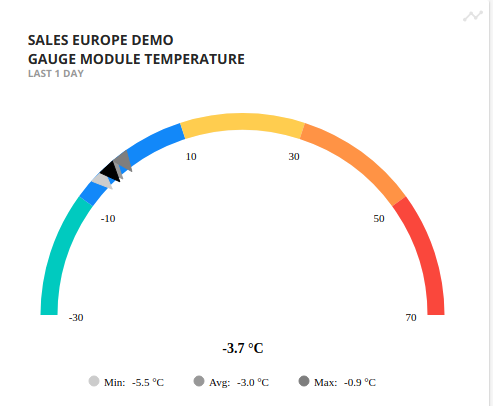
GeoLeash
The GeoLeash widget tracks and lists the events of machine relocation (defined as movement from one area to another).
An automatic notification can be enabled via the Manage Machine configuration, see View Breach Events.
Note
GeoLeash functionality (configuring a boundary) can only be implemented for devices where the installed firmware supports this feature. Contact your DataPortal representative for more information.
Note
Location history access must be set by an organization admin and is necessary to use this feature.
Configuration
Configure the widget and put it on the Organization Dashboard and/or the Model Dashboard by following the steps below:
It is highly recommended to adapt a Machine Page (Model Dashboard) centrally via the Machine Page Layout. If you need to configure the Machine Page for the selected machine only, proceed as follows:
-
In the selected Machine Page, select Manage Layout > Add widgets.
-
Select the desired widget. A preview will be shown.
-
Click Apply. This forwards you to the widget configuration dialog with the options described below.
If you need to adapt the Organization Dashboard, select the desired dashboard configuration and click Edit > Add to open the widgets catalog, see also Add Widgets to the Organization Dashboard.
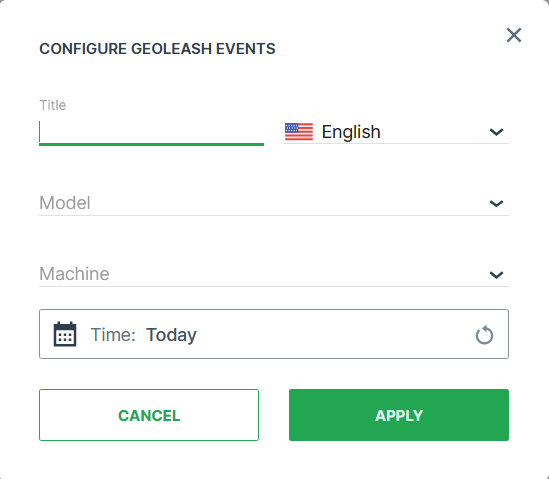
| Item | Description |
|---|---|
| Title | The label for the widget (English is the default, additional languages must be configured. See Language below). |
| Language | Select the language for the title of the widget. |
| Model* | The model of the machine you select to display the GeoLeash events. |
| Machine* | The machine that you select to display the GeoLeash events. |
| Time | Select a predefined, relative time range, e.g. Last 24 hours or select a custom one, e.g. This last 5 Days, see Time selection. |
Note
*These config options can only be selected from the Organization Dashboard.
Sample
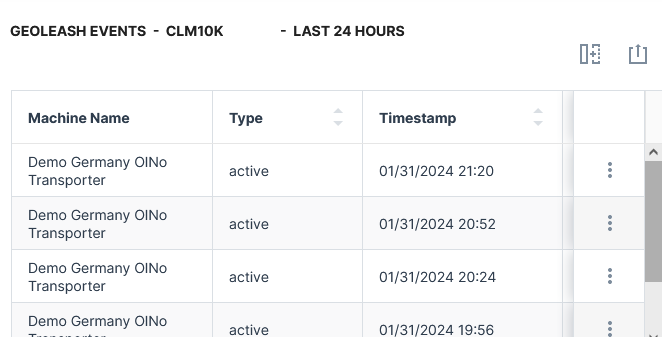
GeoFence
In the GeoFence widget, all GeoFences breaches for all or the selected machine are listed.
For every breach, the following is additionally displayed in the map:
-
the current location of the machine after the breach
-
the machine movement +-15 min from the event time
- direction of the track
GeoFence breaches can be also viewed at:
- GeoFence reports - lists all GeoFence breach events that can be viewed in a map.
- Events page - lists all GeoFence breach events.
Configuration
The widget is available both for the Organization Dashboard, listing all GeoFence breaches of all machines, and for the Model Dashboard, listing all GeoFence breaches of the selected machine.
It is highly recommended to adapt a Machine Page (Model Dashboard) centrally via the Machine Page Layout. If you need to configure the Machine Page for the selected machine only, proceed as follows:
-
In the selected Machine Page, select Manage Layout > Add widgets.
-
Select the desired widget. A preview will be shown.
-
Click Apply. This forwards you to the widget configuration dialog with the options described below.
If you need to adapt the Organization Dashboard, select the desired dashboard configuration and click Edit > Add to open the widgets catalog, see also Add Widgets to the Organization Dashboard.
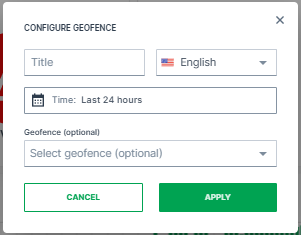
You can filter specific GeoFences (optional) within a specified time frame, e.g. last 24 hours.
To view all GeoFences, leave the field Geofence open and define only the time frame.
Note
Depending on the selected time frame, there might be no breaches at all for the machine or no breaches for the selected GeoFence. Consider selecting a broader time frame to view the breaches.
Sample
Once added, you will see the same table as in the GeoFence report with the additional GeoFence Name column:
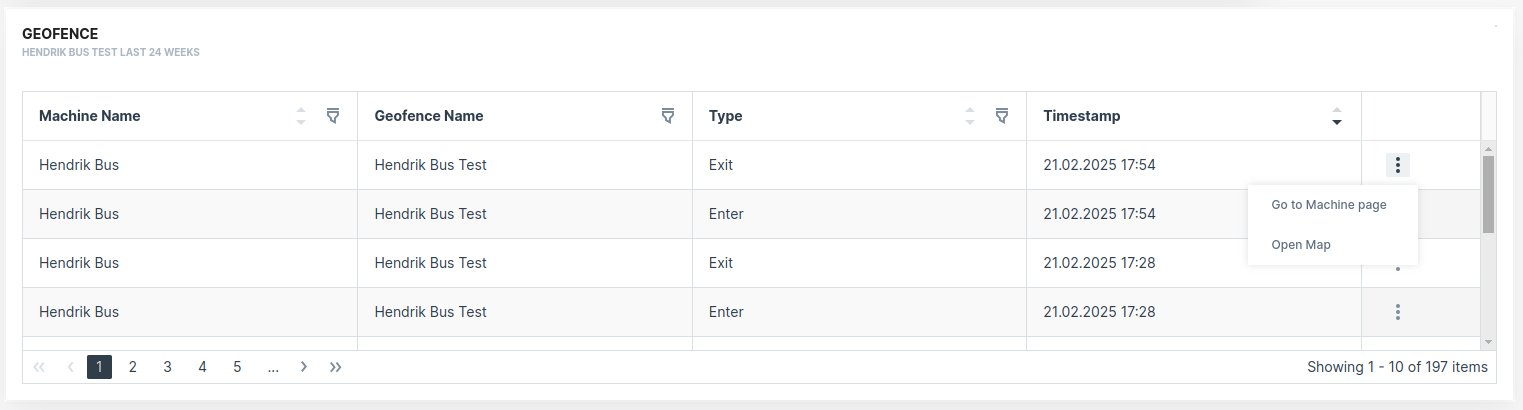
History
The History widget allows users to view historical signal values (for single or many machines/signals) on a chart.
Configuration
Configure the widget and put it on the Organization Dashboard and/or the Model Dashboard by following the steps below:
It is highly recommended to adapt a Machine Page (Model Dashboard) centrally via the Machine Page Layout. If you need to configure the Machine Page for the selected machine only, proceed as follows:
-
In the selected Machine Page, select Manage Layout > Add widgets.
-
Select the desired widget. A preview will be shown.
-
Click Apply. This forwards you to the widget configuration dialog with the options described below.
If you need to adapt the Organization Dashboard, select the desired dashboard configuration and click Edit > Add to open the widgets catalog, see also Add Widgets to the Organization Dashboard.
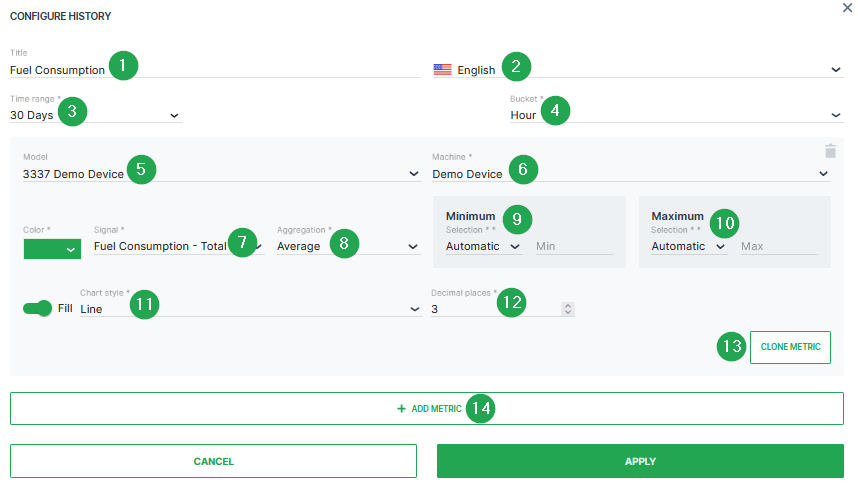
| # | Item | Description |
|---|---|---|
| 1 | Title | The label for the widget (English is the default, additional languages must be configured. See Language below). |
| 2 | Language | Select the language for the title of the widget. |
| 3 | Time | Select a predefined, relative time range, e.g. Last 24 hours or select a custom one, e.g. This last 5 Days, see Time selection. |
| 4 | Bucket | Choose the time intervals between data points in the report from hour, day or week, see below. |
| 5 | Model* | The model of the machine. |
| 6 | Machine* | The machine you want to select. |
| 7 | Signal | Select the signal to be displayed. |
| 8 | Aggregation | The value returned for the signal, calculated using all the measurements within each Bucket. |
| 9 | Minimum | Default scaling is Automatic. Optional you can select Manual. If the minimum value for the chosen signal is configured within the PDC, Predefined by OEM would be also an available scaling option. |
| 10 | Maximum | Default scaling is Automatic. Optional you can select Manual. If the maximum value for the chosen signal is configured within the PDC, Predefined by OEM would be also an available scaling option. |
| 11 | Chart Style | Choose the style from columns, lines or steps. |
| 12 | Decimal places | Select the number of decimal places for the value. |
| 13 | CLONE METRIC | Duplicate the settings from a configured signal. |
| 14 | ADD METRIC | Add another metric to the report. |
Note
*This config option can only be selected from the DataPortal Organization Dashboard.
Configure Buckets
As an admin with the Dashboard:Admin permission set, you may define default values for the bucket used for each (relative) time range
If the buckets are not defined, the following buckets will be selected automatically.
Note
The buckets are not selected when clicking the diagram icon which leads you to configuration of the Report Parameters, see also Sample below for an example.
| Relative Time Range | Bucket |
|---|---|
| Default | As specified by Dashboard:Admin |
| Last 4h | minutes |
| Last 24h | hour |
| Last 48h | hour |
| Last 7 days | days |
| Last 30 days | days |
| Today so far | hour |
| Yesterday | hour |
| Current week | day |
| Current month | day |
| Current year | month |
| Previous week | day |
| Previous month | day |
| Previous year | month |
As an admin, you can also set the default configuration for the minimum and maximum values
When a user selects another time range than the default (by clicking the calendar icon), the automatic minimum and maximum values are selected (not the configured ones):
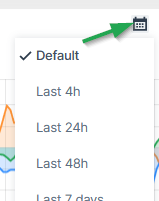
Sample
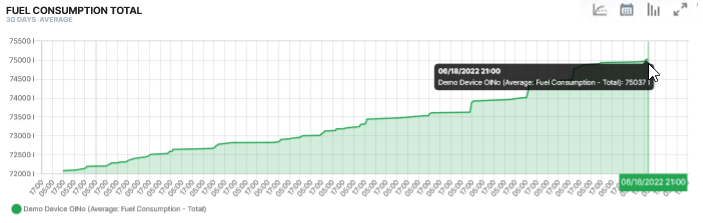
The History widget offers additional configuration options on the dashboard:
-
 Clicking on the diagram icon in the top-right of the widget opens the CONFIGURE PLOT window to create a Report.
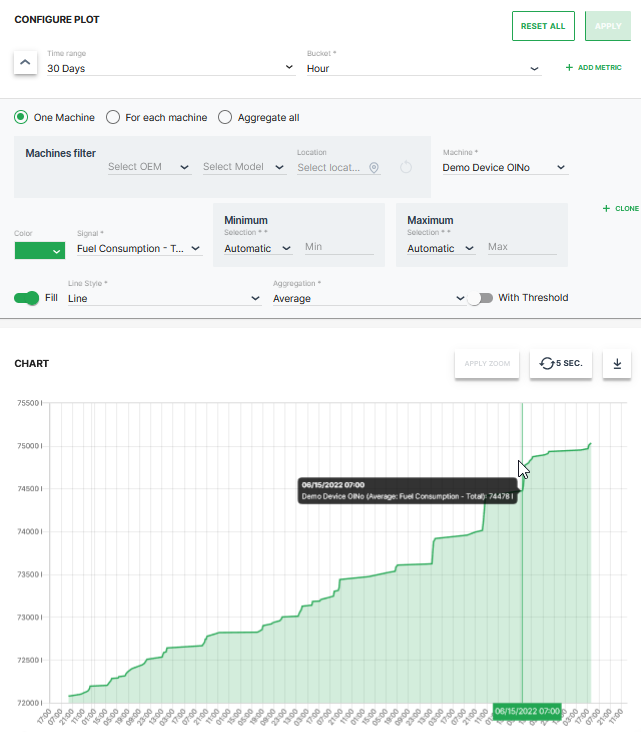
Figure 4: Report Example -
 The Total Delta Values icon is available in the History widget only for (continuous) counter signals with delta aggregation
Its function is to sum up the values for the selected time range allowing you to get an idea of totals without manual calculation for each signal in the widget
See the following example for machine operating hours: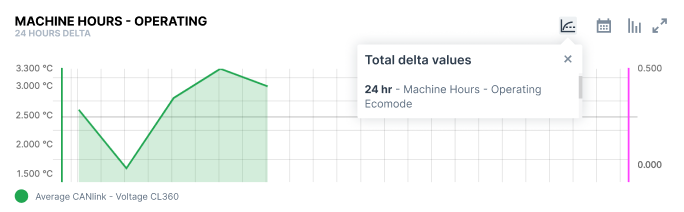
Figure 5: Total Delta Example
Latest Value
The Latest Value widget displays the most recent value returned from the machine for a specific signal.
Configuration
Configure the widget and put it on the Organization Dashboard and/or the Model Dashboard by following the steps below:
It is highly recommended to adapt a Machine Page (Model Dashboard) centrally via the Machine Page Layout. If you need to configure the Machine Page for the selected machine only, proceed as follows:
-
In the selected Machine Page, select Manage Layout > Add widgets.
-
Select the desired widget. A preview will be shown.
-
Click Apply. This forwards you to the widget configuration dialog with the options described below.
If you need to adapt the Organization Dashboard, select the desired dashboard configuration and click Edit > Add to open the widgets catalog, see also Add Widgets to the Organization Dashboard.
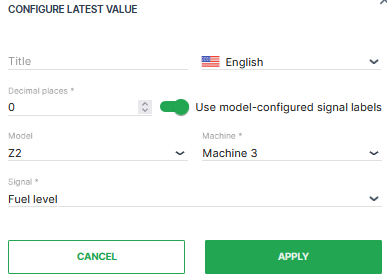
| Item | Description |
|---|---|
| Title | The label for the widget (English is the default, additional languages must be configured. See Language below). |
| Language | Select the language for the title of the widget. |
| Decimal Places | Select the number of decimal places for the value. |
| Use model-configured signal labels | Present custom error codes or machine states in textual form. See Signal Labels. |
| Model | Model name |
| Machine | Machine name |
| Signal | Select the signal to be displayed. |
Sample
Clicking on the ![]() icon in the top-right of the widget opens the CONFIGURE PLOT window to create a Report.
icon in the top-right of the widget opens the CONFIGURE PLOT window to create a Report.
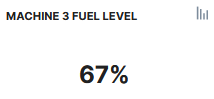
Machine List
The Machine List widget allows users to view a list of machines, specify details on display and include selected signals for each machine
You can select the machines from the list or sort using a filter.
Configuration
Configure the widget and place it on the Organization Dashboard.
It is highly recommended to adapt a Machine Page (Model Dashboard) centrally via the Machine Page Layout. If you need to configure the Machine Page for the selected machine only, proceed as follows:
-
In the selected Machine Page, select Manage Layout > Add widgets.
-
Select the desired widget. A preview will be shown.
-
Click Apply. This forwards you to the widget configuration dialog with the options described below.
If you need to adapt the Organization Dashboard, select the desired dashboard configuration and click Edit > Add to open the widgets catalog, see also Add Widgets to the Organization Dashboard.
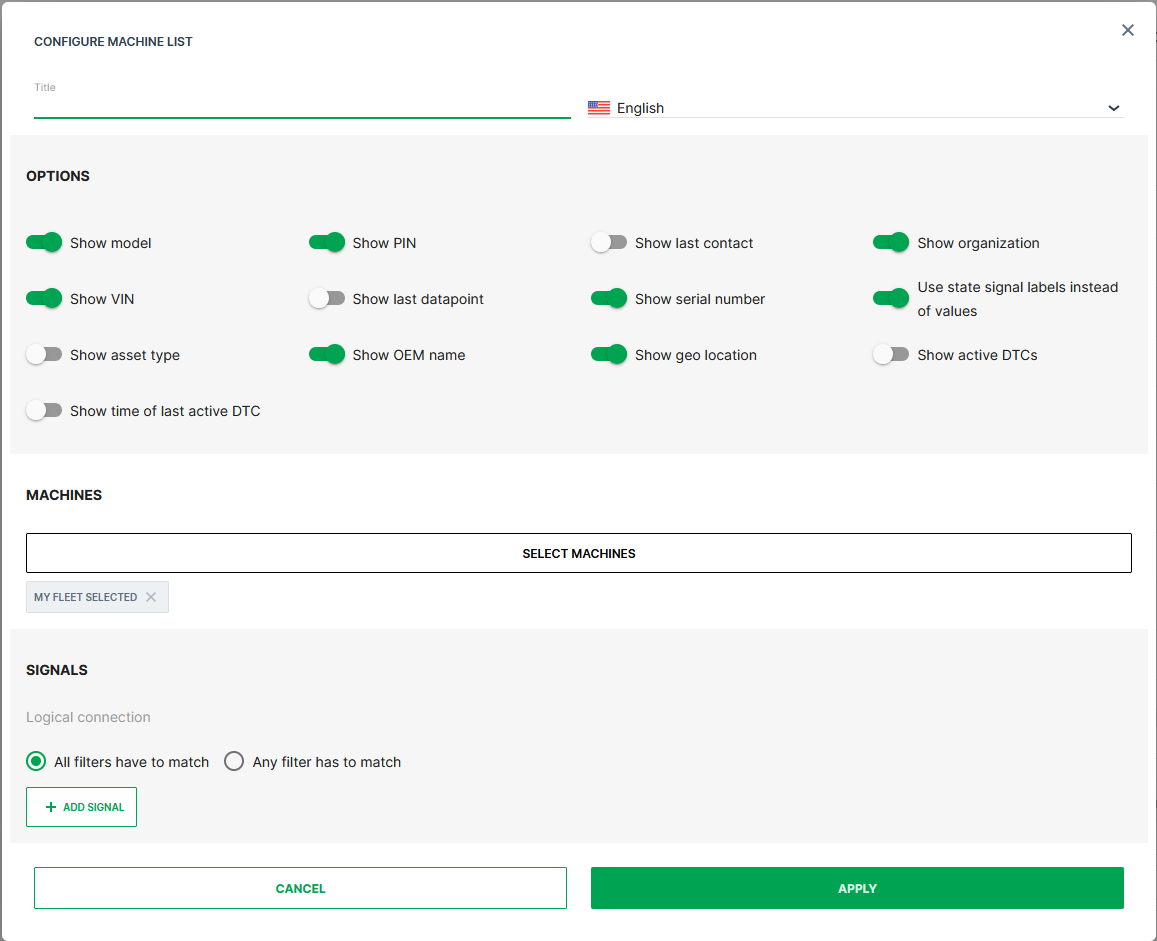
| # | Item | Description |
|---|---|---|
| 1 | ||
| Title | The label for the widget (English is the default, additional languages must be configured. See Language below). | |
| Language | Select the language for the title of the widget. | |
| 2 | Options | |
| Show model: Toggle model display. On by default. | ||
| Show organization: Toggle organization display. On by default. | ||
| Show serial number: Toggle serial number display. On by default. | ||
| Show PIN: Toggle PIN display. On by default. | ||
| Show VIN: Toggle VIN display. On by default. | ||
| Use model-configured signal labels: Present custom error codes or machine states in textual form. See Signal Labels. | ||
| Active DTCs: Count of active DTCs. | ||
| Time of Last Active DTC: Start time of the most recent and still ongoing DTC. | ||
| 3 | Machines | Select the machines from the provided list of all machines or based on entered filter criteria, see Select Machines below. |
| 4 | Signals | See Custom Signal Filter below. |
Select Machines
Note
Auto-select my fleet in the By Organizations tab is pre-selected and will be applied when no other filter is set.
Click Select Machines to filter and select the machines that will be listed in the widget.
You can select the machines by the following options:
By Model*:
In the By Models tab, you can select the machines belonging to certain models:
-
Search: Search a specific model.
-
Models list: Select the models individually in the list of models.
-
Show overall selected: Display which models have been selected already.
By Organization:
In the By Organizations tab, you can select the machines belonging to certain organization units:
-
Auto-select my fleet: Select all the organization units together with the sub-organizations that your user has access to.
-
Manual selection: Select individual organization units in the list of organizations. When selecting the top-level, all sub-organizations will be selected.
-
Search: Search a specific organization.
-
Show overall selected: Display which organizations have been selected already.
By Machine:
In the By Models tab, you can select the machines individually:
-
Search: Search a specific machine.
-
Machines filter: Filter the list of machines by OEM or Location.
-
Select all: Select all available machines that your user has access to.
-
Show overall selected: Display which machines have been selected already.
-
List of Machine: Select specific machines.
Custom Signal Filter
This section expands to display signal configuration options when Add Signal is clicked. Custom signal filters allow the display of machines that meet one or more criteria.
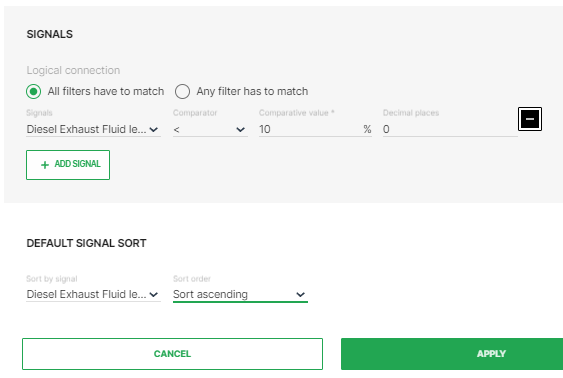
| Option | Description |
|---|---|
| All filters have to match | ALL conditions must be met to display the machine in the list. |
| Any filter has to match | ANY (at least one) conditions must be met to display the machine in the list. |
| Signals | Signal to filter results by. |
| Comparator | Comparison operators >, < and = are available for numeric values, and contains is available for string values. |
| Comparative value | Value used to filter and sort results. |
| Decimal Places | Decimal places considered in the filter results. |
| Default Signal Sort | Sort by signal: Signal used to sort the signals. Sort order: Choose from Sort ascending or Sort descending. |
Sample
Suggested Usage: Inventory list of Machines
Includes devices with [Online (Logging_and_Realtime]online_(logging_and_realtime.md).
After configuring the Machine List widget, the signals will be displayed in a table with the following columns, see also image below:
-
ID
-
Connection status
-
Name
-
VIN
-
PIN
-
Serial Number
-
Model
-
OEM
-
Organization
-
Continent
-
Country
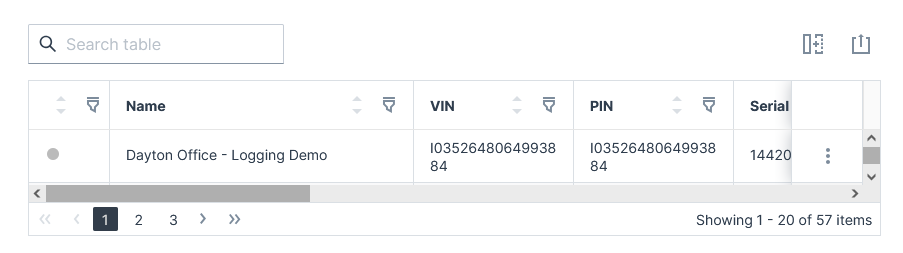
For information on how to adapt the table view, see Table Options
For information on how to export this table with the included columns, see Export Table.
Machine Map
The Machine Map widget allows users to view machines in their organization on a map and grouped in clusters separate from the rest of the fleet. A group of machines can also be selected to be displayed on the map.
Tip
Weather and Map overlay features are available with the Weather Forecasts and Overlay.
Configuration
Configure the widget and place it on the Organization Dashboard by following the steps below:
It is highly recommended to adapt a Machine Page (Model Dashboard) centrally via the Machine Page Layout. If you need to configure the Machine Page for the selected machine only, proceed as follows:
-
In the selected Machine Page, select Manage Layout > Add widgets.
-
Select the desired widget. A preview will be shown.
-
Click Apply. This forwards you to the widget configuration dialog with the options described below.
If you need to adapt the Organization Dashboard, select the desired dashboard configuration and click Edit > Add to open the widgets catalog, see also Add Widgets to the Organization Dashboard.
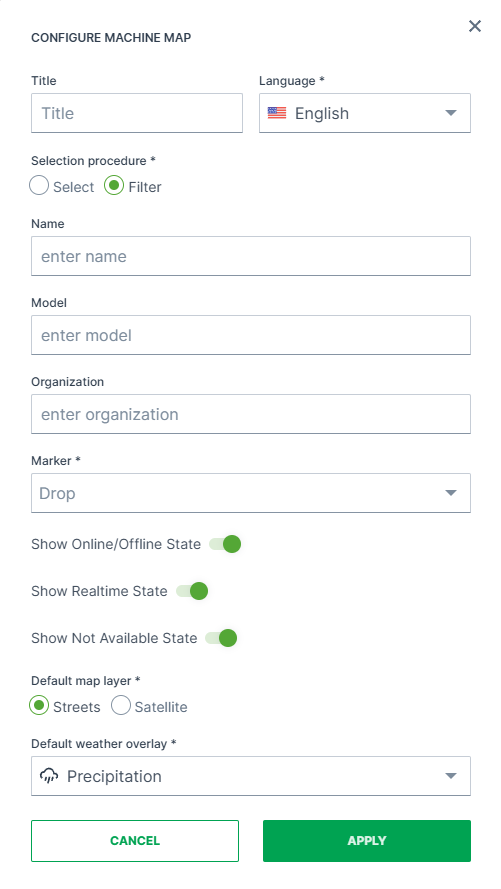
| Item | Description |
|---|---|
| Title | The label for the widget (English is the default, additional languages must be configured. See Language below). |
| Language | Select the language for the title of the widget. |
| Select | Provide a list of machines from an entire organization or a specific organization. |
| Filter | Select machines based on entered criteria. If all fields are empty, then all machines are listed. |
| Name | Machine name |
| Model | Model name |
| Organization | Specify the organization in which the machines should be selected. |
| Marker | Select either Drop or Machine as the machine indicator on the map. |
| Show Online/Offline State | Toggle current activation status display. Includes devices with Online (Logging and Realtime). |
| Show Realtime State | Toggle display of logging vs. realtime/online communication status. Includes devices with Online (Logging and Realtime). |
| Show Not Available State | Toggle display of devices that are currently not available or inactive. |
| Default Map Layer | Set the default map overlay. Choose between Streets or Satellite. For examples, see Maps Overlay. |
| Default Weather Overlay | Set the default weather overlay in the machine map. Choose between: No Overlay, Clouds, Precipitation, Air Pressure, Wind Speed, Temperature For examples, see Maps Overlay. |
Note
For tracking options, you may use the Reports feature, see Map/Location Reporting.
Sample
Suggested Usage of the Machine Map Widget: Overview of the distribution and position of the machines.
-
The map shows clusters of machines. A cluster icon represents many machines which are in close geographical proximity.
-
When zooming-in, bigger clusters are broken down into smaller ones until it shows the individual machines on the map.
-
When clicking a machine on the map, a pop-up will be displayed with detailed information, see Machines Overview.
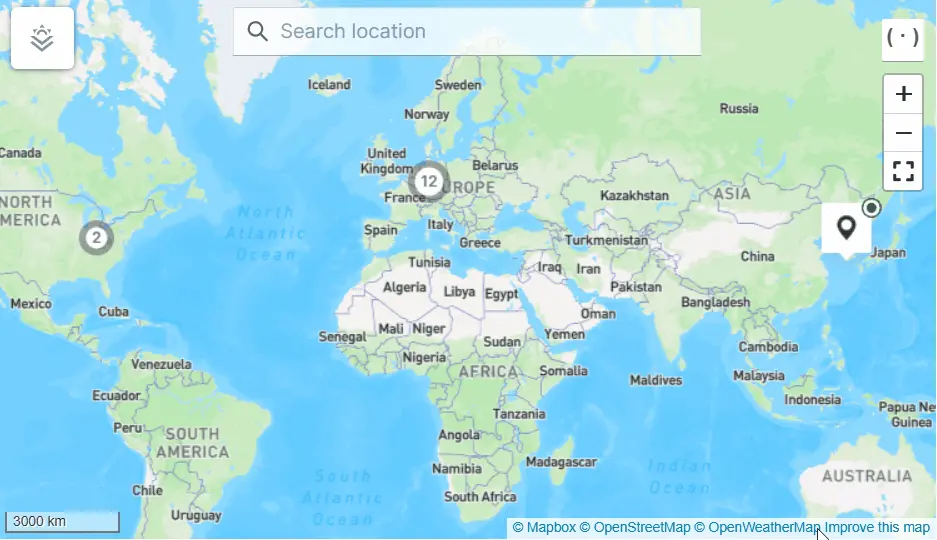
Master Data Widget
The Machine Master Data widget allows the user to view the machine vital information such as status and distance tracking during a selected time period
It is stored as a default widget in the Model Dashboard, see Machine Master Data Panel section below.
Configuration
Configure the widget and store it on the Model Dashboard by following the steps below
For the Organization Dashboard, you have the widgets Machine Map and Machine List that show similar information.
It is highly recommended to adapt a Machine Page (Model Dashboard) centrally via the Machine Page Layout. If you need to configure the Machine Page for the selected machine only, proceed as follows:
-
In the selected Machine Page, select Manage Layout > Add widgets.
-
Select the desired widget. A preview will be shown.
-
Click Apply. This forwards you to the widget configuration dialog with the options described below.
If you need to adapt the Organization Dashboard, select the desired dashboard configuration and click Edit > Add to open the widgets catalog, see also Add Widgets to the Organization Dashboard.
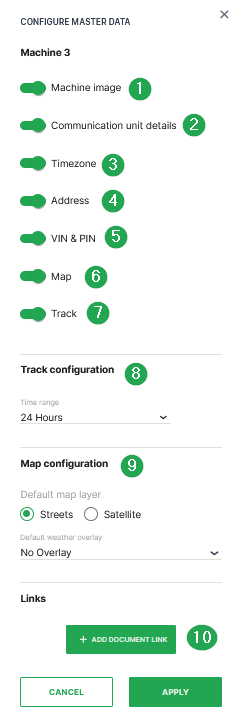
| # | Item | Description |
|---|---|---|
| 1 | Machine Image | Display the image of the machine. Upload an image by following the instructions here. |
| 2 | Communication unit details | Display the communication unit details and usage. |
| 3 | Timezone | Display the timezone of the machine's last known location. |
| 4 | Address | The machine's last known location and displays the time of the most recent location update. |
| 5 | VIN & PIN | Vehicle Identification Number and Part Identification Number. |
| 6 | Map | Display the location of the machine on a map. |
| 7 | Track | Enables a view of the paths travelled to and from different locations during the time period set in the Track Configuration. |
| 8 | Track configuration* | Select the relative time range from now for the track. |
| 9 | Map Configuration | Note that weather and map overlay features are only available with the Feature Switch |
| For examples, see Maps Overlay | ||
| * Default map layer: Streets or Satellite | ||
| * Default weather overlay: No Overlay, Clouds, Precipitation, Air Pressure, Wind Speed, Temperature. | ||
| 10 | Add Document Link | Here, links to URLs or documents can be added. |
*Only active when Track is selected.
Machine Master Data Panel
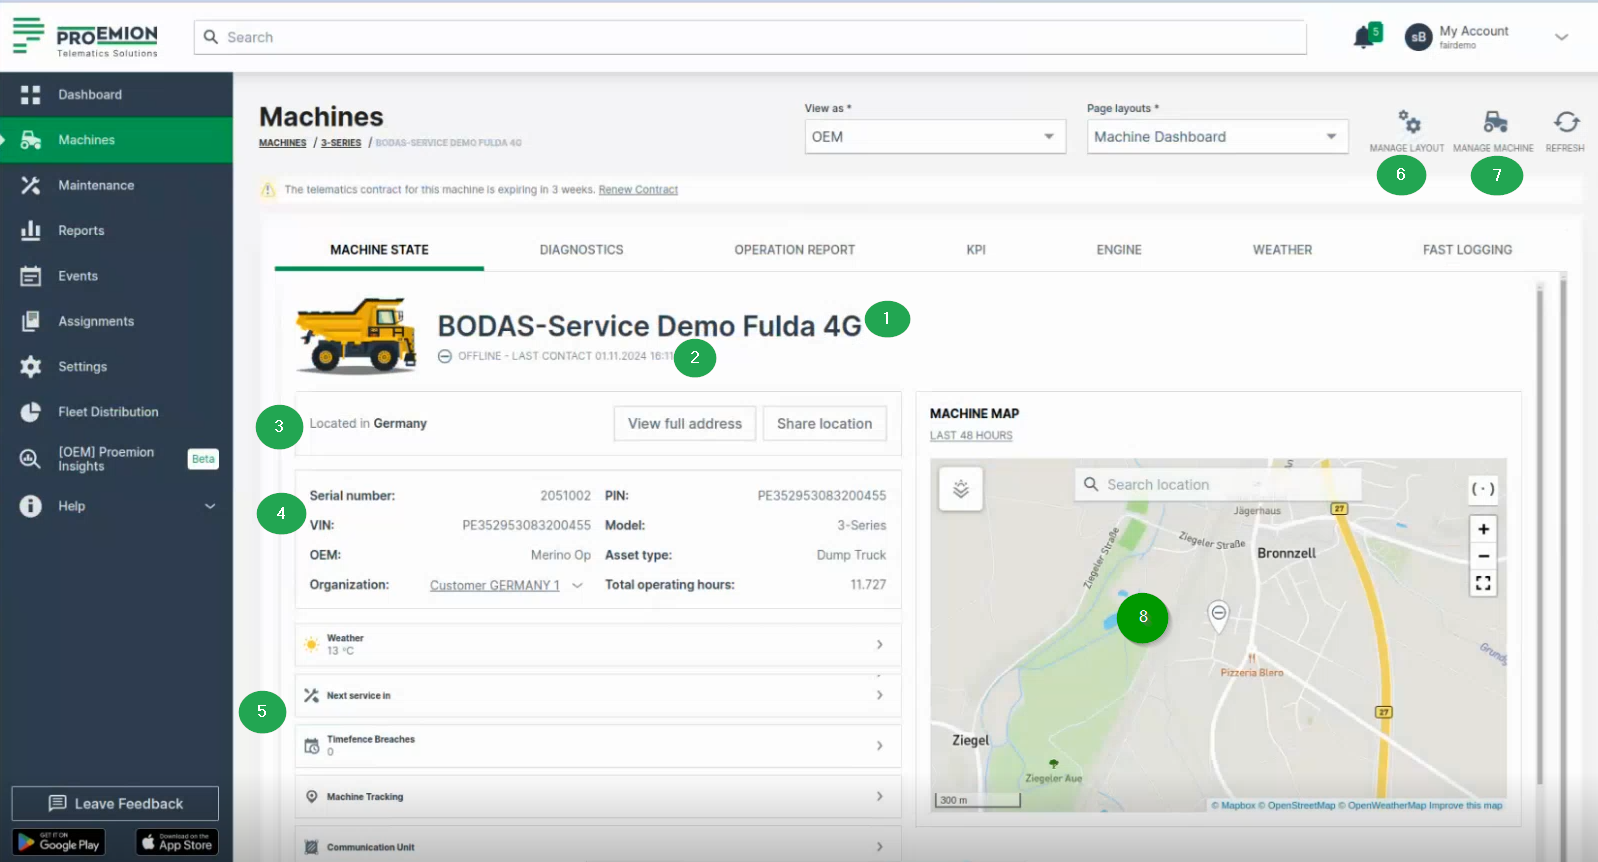
The Master Data widget will display the information in form of a panel on the dashboard within the following two tabs Machine Details and Location - provided that options are activated in the Master Data Configuration.
Machine Details
Shows the machine info and other details via icons for Maintenance Tasks, Machine Tracking and Weather Forecasts and Overlay when enabled in the Feature Switch. In the Details tab, the following information is displayed additionally to the configured ones:
| # | Item | Description |
|---|---|---|
| 1 | Machine Name | Name of the machine. |
| 2 | Connection Status | Current state (online/offline) since a particular date. |
| 3 | Location | Share the location of the machine, see Location. |
| 4 | Machine Info | Serial number - Serial number of the machine. Organization - The organization that created the machine and shares details. Machine Model - See Machine Model. OEM - The Organization the machine belongs to. Asset Type - See Asset Types. |
| 5 | Tabs | 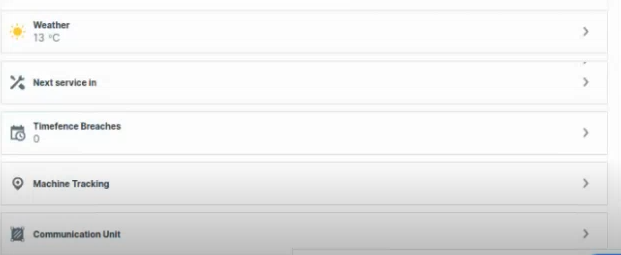 |
| 6 | Manage Layout | Configure the layout of the Machine Details Page, see Manage Layout |
| 7 | Manage Machine | Configure the machine's properties, see Manage Machine. |
| 8 | Map | Displays the machine's location on a map. If the machine is offline, a drop icon with a minus sign indicates its last known position. 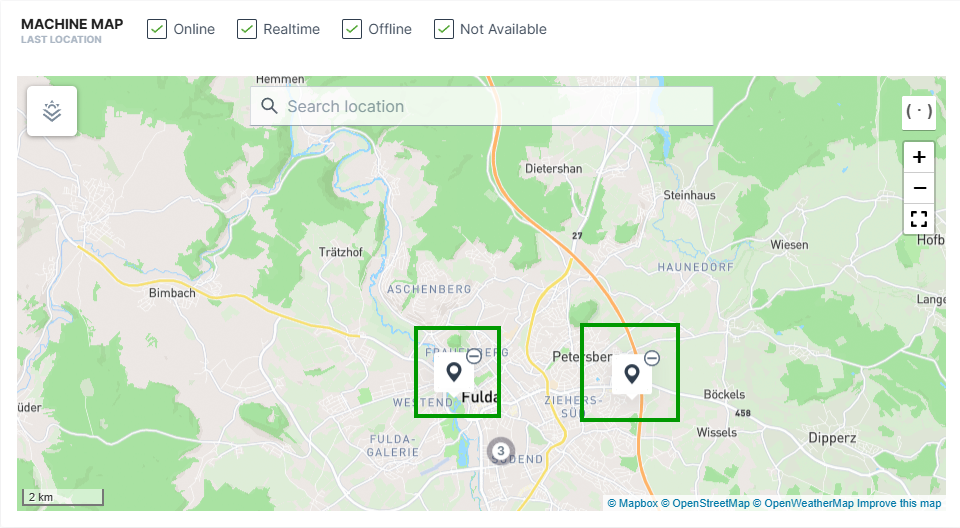 If the machine is online, the endpoint of the current track (circle with the number 3) is displayed . When zooming in, both the starting point (circle with letter A) and the current location (circle with number 2) of the machine are displayed. 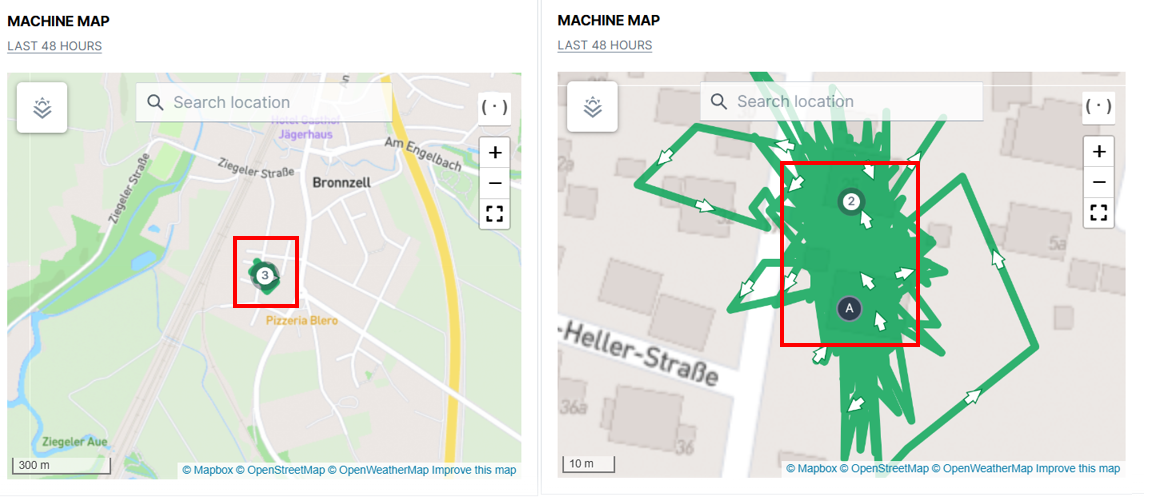 |
Location
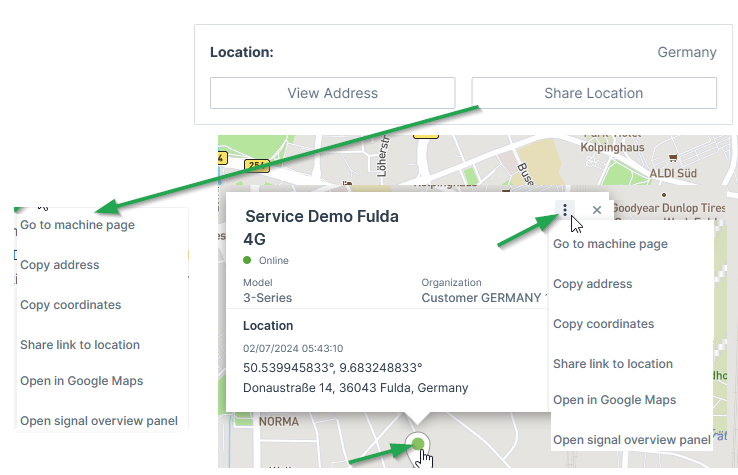
The Location tab gives information about the machine's address and its Status and Update. Via the 3-dots you have options to copy and share the machine's location, see also Machines Overview.
Only if tracking is activated in Machine Master Data, location tracking is visible for the time range displayed above the map.
Note
Location data access must be set by an organization admin and is necessary to use this feature.
Contract Renewal
Contracts that are expiring soon are highlighted in the Machine Page within a banner on the top.
Depending on the user, the information in the banner changes:
-
As a user without at least Contract:Maintain permissions e.g. as a Machine Owner, you may only Request Renewal:
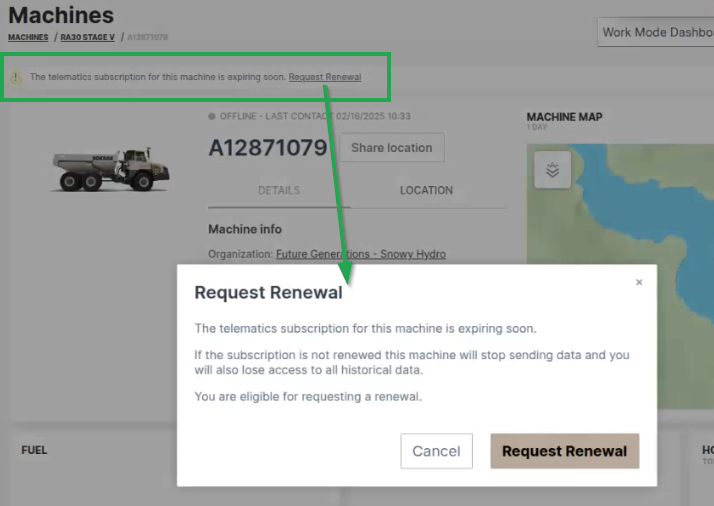
Figure 4: Contract Renewal banner Note
This request will be displayed both on the OEM portal and in the digest email listing the soon expiring contracts.
The eligible user may then renew the contract with Proemion. see below. -
As an eligible user e.g. as the OEM, you are displayed the message that a renewal was requested:
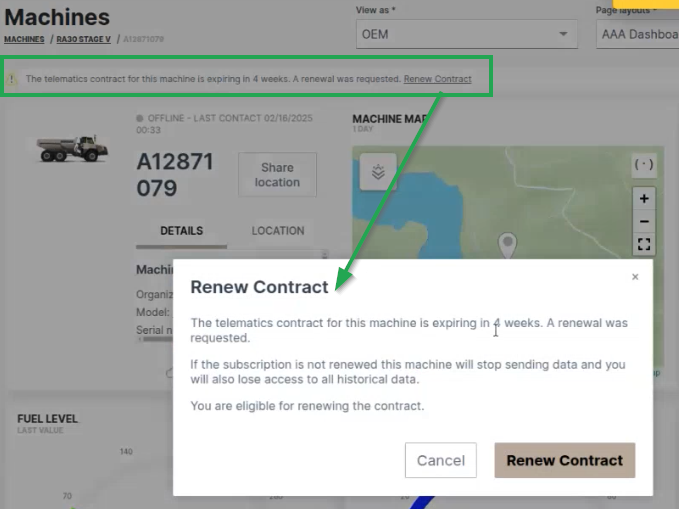
Figure 5: Contract Renewal requested -
Clicking Renew Contract, you will be forwarded to the Machine Contracts menu, where you can configure and confirm the Renew process for the selected machine:
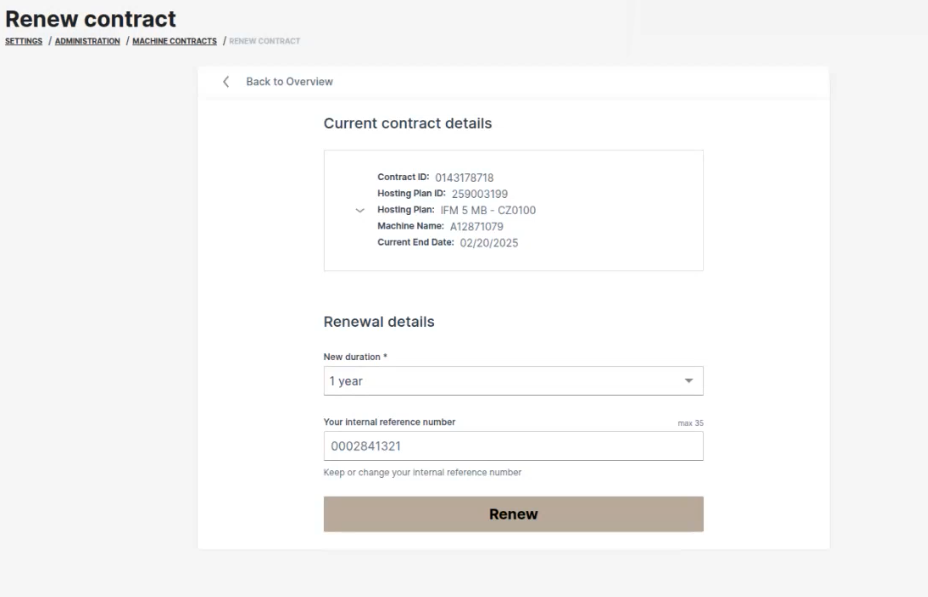
Figure 6: Renew Contracts Note
To renew an "active (canceled)" or terminated contract, you need Contract:Maintain permissions.
-
After successful renewal, a confirmation will be displayed in the Machine Contracts menu:
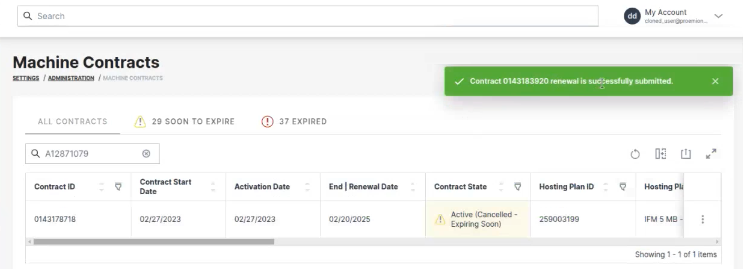
Figure 7: Renew Contracts confirmed
-
After clicking the link in the banner, it will disappear from the machine.
Weather Forecasts and Overlay
The Machine Master Data Panel displays the weather forecast and historical data for the machine geolocation.

Prerequisites
Weather Forecasts and Overlay is a specialized feature available in the DataPortal as part of Feature Switches
It should be noted that implementing this functionality requires additional Proemion resources including project setup, manual configuration, recurring services and costs.
Note
Contact Support or an FAE to discuss implementing Weather Forecasts and Overlay for your organization.
Note
Only users with the Organization: Admin permission set can manage weather forecasts and overlays.
Note
Location data access must be set by an organization admin and is necessary to use this feature.
Weather Overview
Available data is shown in the table:
| Weather Item | Unit |
|---|---|
| Temperature | Degrees in °C |
| Wind speed | Meters per second (m/s) |
| Humidity | Percentage (%) |
| Air Pressure | Hectopascal Pressure Unit (hPa) |
| Weather types | clear |
| rain | |
| snow | |
| clouds | |
| thunderstorms |
You can see the temperature in the machine location in the bottom of the information panel to the right.
Note
Maps Overlay data (see the scale) is provided in metric units, while Forecast data reflects the standard selected in User Settings.
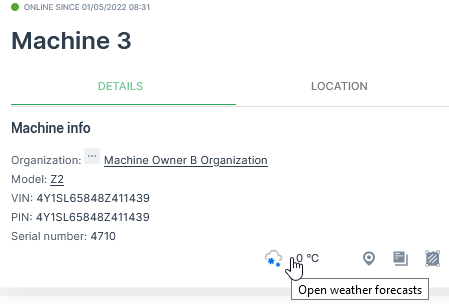
Open the forecast for the surrounding area by selecting the temperature:
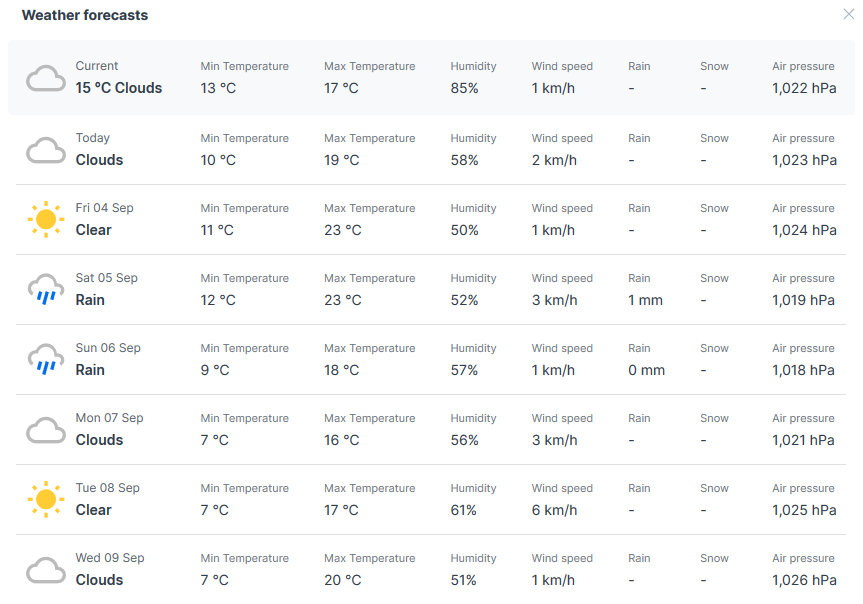
Maps Overlay
Note
This functionality is available via Feature Switch.
The Maps Overlay covers both the Map overlay and the Weather overlay options.
Map Overlay changes the view on the map:
-
Streets is the map view (default view).
-
Satellite shows true colour aerial image.
Weather overlay additionally shows different aspects of the weather on the map.
The options can be combined as in the following examples:
In the map, select the Overlay  icon to open the Maps Overlay menu. There, select one or more overlay options.
In the following example, we have selected the default Streets overlay and Wind direction overlay that shows the wind speed scale in the bottom right corner of the map:
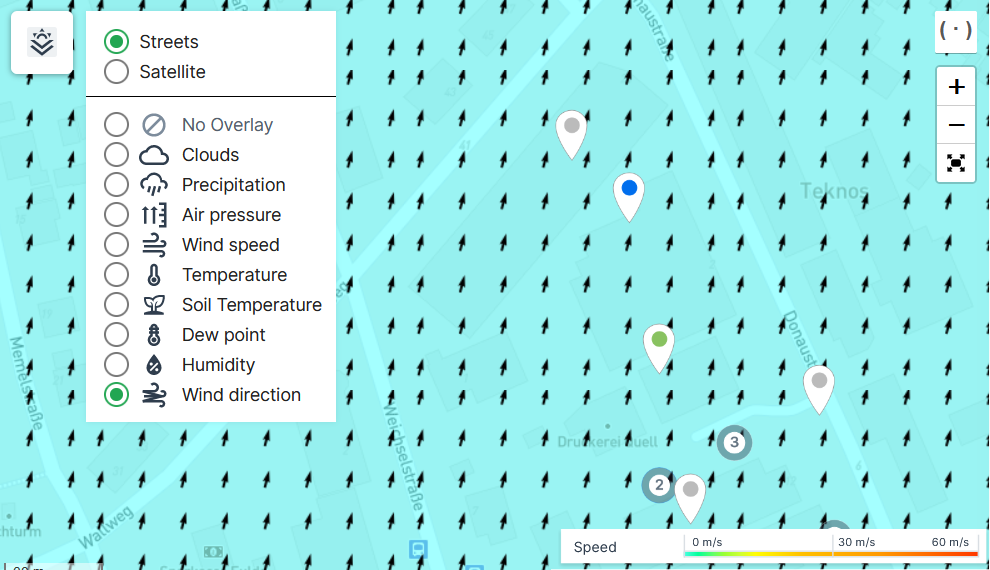
In the following example, in the same map, we have now selected the Satellite and Temperature overlay that also shows the temperature scale in the bottom right corner of the map:
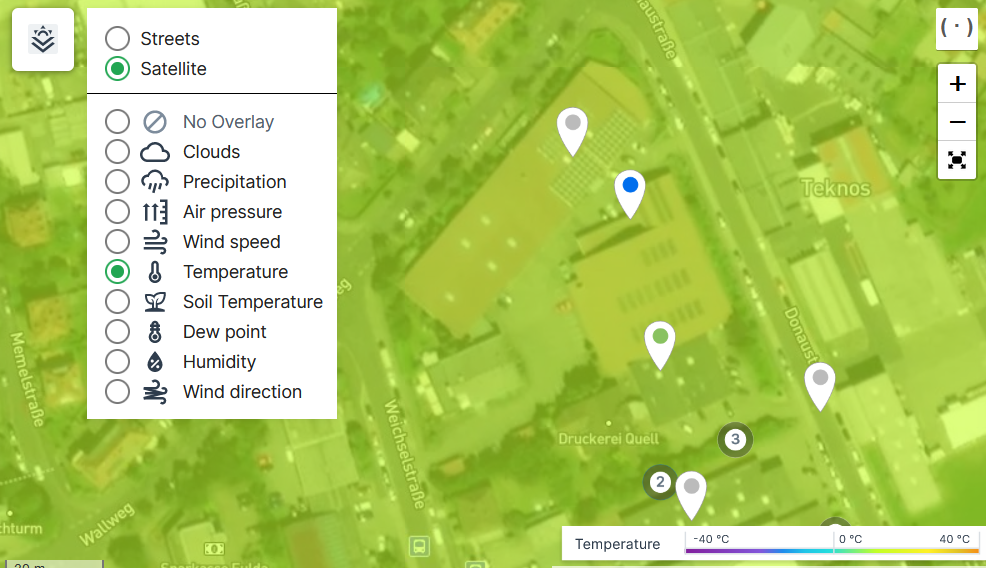
Communication Unit Firmware Details and History
The Machine Master Data Panel displays information about the Communication Unit firmware and configuration via Communication Unit Details.
Click the Open communication unit details icon in the bottom-right corner to view Communication Unit Details.
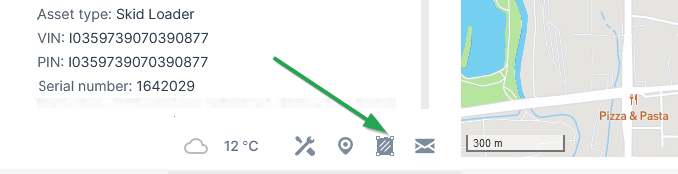
For detailed information refer to Communication Unit Details.
Status and Update
Note
To display the latest address of the selected machine, please select the LOCATION tab first.
The Machine Master Data Panel displays the most recent location status update. However, this information may not always reflect the realtime status of the machine and so there are safeguards in place that indicate potentially misleading state data
The most recent location time exceeding 8 hours is flagged with a warning (yellow indicator).
Note
Location data access must be set by an organization admin and is necessary to view map location.
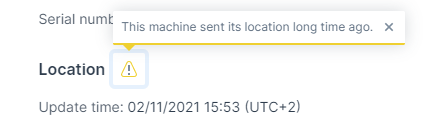
If the latest signal was received > 2 hours later than the most recent location update it is flagged with an alert (red indicator).
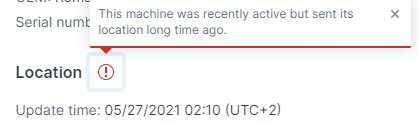
Status data (location info, warnings and alerts) is visible on the following DataPortal screens:
-
Organization Dashboard > Map tooltip
-
Machines Overview > Map tooltip
-
Machine Page > Location tab
SCADA
The SCADA widget enables the creation of custom, SVG-based visualizations that dynamically display SCADA signals, with full responsiveness and proper scaling across all screen sizes.
SVG (Scalable Vector Graphics) templates are XML-based files used to create vector images that scale without loss of quality. In dynamic applications like SCADA widgets, SVG templates visualize real-time data by embedding placeholders replaced with live values during runtime.
The following documentation explains how to create SVG templates that display live signal data using Angular bindings — the frontend framework used in the DataPortal.
This guide provides all the necessary rules to create valid templates, without requiring detailed knowledge of the underlying system.
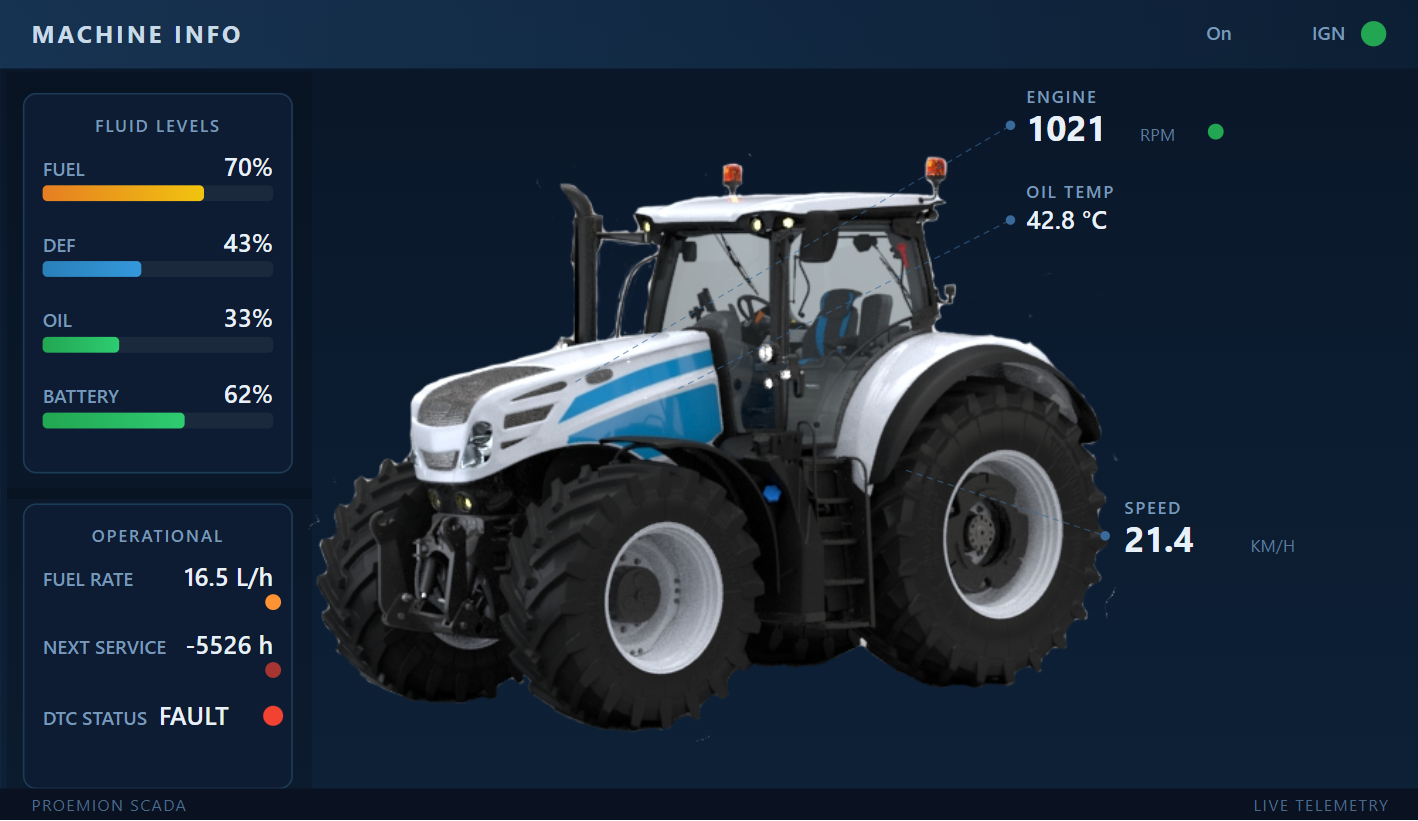
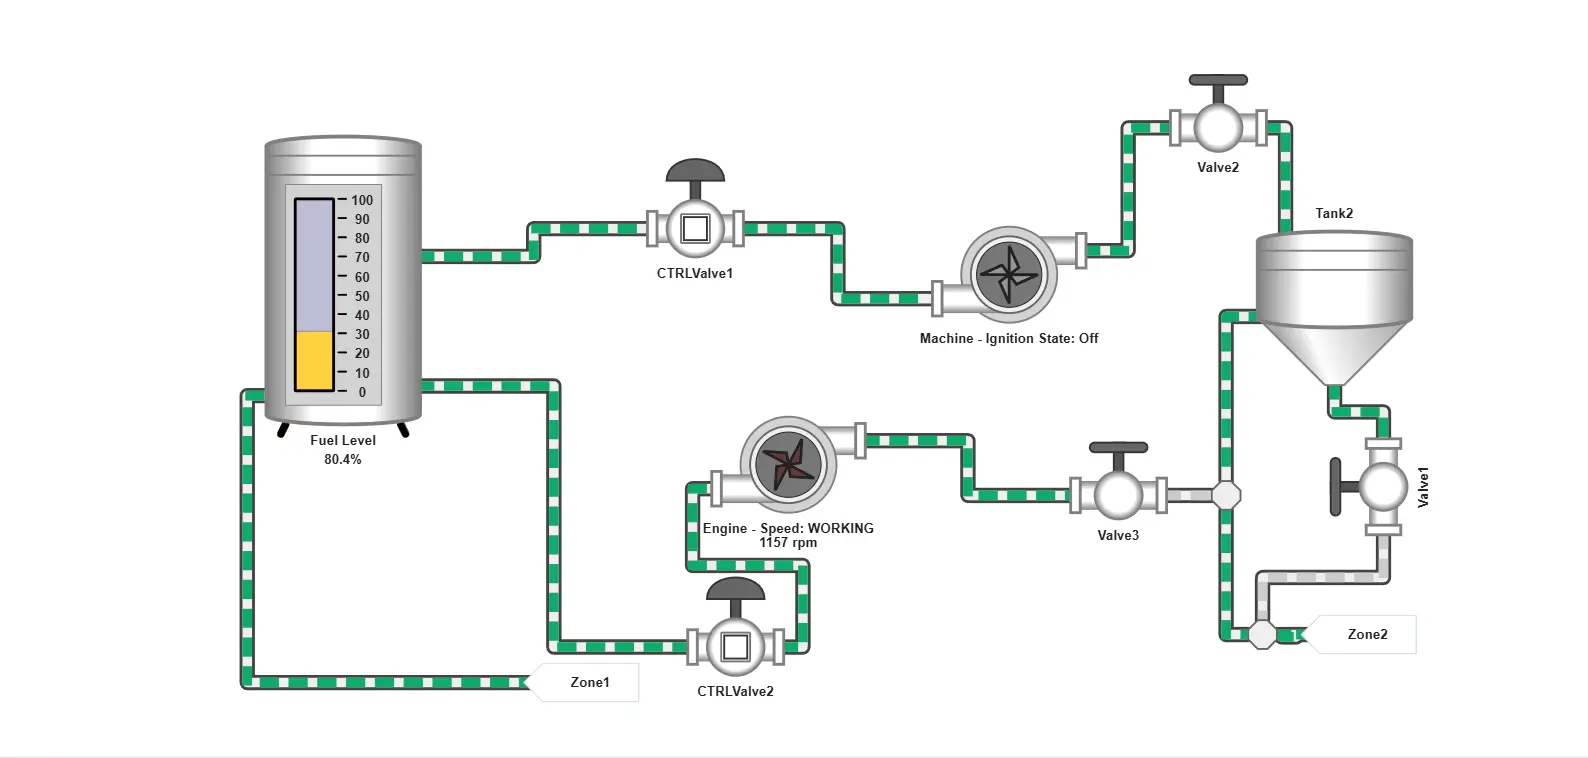
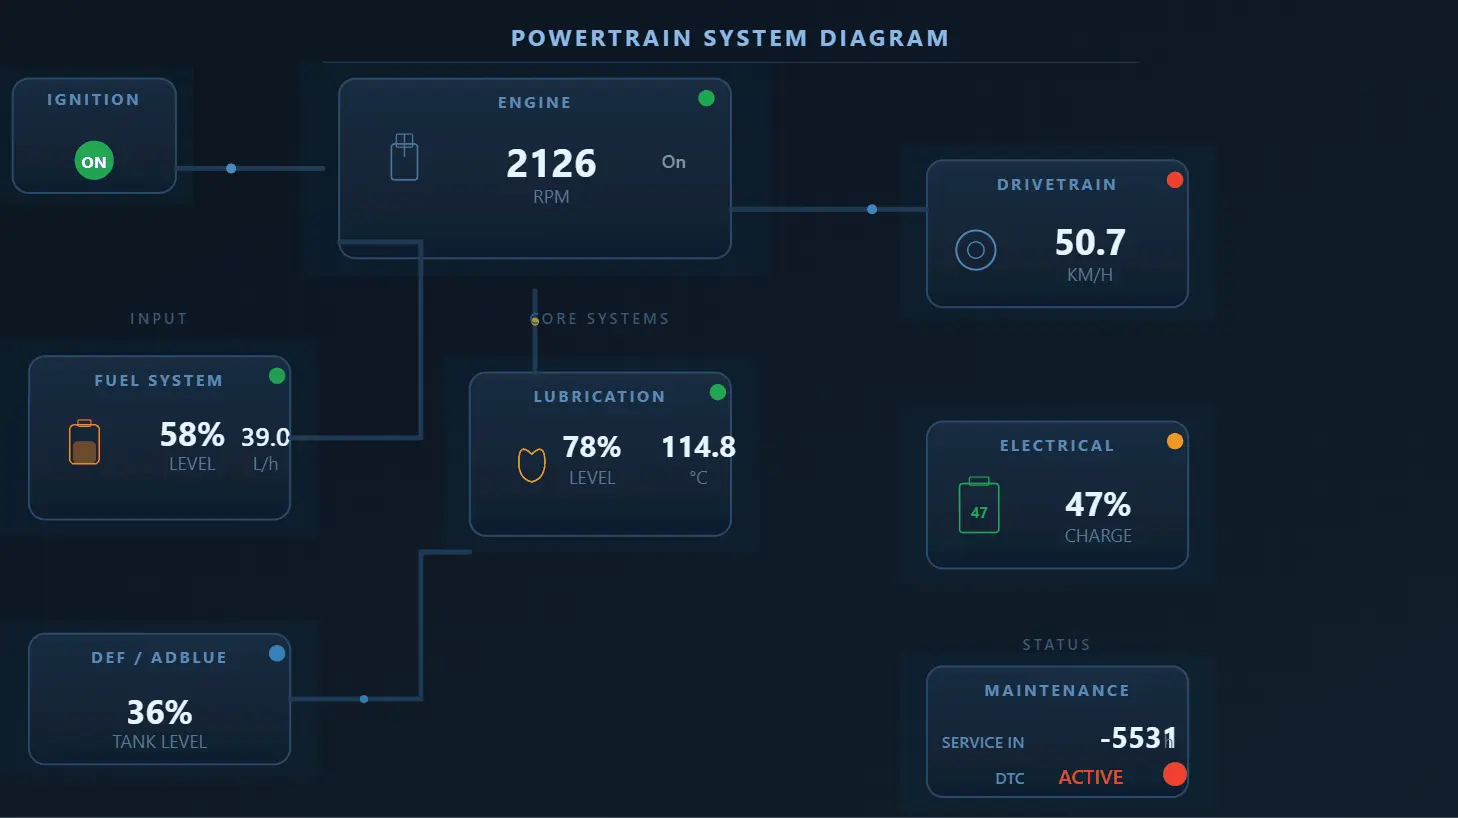
Note
This is an advanced widget that requires basic understanding of the SVG format. If you are not familiar with SVG creation refer to W3Schools` SVG basics for a general introduction.
Introduction SVG templates
Before connecting live data, the first step is to create a static SVG template using a vector graphics editor like Inkscape or a text editor. This base template defines the visual structure of your SCADA widget — including shapes, labels, and placeholders — and serves as the foundation for later data binding.
To get started, proceed as follows:
- Design your template with standard SVG elements (e.g.
<rect>,<circle>,<text>). - Save the file as plain SVG.
- Ensure that your SVG file contains a root
<svg>tag with thexmlns="http://www.w3.org/2000/svg"namespace, aviewBoxattribute for proper scaling, andwidth="100%"andheight="100%"for full responsiveness.
Save this base SVG template and open it in a text editor or a vector graphics tool to view and edit the source code.
This file includes a simple tank layout with placeholders for dynamic fill level and labels.
Replace your.signal.key with your actual signal values.
Once your base layout is ready, you can add dynamic behavior using the SCADA-specific bindings described below.
SVG template Structure
An SVG template consists of standard XML-based graphical elements such as:
- Shapes:
<rect>,<circle>,<path> - Text:
<text> - Containers:
<g>(group),<defs>,<clipPath>, etc.
Their appearance is controlled via attributes like x, y, width, height, fill, stroke, and transform.
To make templates dynamic, SCADA bindings are applied using:
data-attr-* attributesfor binding graphical properties- Angular-style {{ ... }} interpolations for inserting live signal values
Only a defined set of attributes is supported for data binding for safety and performance reasons.
The supported attributes are:
| Attribute | Description |
|---|---|
height |
Sets the vertical size of the element. Typically used with <rect>. |
width |
Sets the horizontal size of the element. Typically used with <rect>. |
fill |
Defines the fill color of the shape. Supports dynamic color changes. |
stroke-dashoffset |
Controls dash offset for stroked paths, often used for animated effects. |
from |
Starting value for an animation (used in <animateTransform>). |
to |
Ending value for an animation (used in <animateTransform>). |
x |
X-axis position of the element (e.g., <rect>, <text>). |
y |
Y-axis position of the element (e.g., <rect>, <text>). |
transform |
Applies transformations like rotate, scale, translate, or skew. |
Use these bindings to connect live signal data — such as speed, fuel level, or state — to visual components that update automatically.
For more information refer to SVG Validation and Configuring Signal Visualization.
Configuring Signal Visualization
All signals accessible on the machine specified in the widget are available under data ['signal.key'].
The following table lists the properties representing the current state of each signal available in the template.
| Property | Description | Example |
|---|---|---|
.value |
Raw numeric value. | 1200 |
.formattedValue |
Formatted and converted value string, ready for display (e.g., with unit suffix and number formatting). | "1.200" |
.signalLabel |
Signal’s descriptive label. | "Engine Speed" |
.unitLabel |
Unit of measurement label. | "RPM" |
.mappedValue |
State signal’s mapped label from the states object. Labels have to be mapped to state values. | "Running" |
.states[...] |
Lookup table converting numeric state codes to human-readable state labels. | 0 → "Stopped" |
The following example snippets illustrate how to create valid and responsive SVG templates for SCADA widgets, including dynamic data bindings, conditional rendering, live signal value display, and state-based formatting.
Bind Shape Attributes to Data
Use the data-attr-* syntax to bind SVG shape attributes to dynamic signal values.
Basic Example: Bind the height of a rectangle to the engine speed:
<rect x="10" y="10" width="50" data-attr-height="data['value.common.engine.speed'].value" />
Using Curly Brackets for Expressions
You can also use curly brackets.
<rect x="10" y="10" width="50" data-attr-height="{{data['value.common.engine.speed'].value}}" />
Example: Vertical Tank Level Visualization
<!-- Vertical Level Tank -->
<svg xmlns="http://www.w3.org/2000/svg" viewBox="0 0 120 220" width="100%" height="100%">

    <!-- animated water group -->
    <g id="water">
        <clipPath id="tankClip">
            <rect x="20" y="20" width="80" height="160" rx="6" ry="6" />
        </clipPath>
        <g clip-path="url(#tankClip)">
            <rect x="20" y="20" width="80" height="160" fill="#1e90ff" opacity="0.9"
                data-attr-transform="{{'translate(0,'+160 * (1 - data['value.common.engine.fuel.level'].value / 100) +')'}}">
                <animateTransform attributeName="transform" type="translate"
                    from="0,160"
                    data-attr-to="{{'0, '+160 * (1 - data['value.common.engine.fuel.level'].value / 100)}}"
                    dur="1s" fill="remove" />
            </rect>
        </g>
    </g>

    <!-- tank outline -->
    <rect x="20" y="20" width="80" height="160" rx="6" ry="6" fill="none" stroke="#aaa" stroke-width="3" />

    <!-- dynamic label and value -->
    <text x="60" y="200" text-anchor="middle">
        {{data['value.common.engine.fuel.level'].formattedValue}} {{data['value.common.engine.fuel.level'].unitLabel}}
    </text>
    <text x="60" y="215" text-anchor="middle">
        {{data['value.common.engine.fuel.level'].signalLabel}}
    </text>
</svg>
In this example, the fill level of a vertical tank dynamically reflects the value of the value.common.fuel.level signal.
The tank is clipped using an SVG clipPath, and its vertical position is animated smoothly using animateTransform.
clipPath is used here to visually constrain the animated fill level to the tank shape, ensuring it doesn't overflow the graphic boundaries.
This technique is especially useful for simulating tanks, progress bars, or other indicators with visual limits.
Using Conditional Expressions
<rect x="10" y="10" width="50" data-attr-height="data['value.common.engine.speed'].value > 50 ? 100 : 30" />
100 if the engine speed is greater than 50; otherwise, it sets it to 30.
Example: String Concatenation in Animations
To modify the to attribute of an animateTransform element using concatenation, standard JavaScript string concatenation is used to build the value.
<animateTransform
attributeName="transform"
attributeType="XML"
type="rotate"
from="0 346.08453 136.86678"
data-attr-to="{{(data['value.common.machine.speed'].value * 2) + ' 346.08453 136.86678' }}"
dur="1s"
fill="freeze"
/>
| Attribute / Expression | Description | Example / Output |
|---|---|---|
attributeName="transform" |
Specifies the attribute to animate. | transform |
attributeType="XML" |
Standard SVG attribute type. | XML |
type="rotate" |
Indicates the transformation type. | rotate |
from="0 346.08453 136.86678" |
Animation starts at 0° rotation around a specific point. | Rotation origin: (346.08453, 136.86678) |
data-attr-to="{{; (data['value.common.machine.speed'].value * 2) + ' 346.08453 136.86678' }}" |
Dynamic target rotation angle and pivot point, built using data and string concatenation. | e.g. "120 346.08453 136.86678" |
data['value.common.machine.speed'].value |
Retrieves the machine speed from the data source. | e.g. 60 |
* 2 |
Scales the speed value to define rotation angle. | 60 * 2 = 120 |
+ ' 346.08453 136.86678' |
Concatenates the pivot point as a string to complete the value. | '120 346.08453 136.86678' |
dur="1s" |
Duration of the animation. | 1s |
fill="freeze" |
Freezes the final state after the animation completes. | Final state remains visible |
Display Signal Values
To display live signal values, use curly brackets {{ ... }} inside <text> elements, ideal for formatted, human-readable output.
Example: Display formatted engine speed
<text x="70" y="30">
  {{data['value.common.engine.speed'].formattedValue}}
</text>
| Element | Description |
|---|---|
{{ ... }} |
Template syntax to insert dynamic data into text elements. |
data['engine.speed'] |
Accesses the signal object for engine speed. |
formattedValue |
Returns the signal’s current value, converted into the user's selected unit system and formatted according to the signal's format attribute (e.g. number format, unit suffix). |
Display Signal Labels and Units
Combine signal label and unit inside <text> elements using data bindings for clarity.
Example:
<text x="70" y="50">
  {{data['value.common.engine.speed'].signalLabel}} ({{data['value.common.engine.speed'].unitLabel}})
</text>
| Property | Description |
|---|---|
signalLabel |
The descriptive name of the signal (e.g., "Engine Speed"). |
unitLabel |
The unit of measurement for the signal (e.g., "RPM"). |
Use Mapped Values
For state signals, display the label matching the current state value.
Example:
<text x="100" y="70">
  {{data['value.common.engine.state'].mappedValue}}
</text>
This shows the mapped label corresponding to the current state.
The example above shows the full functionality of mappedValue.
However, it's also possible to display static states directly or to show the value of any other state — even if it’s not currently active.
Use State Lookups
If the signal uses numeric codes to represent states, convert these codes into human-readable labels by indexing the states list with the current value.
Example:
<text x="100" y="90">
  {{data['value.common.engine.state'].states[0]}}
</text>
Workflow after SVG Creation
When uploading a valid, data-enabled SVG file to the DataPortal (refer to section Configuration in DataPortal) the system scans the markup and attempts to match it with available signals. Once a successful match is found, a preview of the uploaded SVG is shown along with a table listing all identified signals in both the SVG markup and the machine (or signal catalog). This allows users to verify correct rendering within the widget.
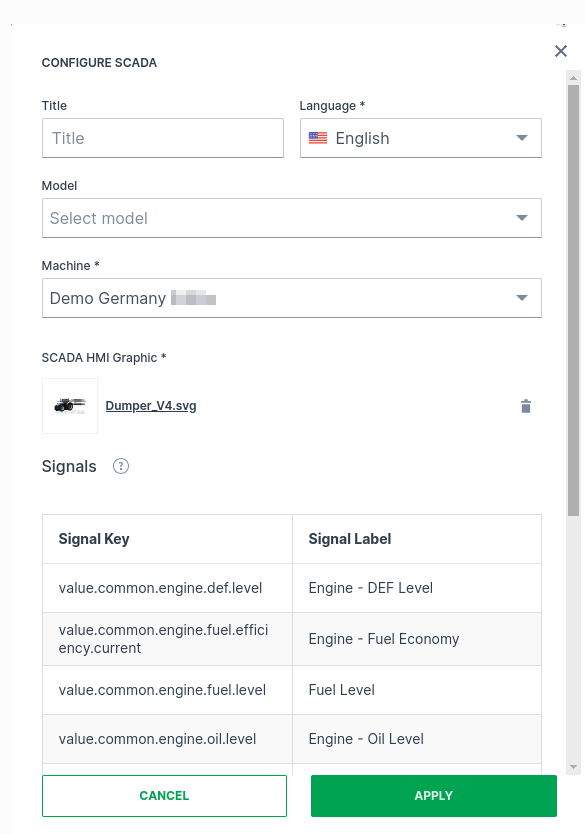
After clicking Apply, the widget displays the SVG with all signal placeholders replaced by live measurement values from the selected machine.
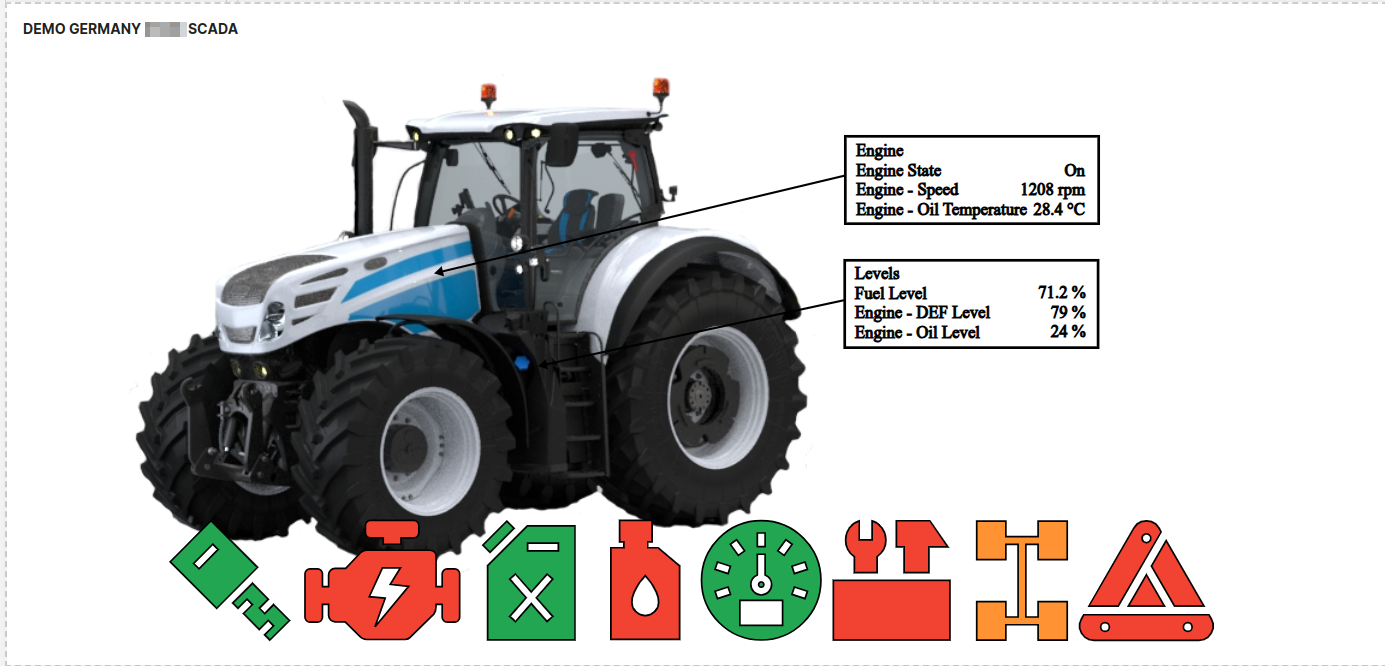
By pressing the Refresh button in the top-right corner, users can see the widget update automatically as new signal data becomes available. To stop the refresh of the dashboard click the Refresh button again.
Save this advanced example SVG file of the displayed tractor image and open it in a text editor or vector graphics tool to view and edit the source code. The provided SVG demonstrates a more complex SCADA visualization and was created in Inkscape, which adds editor-specific metadata and attributes. It requires a solid understanding of SVG structure and Inkscape’s features.
SVG Validation
A set of SVG validations ensures the SCADA widget behaves correctly. Error messages appear during image upload or in existing widgets when issues are detected.
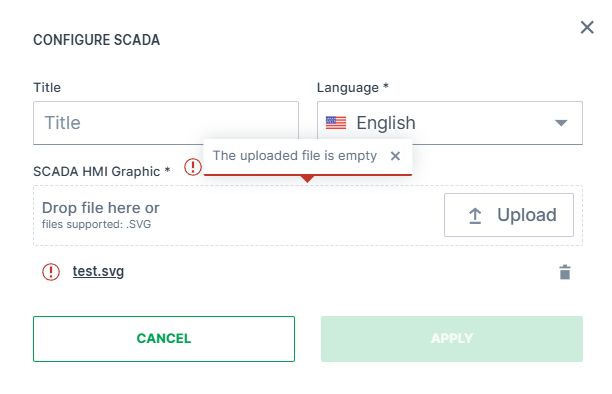
| Validation | Description | Error Message Example |
|---|---|---|
| SVG validity | SVG must be valid and well-formed. An error appears if the file is empty or not a valid SVG. | The uploaded file is empty. The uploaded file is not a valid SVG format. |
Root <svg>element |
The file must contain a single root <svg>. |
The uploaded file is not a valid SVG format. |
Namespace (xmlns) |
The SVG element must declare the standard XML namespace: xmlns="http://www.w3.org/2000/svg". | The uploaded file is not a valid SVG format. |
| HTML entities | Special characters in attribute expressions (e.g. >) must be escaped (>) to remain valid XML. |
The uploaded file is not a valid SVG format. |
| Invalid markup | Errors occur if tags are improperly closed or malformed, e.g., <svg><rect><text>test</rect></svg> (missing closing <text>). |
Invalid SVG markup detected: This page contains the following errors: error on line 538 at column 125 attribute construct error. Below is a rendering of the page up to the first error. |
| Required attributes | All SVGs must include width="100%", height="100%", and a viewBox attribute to ensure full responsiveness and proper scaling of the widget. Missing any will trigger an error. |
The SVG must include a viewBox attribute for proper scaling and positioning. |
| Signal key validation | Errors specify missing or invalid signal keys not found on the machine or in the signal catalog. | There is a mismatch between the configured signals and the ones listed in your SVG template. value.custom.dtc.boom, value.common.engine.fuel.efficiency.future were not found on your machine. |
| No signal keys used | An error is raised if no signal keys are found, as the widget would be non-functional. | No valid signal keys were found in the uploaded SVG. |
These validations also apply to widgets already added. If a configured signal is removed or lost, the corresponding validation errors will appear directly in the widget.
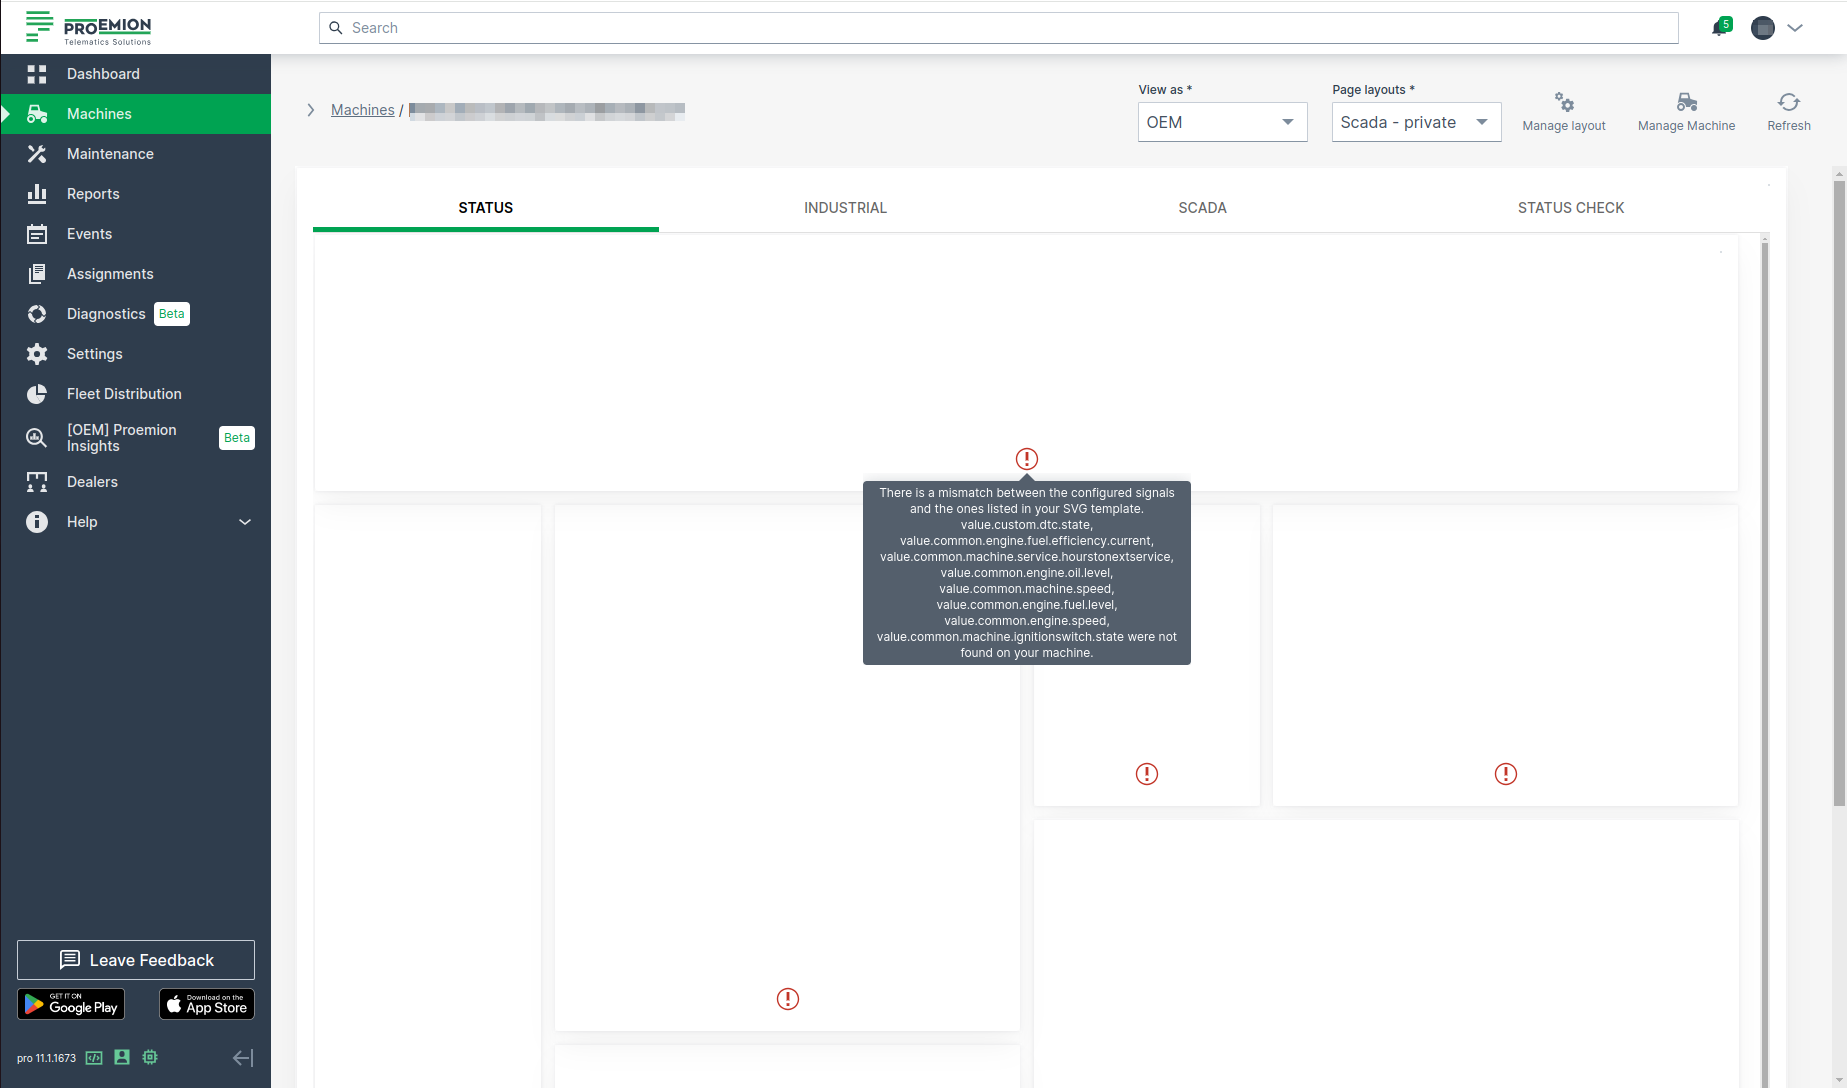
Configuration in DataPortal
Configure the widget and put it on the Organization Dashboard and/or the Model Dashboard by following the steps below:
- For Organization Dashboards, the matching is performed against the signals of the selected machine.
- For Model Dashboards, the system searches across the entire signal catalog.
This broader search ensures compatibility, as machine dashboards can be reassigned to different machine models that may not support the originally configured signals.
It is highly recommended to adapt a Machine Page (Model Dashboard) centrally via the Machine Page Layout. If you need to configure the Machine Page for the selected machine only, proceed as follows:
-
In the selected Machine Page, select Manage Layout > Add widgets.
-
Select the desired widget. A preview will be shown.
-
Click Apply. This forwards you to the widget configuration dialog with the options described below.
If you need to adapt the Organization Dashboard, select the desired dashboard configuration and click Edit > Add to open the widgets catalog, see also Add Widgets to the Organization Dashboard.
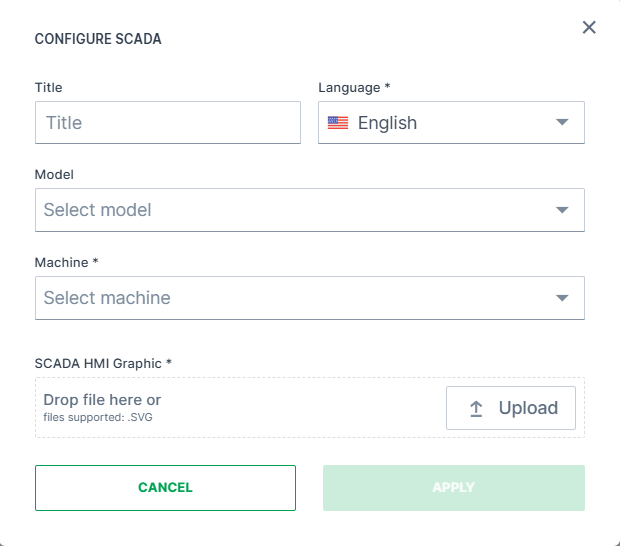
| Item | Description |
|---|---|
| Title | The label for the widget (English is the default, additional languages must be configured). |
| Language | Select the language for the title of the widget. |
| Model* | Model name. |
| Machine* | Machine name. |
| SCADA HMI Graphic | Upload SVG image. |
*These config options can only be selected from the Organization Dashboard. When configuring the widget, the user must select a machine if the widget is being added to a Organization Dashboard. For Model Dashboards, no selection is necessary, as the machine context is automatically derived.
Signal List
The Signal List widget allows you to display all signals used by the machine and export them.
Consider the Signal List shows only signals with data.
Note that there is also the Signal State widget.
Configuration
The Signal List is always auto-refreshed.
The widget is available for the Model Dashboard.
It is highly recommended to adapt a Machine Page (Model Dashboard) centrally via the Machine Page Layout. If you need to configure the Machine Page for the selected machine only, proceed as follows:
-
In the selected Machine Page, select Manage Layout > Add widgets.
-
Select the desired widget. A preview will be shown.
-
Click Apply. This forwards you to the widget configuration dialog with the options described below.
If you need to adapt the Organization Dashboard, select the desired dashboard configuration and click Edit > Add to open the widgets catalog, see also Add Widgets to the Organization Dashboard.
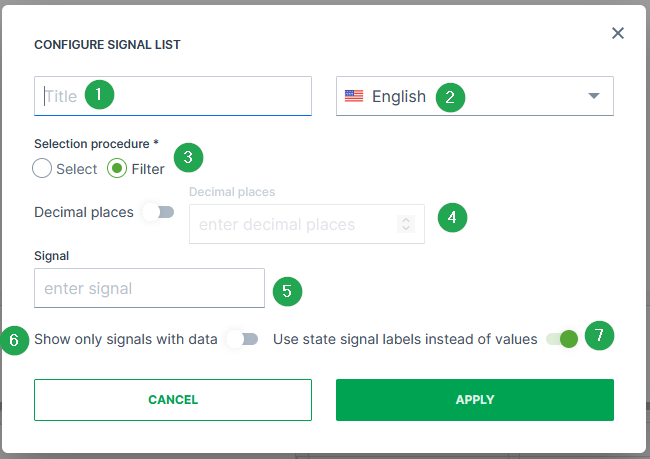
| # | Item | Description |
|---|---|---|
| 1 | Title | The label for the widget (English is the default, additional languages must be configured. See Language below). |
| 2 | Language1 | Select the language for the title of the widget. |
| 3 | Selection procedure | Choose how the selection of the signals should take place that will be done in the field Signal (see item "5"). - Either via Select to separately selecting the specific signals. 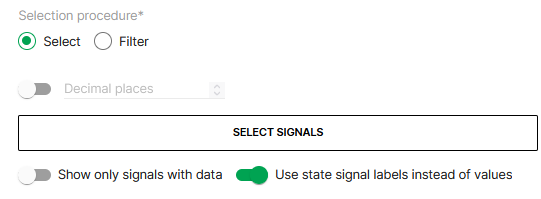 - Or via Filter to type in specific signal keys for application. |
| 4 | Decimal places | Select how many decimal places should be displayed for the signal values, if applicable. |
| 5 | Signal selection field | Depending on the selection procedure, a list to select specific signals will be displayed, see following image, or a field to enter the signals, see image above. 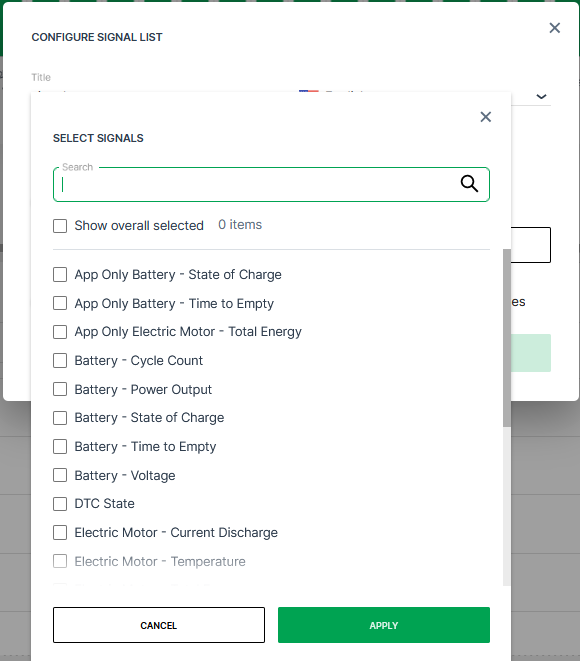 |
| 6 | Show only signals with data | Select whether signals without data/values should also be displayed in the Signal List. |
| 7 | Show state-signal labels instead of values2 | Refer to Signal Labels. |
Sample
After configuring the Signal List widget, the signals will be displayed in a table with the following columns, see also image below:
-
Signal
-
Last updated
-
Value
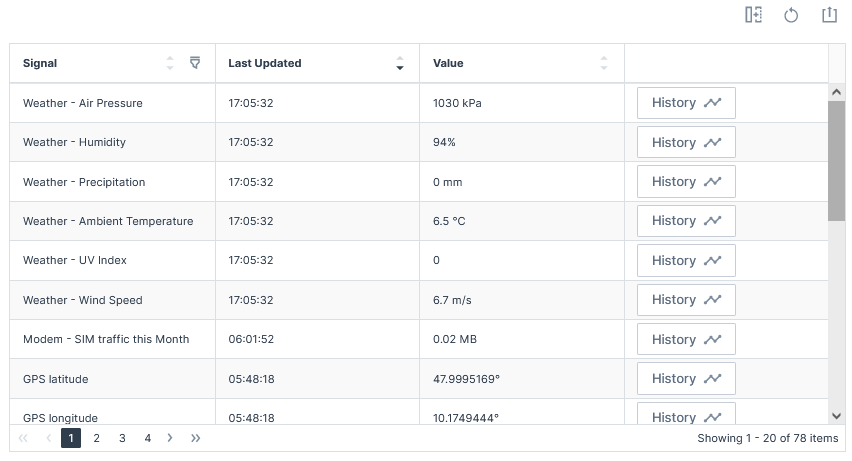
For information on how to adapt the table view, see Table Options. For information on how to export this table with the included columns, see Export Table.
Signal State
The Signal State widget allows you to display different signal values as states on a single widget. You can also display the signal state change history in a table.
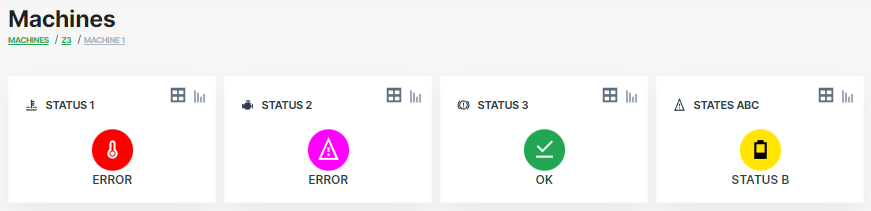
Configuration
The widget is available both for the Organization Dashboard and the Model Dashboard.
It is highly recommended to adapt a Machine Page (Model Dashboard) centrally via the Machine Page Layout. If you need to configure the Machine Page for the selected machine only, proceed as follows:
-
In the selected Machine Page, select Manage Layout > Add widgets.
-
Select the desired widget. A preview will be shown.
-
Click Apply. This forwards you to the widget configuration dialog with the options described below.
If you need to adapt the Organization Dashboard, select the desired dashboard configuration and click Edit > Add to open the widgets catalog, see also Add Widgets to the Organization Dashboard.
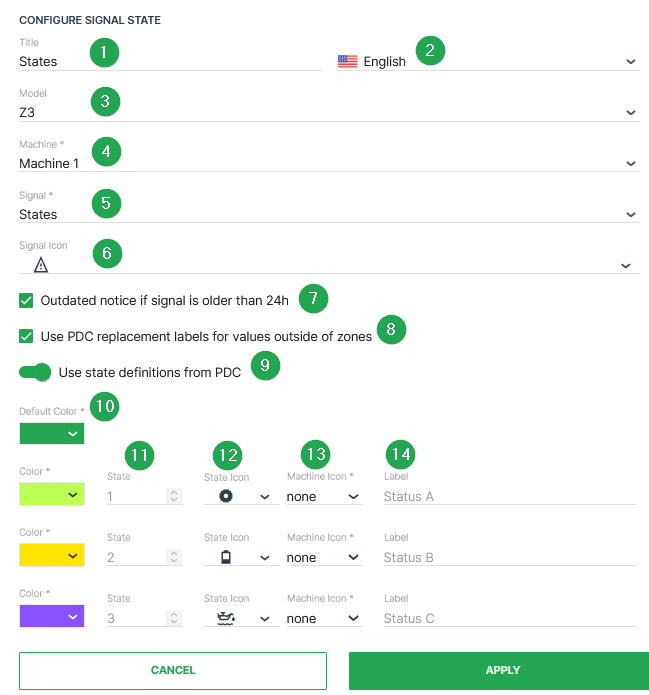
| # | Item | Description |
|---|---|---|
| 1 | Title | The label for the widget (English is the default, additional languages must be configured. See Language below). |
| 2 | Language1 | Select the language for the title of the widget. |
| 3 | Model2 | The model of the machine you select to display the state. |
| 4 | Machine2 | The machine that you select to display the state. |
| 5 | Signal | Select the signal to be displayed. |
| 6 | Signal Icon | Select the icon to represent the signal from the available options. |
| - | Show button3 to see Signal history table | Display the signal value history including value, description and time of change. |
| 7 | Outdated notice if signal is older than 24h | If the current signal state is older than 24 hours the notice is displayed. |
| 8 | Use PDC replacement4 labels for values outside of zones | If enabled, a non-defined state is replaced by the text which is configured in the conditional replacement from the PDC View Definition. |
| 9 | Use state definitions[^5] from PDC | With this option enabled, the configured states from the PDC Value Definition are used. |
| 10 | Color | Select the color to represent the signal in the widget. |
| 11 | State | Original state value from device in binary or numeric format. |
| 12 | State Icon | Select the icon to represent the signal from the available options. |
| 13 | Machine Icon | Optional the machine icon can be also displayed below the state icon. |
| 14 | Label | Defines the string that should be used in place of the numerical value. |
| - | Language1 | Select the language for the label of the signal state. |
[^5] The Use state definitions from PDC option is the recommended method to translate boolean or numeric values into text. The advantage is that the PDC state definition can be also used for other widget layouts without any further efforts regarding the label's configuration. Please be aware that this option is only available when the assigned PDC has states defined according to PDC Value Definition.
The Signal Icon and State Icon have a set of icons available that you can choose to represent the signal or state.
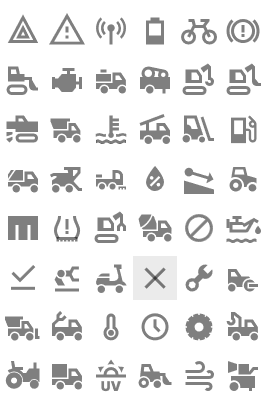
Sample
Selecting the Report ![]() icon you are brought to the Report Chart which displays the trends over time for this signal.
icon you are brought to the Report Chart which displays the trends over time for this signal.
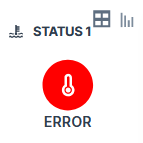
Selecting the History Table  icon you are forwarded to the signal history which displays all signal values received by the DataPortal.
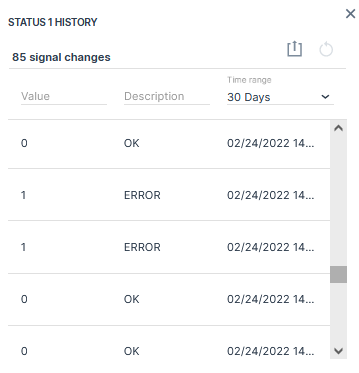
-
Individual labels for the available languages of your DataPortal account can be configured. Please also note: When using the state definition from the PDC, the state labels for each language are used from the PDC and the language option for the state labels is hidden within the signal state configuration dialog. ↩↩
-
This option can only be selected when configuring the state widget at the DataPortal fleet dashboard. ↩↩
-
The Show button to see Signal history table option can only be selected for a single machine within the model based dashboard. ↩
-
This option is only working when conditional replacement is configured in the PDC View Definition. ↩
Slices
The Slices widget allows you to monitor several signal levels or usage for a specific period of time in form of a Donut or Pie chart.
Configuration
Configure the widget and put it on the Organization Dashboard and/or the Model Dashboard by following the steps below:
It is highly recommended to adapt a Machine Page (Model Dashboard) centrally via the Machine Page Layout. If you need to configure the Machine Page for the selected machine only, proceed as follows:
-
In the selected Machine Page, select Manage Layout > Add widgets.
-
Select the desired widget. A preview will be shown.
-
Click Apply. This forwards you to the widget configuration dialog with the options described below.
If you need to adapt the Organization Dashboard, select the desired dashboard configuration and click Edit > Add to open the widgets catalog, see also Add Widgets to the Organization Dashboard.
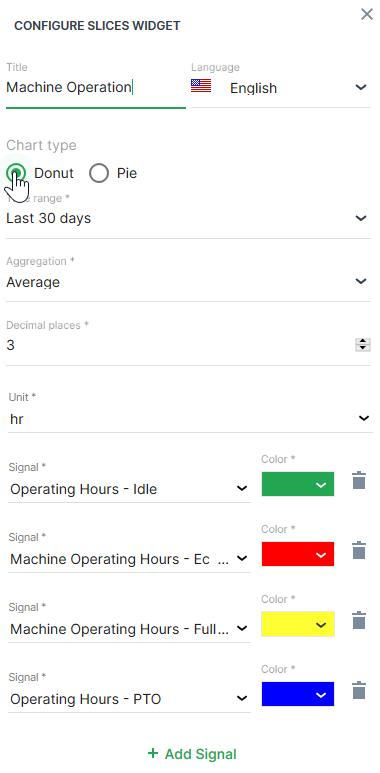
| Item | Description |
|---|---|
| Title | The label for the widget (English is the default, additional languages must be configured. See Language below). |
| Language | Select the language for the title of the widget. |
| Model | Model name |
| Machine | Machine name |
| Chart type | Select either Donut or Pie chart. |
| Time | Select a predefined, relative time range, e.g. Last 24 hours or select a custom one, e.g. This last 5 Days, see Time selection. |
| Aggregation | The value returned for the signal, calculated using all the measurements within each Bucket. |
| Decimal places | Select the number of decimal places for the value. |
| Units | Entity used for measurement such as V (voltage), % (percentage) and so on. |
| Signal | Select the signal to be displayed. |
| Color | Select the color to represent the signal in the chart. |
Sample
Suggested Usage: Use it for multiple signals that sum up to a total.
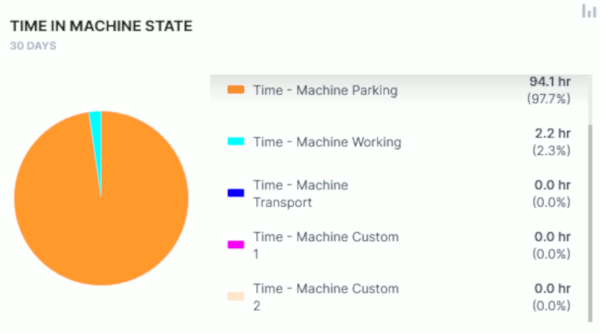
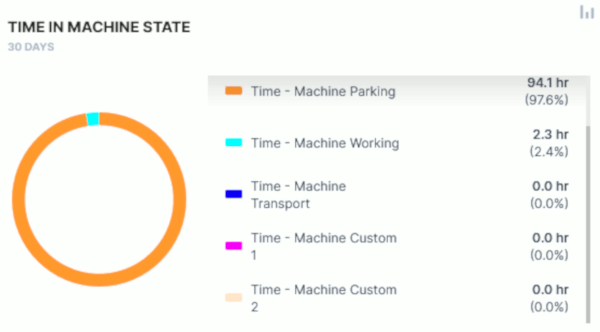
Tab Container
The Tab Container widget organizes your dashboard by grouping widgets by tabs. You can add multiple tabs along with a label for each and designate one tab as the default.
Each tab can contain widgets and you can configure the header orientation (left, right, or center) and position.
Configuration
Configure the widget and put it on the Organization Dashboard and/or the Model Dashboard by following the steps below:
It is highly recommended to adapt a Machine Page (Model Dashboard) centrally via the Machine Page Layout. If you need to configure the Machine Page for the selected machine only, proceed as follows:
-
In the selected Machine Page, select Manage Layout > Add widgets.
-
Select the desired widget. A preview will be shown.
-
Click Apply. This forwards you to the widget configuration dialog with the options described below.
If you need to adapt the Organization Dashboard, select the desired dashboard configuration and click Edit > Add to open the widgets catalog, see also Add Widgets to the Organization Dashboard.
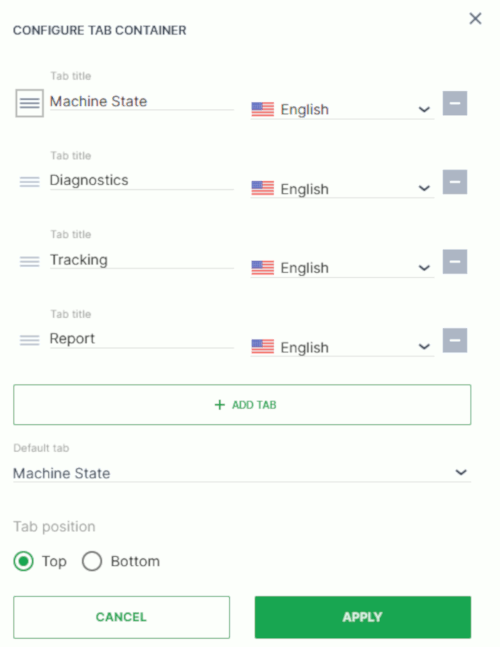
| Item | Description |
|---|---|
| Tab title | Give each tab a distinct name that identifies its contents. |
| Language | Select the language for the tab title. |
| Add Tab | Place additional tabs into the organizer. |
| Default Tab | Select the tab that will be displayed when the page loads. |
| Tab Position | Display the tab above or below the widget title. |
Add Widgets to the Container
Once you have created the Tab Container and placed it on the dashboard, you can add widgets to the current tab
In the layout:
-
Select Edit.
-
Select the Add icon
 on the container to add the selected widget to the container.
 -
Add and configure the widget as you would on the dashboard or the machine details page.
-
Save the widget/changes in the container tab.
-
Save the Organization Dashboard/Model Dashboard.
Model-Based Tab Visibility
In Fleet Dashboards, tabs can optionally be bound to specific machine models, enabling users to see only relevant tabs and keeping dashboards clear even in mixed-model fleets.
If one or more models are assigned to a tab, the tab is displayed only if:
-
a model is assigned to the tab, and
-
the current user can see at least one machine that belongs to one of the assigned models within the organization tree.
Tabs not assigned to any model remain visible and are not filtered by model-based rules.
Note
This feature applies only to Fleet Dashboards. It does not apply to Model Dashboards.
Example
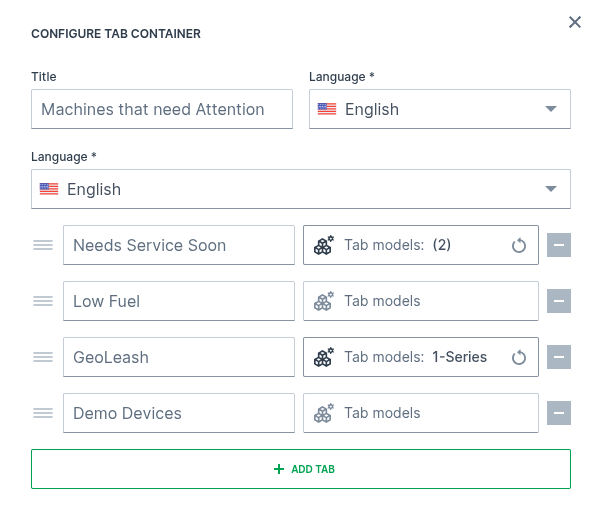
Machines Overview
Machines Overview
The Machines Overview is the central place for managing specific machines on different views.
The machines can be displayed in map that allows to zoom-in and-out and gives a quick description of the machines whn hovering over.
The machines can be also displayed in a table/list view to have a clear structure of the available machines.
By default, the Machines overview offers the 3 views: List view, Map view and Split view on all machines visible to the user. You can disable the possibility to select the Map view via Settings > Portal Appearance > Theme > Behavior Options.
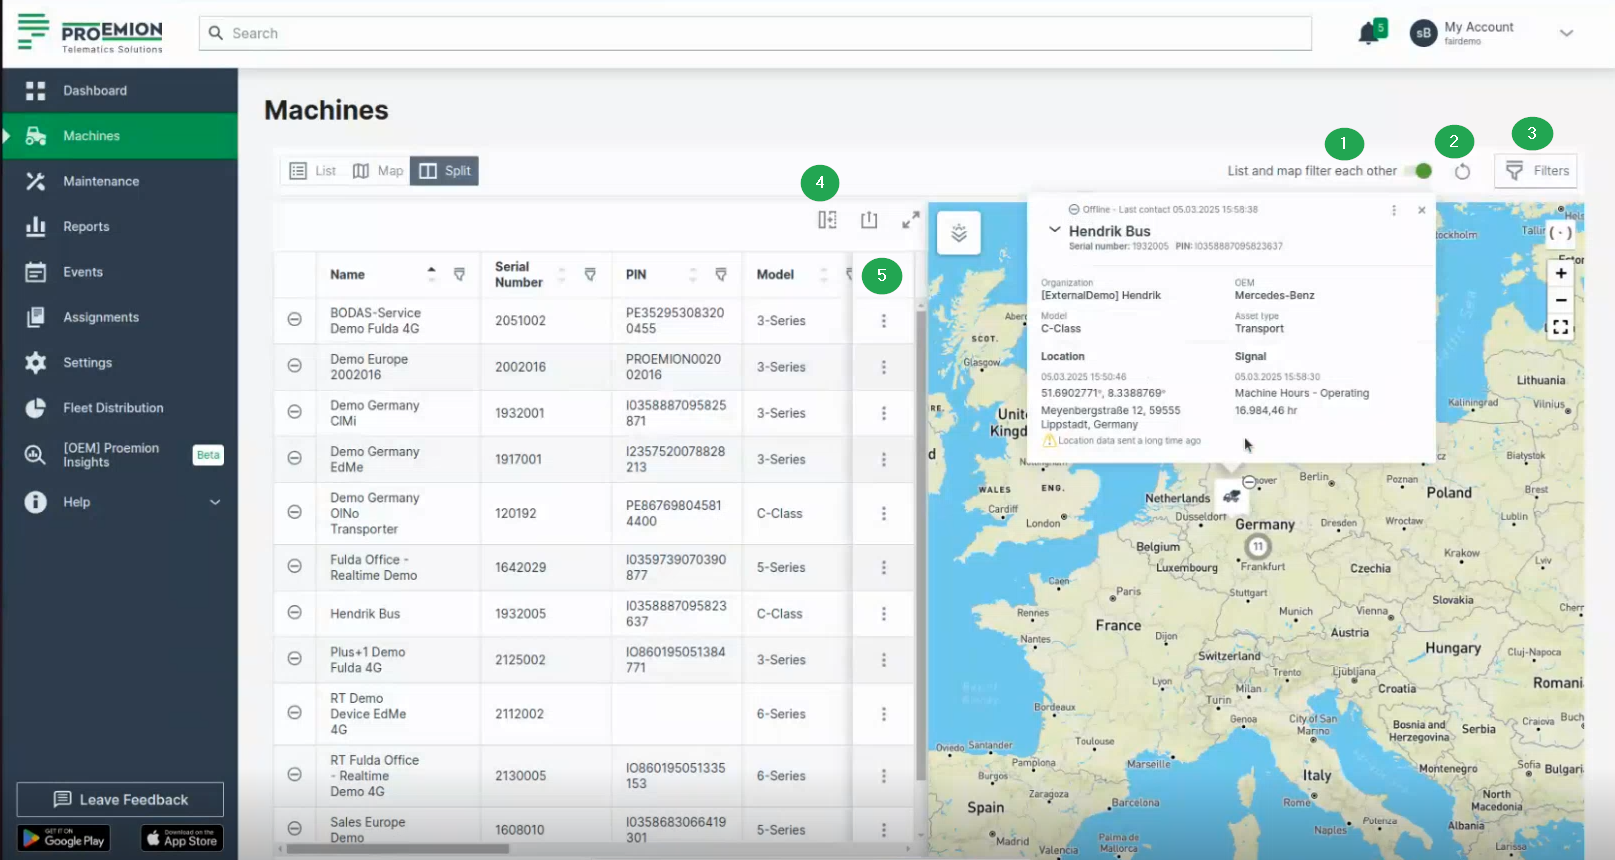
The filters are offered for both map and list view to display only the desired machines, e.g. online/offline, filter by certain states, etc., see the following filters and options:
- (1) List and map filter each other
- (2) Reset icon
- (3) Filters
- (4) Table options (available for the list view only)
- (5) 3-dots (available for the list view only)
Options & Filters
(1) List and map filter each other
The "List and map filter each other" option is to be found on the Machines Overview.

Active by default.
By switching off this option, the map and list are not linked and can be used independently. That means, you can filter the list by its columns, but the map won't be filtered by the machines filtered in the list; or you can zoom in the map, but the list won't be filtered by the machines visible on the map.
(2) Reset icon
The "Reset" icon/option is to be found on the Machines Overview.
Use the Reset icon to globally reset both Map and List views to default state or to reset filters only.
(3) Filters
The filters are to be found on the Machines Overview

Filter the machines in both the map and list view simultaneously by the following options:
-
Connection status, e.g. online status. Includes devices with <
>. -
Maintenance status, e.g. upcoming and/or overdue maintenance statuses. When selecting the Maintenance filter, the icons of the machines change in the map dependent on their maintenance status, e.g. "Upcoming" icon:
 or "Completed last week" icon:
  , etc.
Figure 2: upcoming icon -
Asset types; filter by the asset types assigned to the models.
(4) Table options
The table options are to be found on the Machines Overview.

Adapt the list and export it, see also Table Options.
The options regarding the table are available in List and Split view only.
(5) 3-dots
The 3-dots are to be found on the Machines Overview.
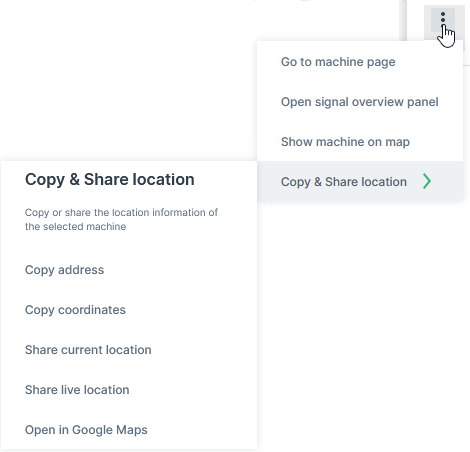
The drop-down menu can be opened via the 3-dots by the end of each row in both the List and Map views and offers the following options:
-
Go to Machine Page
-
Go to Maintenance Task (only in Map view; if the maintenance filter is applied).
-
Open Signals Overview Panel.
-
Show machine on map (only in List view) Zooms to the location of the machine on the map. This is option is useful when the option List and map filter each other is deselected (see (1) in Machines Overview).
-
Open in Google Maps. Opens Google Maps in a new tab with the static location/coordinates of the machine.
Tip
All filters and options applied (apart from visible columns) will be included in the URL.
Copy & Share location
The following location-related options can be used with permission set Location:Latest.
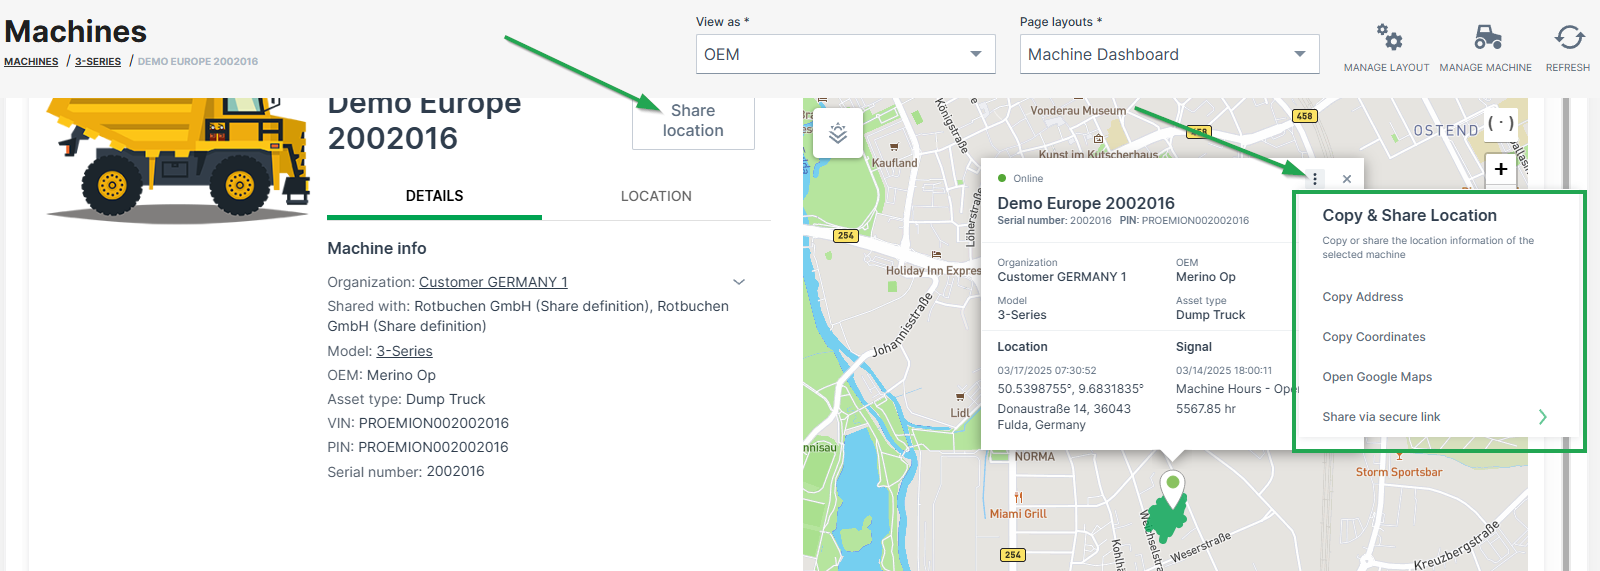
Copy address
Copies the machine address at the time the link was created, i.e. street name and number, zip code and city.
Copy coordinates
Copies the latitude and longitudes coordinates of the machine at the time the link was created.
Share static location and Share live location
The permission set Location:History is required instead Location:Latest to enable the following links.
-
Create a link to a web page/view on the static machine location at the time the link was created, or
-
Create a link to the live machine location.
The machine's live location is updated every 5 minutes by default as long as the link is valid, but stops the refresh if the machine is idling for 1 hour.
The links are accessible by users without DataPortal account and is valid for 48 hours. The number of shared links is displayed in the share dialog.
Note
A maximum of 5 links can be shared.
To create a shareable link, proceed as follows:
- Click Share location or the 3-dots in the map.
- Choose Share via secure link:
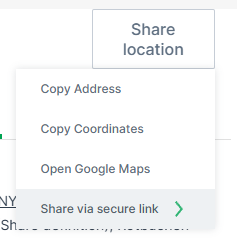
- Choose either Share static location and Share live location.
- Confirm with Create and copy link:
The link will be copied to the clipboard.
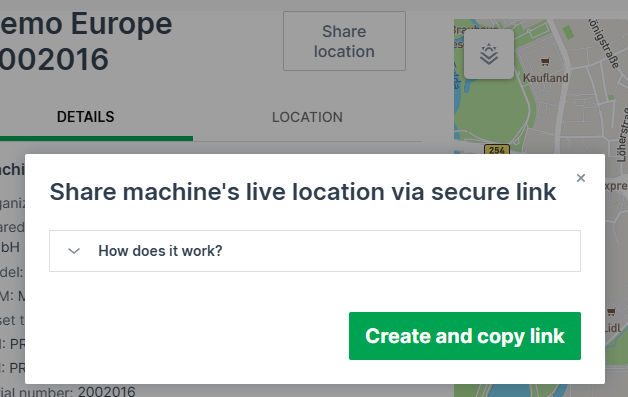
The shared page looks as follows:
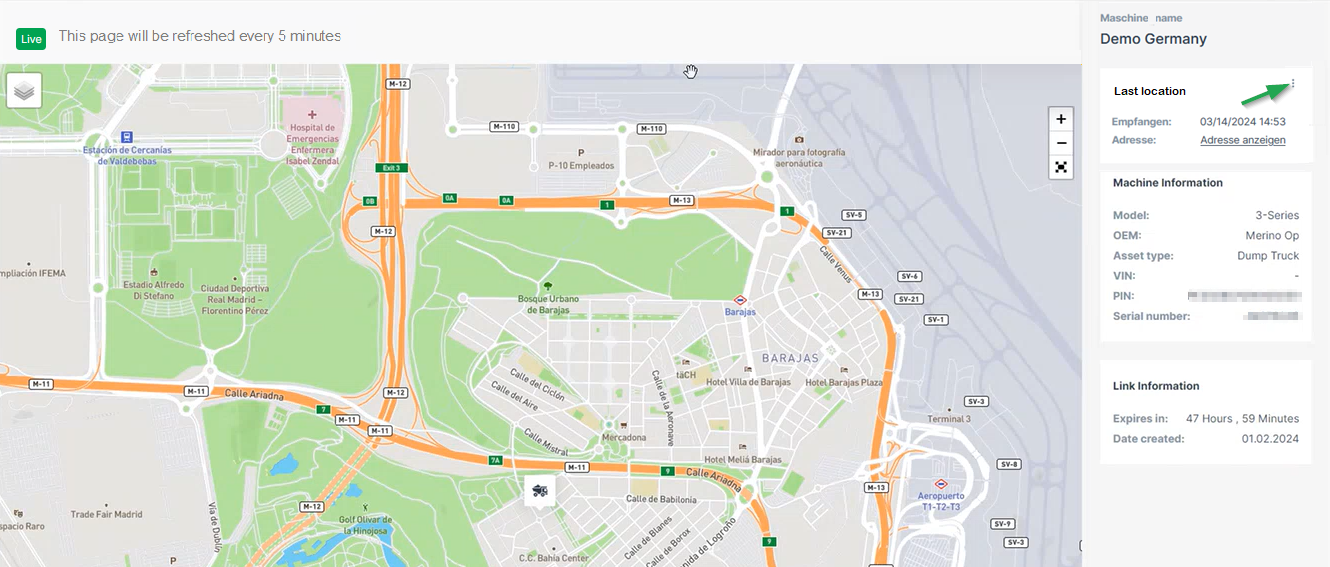
Note
Note that the page is displayed in the language of the browser when not logged in, otherwise it displays in the selected DataPortal language.
Note
You can open the live location in Google Maps via the 3-dots, see also (5) 3-dots.
Stop sharing location
You may stop the sharing of the location via the share dialog again. Consider the note:
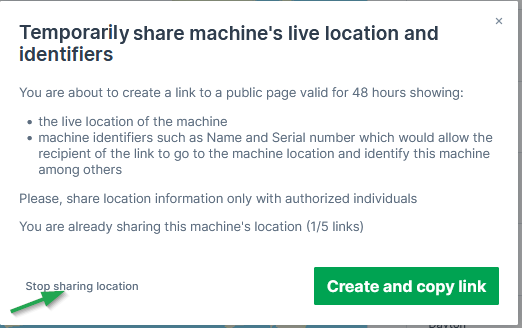
Map
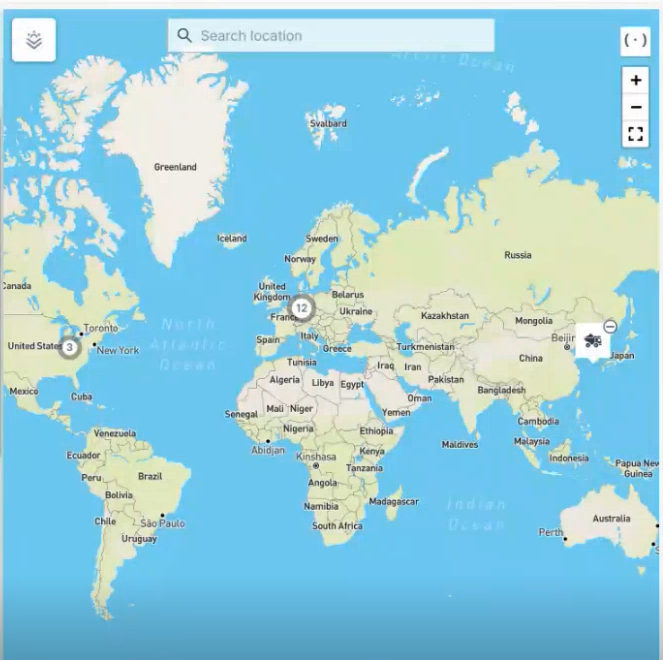
The map in the Machines Overview shows the most recent recorded positions of all machines. Machines that are located in close proximity to one another are grouped together and identified by a cluster symbol. Zooming in or selecting the symbol shows each individual machine.
Hovering over a machine on the map displays a pop-up with basic details for online and offline (showing "Last contact") machines:
Selecting the machine icon shows the view with the following details:
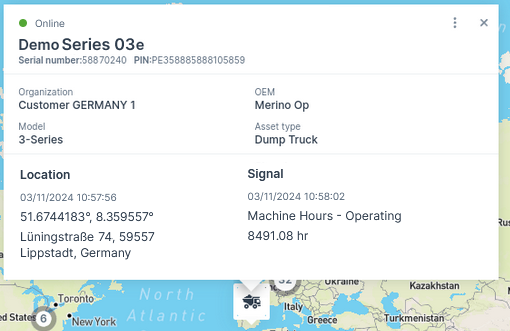
Note
You can view the map elements like country-, city names, etc. translated as per the language set in your account preferences.
Supported languages: English (also fallback language), German, French, Italian, Spanish, Korean, Japanese
-
Current connection status (online or Last contact (offline) 1)
-
Machine Name
-
Serial number/PIN
-
Organization
-
OEM name
-
Model
-
Asset type; if there is no asset type assigned to this model, the organization unit name is displayed instead
-
Location together with its last datapoint1
-
Signal (e.g. operating hours)
-
Date and time of the most recent status change
-
Maintenance status (if the maintenance filter is applied)
-
- Last contact shows the timestamp of the last time the CU contacted the DataPlatform, i.e. went online.
- Last datapoint shows the timestamp of the last datapoint, i.e. transmitted files or received machine signals, e.g. engine or location data. Note that certain signals don't update the Last Datapoint, see Proemion Standard Metrics → "Standard System Metrics".
List
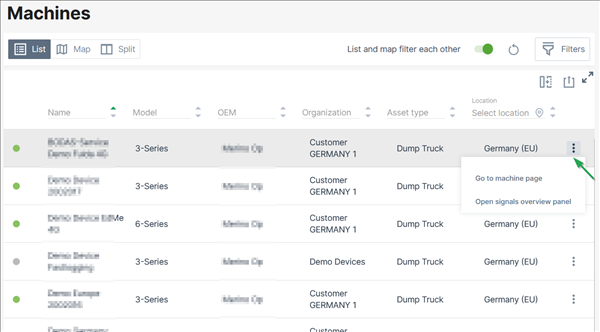
The machine list in the Machines Overview displays the following parameters in different columns:
-
Online state
-
Name
- VIN
- PIN
- Serial Number
- Model name
-
Organization unit name
-
Last contact1
-
Last datapoint1
- Maintenance Tasks status ("Upcoming", "Overdue", "Skipped last week", "Completed last week")
-
Asset type
-
Data Source (shows the CU type, CU model, and import source for identifying the machine data source, e.g. "Hardware Proemion CANlink mobile 3600")
-
By the end of each row, you find the drop-down menu via the three-dots with links as described in Machines Overview2.
For information on how to adapt or export the table view, see Table Options.
Note
Note that all columns will be exported.
-
Last contact shows the timestamp of the last time the CU contacted the DataPlatform, i.e. went online. Last datapoint shows the timestamp of the last datapoint, i.e. transmitted files or received machine signals, e.g. engine or location data. Note that certain signals don't update the Last Datapoint, see Proemion Standard Metrics → "Standard System Metrics". ↩↩
-
You can open the Machine Page by selecting an entry in the list or selecting the 3-dots by the end of the line of each machine. ↩
Machine Quick Look
The Machine Quick Look is an enhanced view in the sidebar on the most frequently requested signal reports and machine activities like operating hours and/or ignition state and also shows the machine properties.
The Machine Quick Look provides trends and summaries of the selected machine in addition to the latest values shown in the (Signal) List.
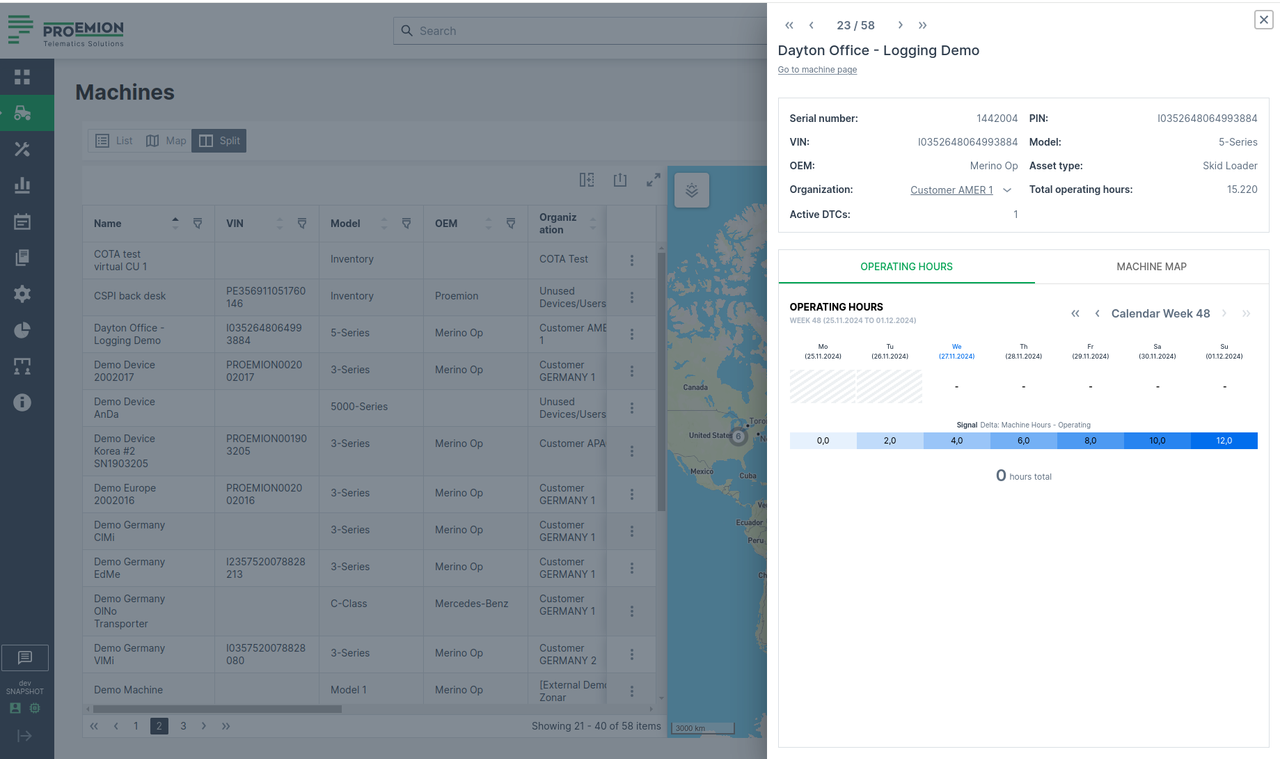
To open the Machine Quick Look sidebar, go to Machines Overview:
-
At the end of the line of the desired machine in the List view, you can select image:
> "Open machine quick look panel":
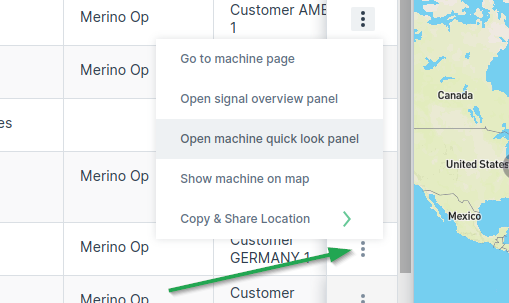
Figure 2: 3-dots -
You can also open the Machine Quick Look panel from the new quick look preview button when you hover over a machine row:
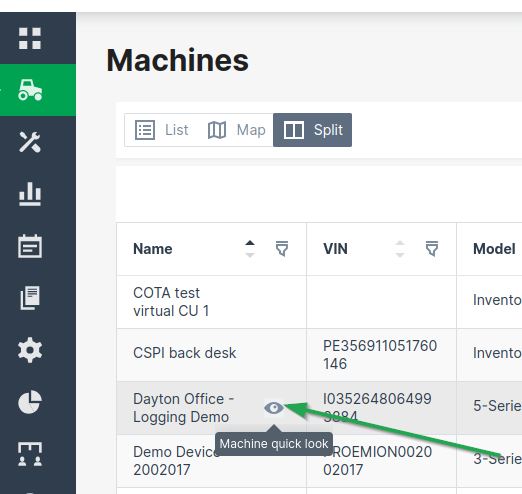
Figure 3: Machine Quick Look - Hover -
On the Map, find the desired machine and open the Machine Quick Look panel from the machine map tooltip.
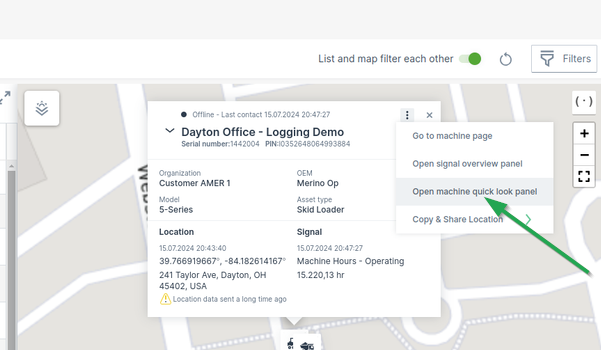
Figure 4: Machine Quick Look - Map
Signal Overview Panel
The Signals Overview Panel provides a quick overview of the machine’s current state and key measurements. It allows users to monitor real-time signals and assess the operational condition of the selected machine at a glance.
To open the Signals Overview Panel, you have two options:
-
In the Machine List, select the row of the desired machine.
-
In the Machines Overview, open the 3-dots menu at the end of the machine's row and select the option Open signal overview panel.
This will display detailed signal data for the selected machine in a sidebar panel on the right side of the DataPortal, see following Screenshot.
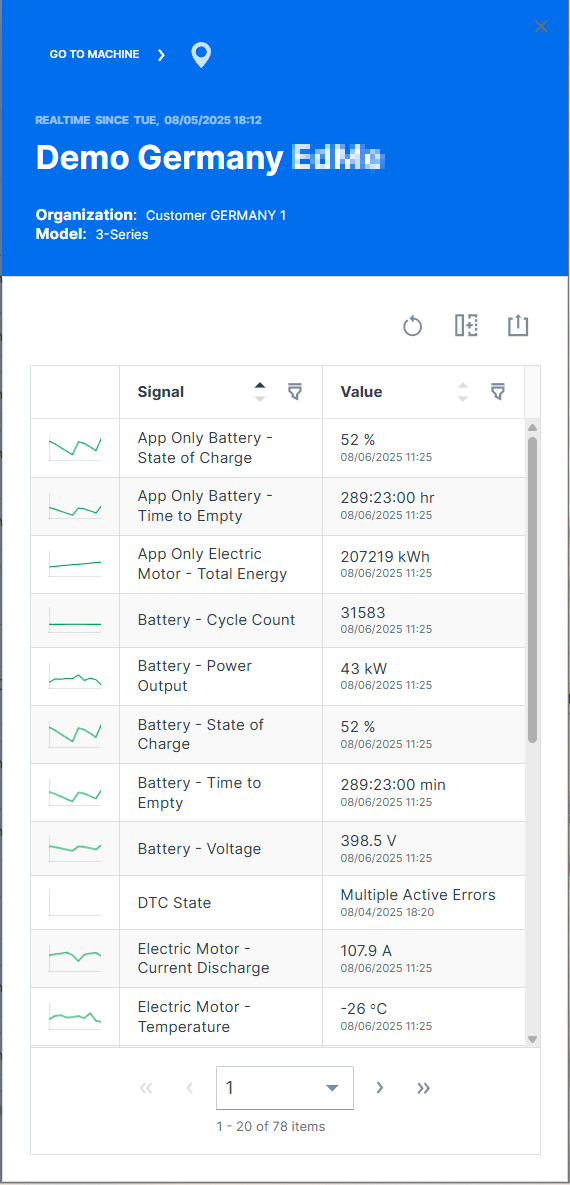
General machine information is displayed at the top of the panel:
-
Online / Offline state
-
gray background color indicates currently offline.
-
green or blue background color indicates currently online.
-
-
Time of most recent state change
-
Machine Name
-
Organization the machine belongs to
Click on GO TO MACHINE to open the Machine Page.
Click on the marker icon ![]() to zoom the map to the machine.
to zoom the map to the machine.
Unknown Machine Location
Machines with unknown locations are displayed in both map and table views as follows - irrespective of map interactions, e.g. using "List and map filter each other", or state changes, e.g. "online"/"offline":
-
List View: In the list view, filter for machines with an unknown location by selecting the "Unknown Location" filter. This will display a count directly in the list of how many machines lack location data. The filter is to be found in the column "Location"; if the column is not visible in the List/Table view, add it as described in (4) Table options above.
-
Map View: In the map view, it is not possible to render machines without a known location. Since these machines do not have associated geographic coordinates, they will not appear on the map. You will only see the count of these machines, which can be identified through the list view.
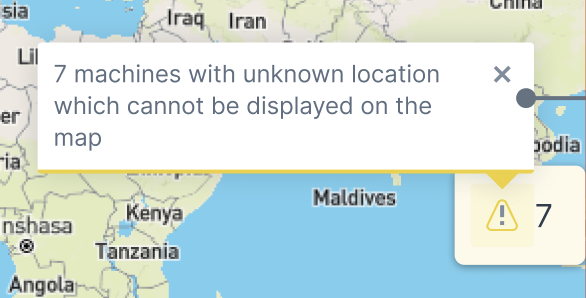
- Split View: In split view, use the "Unknown Location" filter to see the count of machines without location data in the list section. Similar to the map view, these machines will not be displayed on the map section, but only the count of the machines which can be then identified in the list.
Machine Page
Introduction
The Machines page is a representation of the data of a particular machine.
You can open the Machines Page via the Machines Overview, the Signal Overview Panel or searching the machine.
The navigation buttons in the top-right corner allow you to switch between the Machine Pages of your organization's machines (not shown when more than 12 machines are available)
Hovering over the navigation buttons shows the name of the next/previous machine.
Requirements
In order to view or edit the Machines Page within the DataPortal, the following requirements must be fulfilled:
| Permission Set Name | Level | Action |
|---|---|---|
| Machine | View | for viewing the Machine Page |
| Dashboard | Admin | for editing the Model Dashboard/Machine Page |
Configuration
A Machines Page inherits the layout of widgets from the Model Dashboard.
As an admin, you must use the Machine Page Layout to change the layout for the model dashboard.
It is recommended to add at least the Machine Master Data widget in order to display general information as well as the location of the machine as for example in the following image:
The Master Data widget will display the information in form of a panel on the dashboard within the following two tabs Machine Details and Location - provided that options are activated in the Master Data Configuration.
Machine Details
Shows the machine info and other details via icons for Maintenance Tasks, Machine Tracking and Weather Forecasts and Overlay when enabled in the Feature Switch. In the Details tab, the following information is displayed additionally to the configured ones:
| # | Item | Description |
|---|---|---|
| 1 | Machine Name | Name of the machine. |
| 2 | Connection Status | Current state (online/offline) since a particular date. |
| 3 | Location | Share the location of the machine, see Location. |
| 4 | Machine Info | Serial number - Serial number of the machine. Organization - The organization that created the machine and shares details. Machine Model - See Machine Model. OEM - The Organization the machine belongs to. Asset Type - See Asset Types. |
| 5 | Tabs | |
| 6 | Manage Layout | Configure the layout of the Machine Details Page, see Manage Layout |
| 7 | Manage Machine | Configure the machine's properties, see Manage Machine. |
| 8 | Map | Displays the machine's location on a map. If the machine is offline, a drop icon with a minus sign indicates its last known position. If the machine is online, the endpoint of the current track (circle with the number 3) is displayed . When zooming in, both the starting point (circle with letter A) and the current location (circle with number 2) of the machine are displayed. |
Location
The Location tab gives information about the machine's address and its Status and Update. Via the 3-dots you have options to copy and share the machine's location, see also Machines Overview.
Only if tracking is activated in Machine Master Data, location tracking is visible for the time range displayed above the map.
Note
Location data access must be set by an organization admin and is necessary to use this feature.
Contract Renewal
Contracts that are expiring soon are highlighted in the Machine Page within a banner on the top.
Depending on the user, the information in the banner changes:
-
As a user without at least Contract:Maintain permissions e.g. as a Machine Owner, you may only Request Renewal:
Figure 4: Contract Renewal banner Note
This request will be displayed both on the OEM portal and in the digest email listing the soon expiring contracts.
The eligible user may then renew the contract with Proemion. see below. -
As an eligible user e.g. as the OEM, you are displayed the message that a renewal was requested:
Figure 5: Contract Renewal requested -
Clicking Renew Contract, you will be forwarded to the Machine Contracts menu, where you can configure and confirm the Renew process for the selected machine:
Figure 6: Renew Contracts Note
To renew an "active (canceled)" or terminated contract, you need Contract:Maintain permissions.
-
After successful renewal, a confirmation will be displayed in the Machine Contracts menu:
Figure 7: Renew Contracts confirmed
-
After clicking the link in the banner, it will disappear from the machine.
Manage Machine
The Manage Machine window shows all properties, advanced functions and actions of the selected machine.
On the Machine Page, select the machine you want to manage and click the Manage Machine vehicle button in the top-right corner. This opens the Manage Machine window:
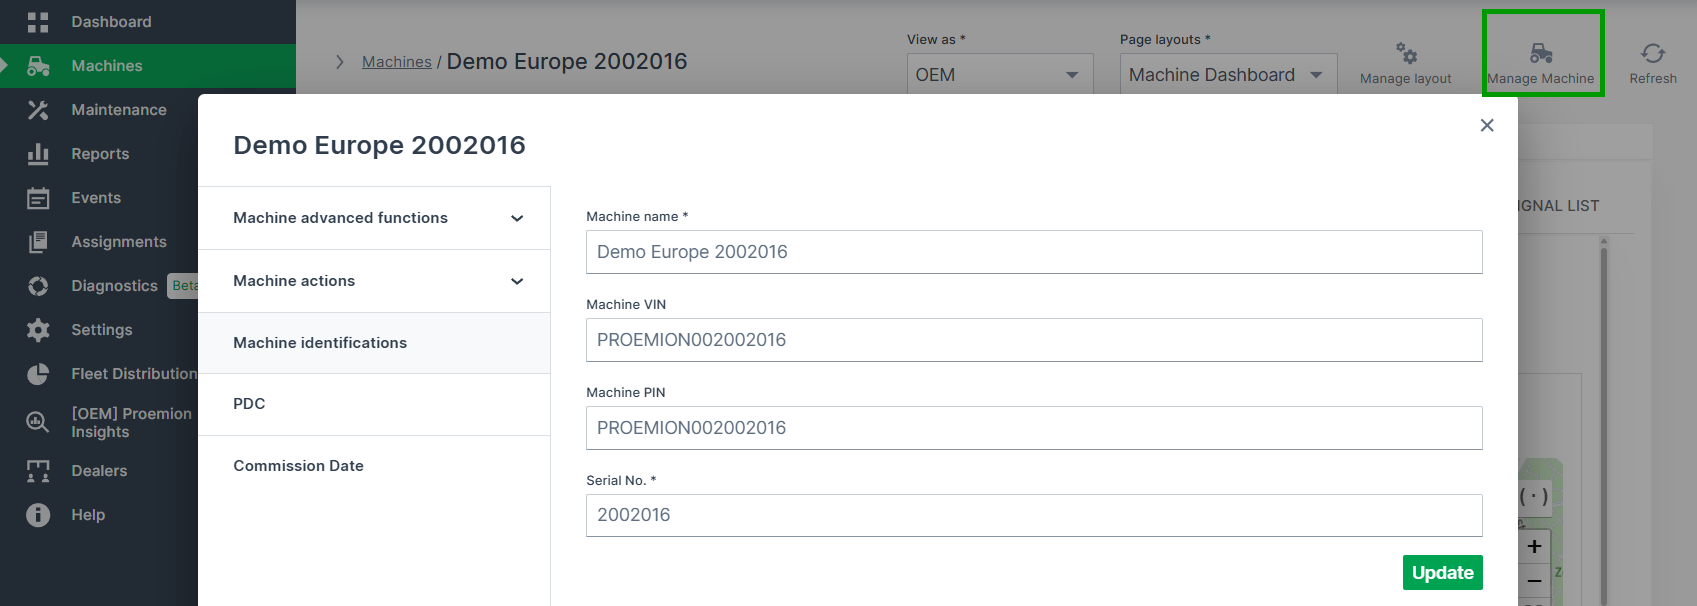
Note
Note that the available functions depend on the Device Mode of the machine.
You can configure several functions as described as follows in the documentation:
- Properties:
- Machine Advanced Functions:
- Machine Actions (examples; Actions are custom and defined in the PDC, see Machine Actions):
Manage Layout
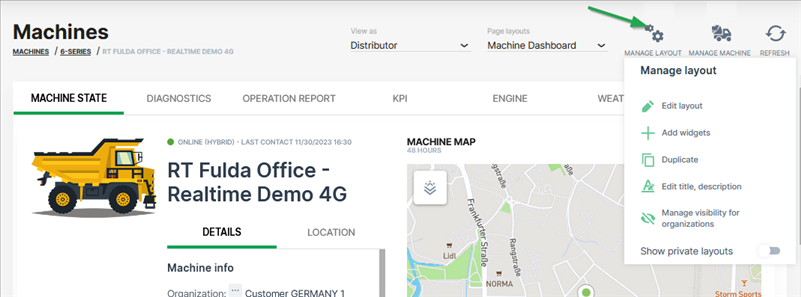
The Manage Layout configuration options are to be found in the drop-down menu via Manage Layout in the DataPortal.
They are described in the Machine Page Layout chapter.
Machine Tracking
Machine Tracking enables you to track the route and signal values of a machine for a specific time-frame
The machine route is represented as connected geo positions on a map. Signal values are displayed as graph data points that correspond to a geo marker on the map.
Machine Tracking is accessible via the marker icon ![]() in the Machine Master Data widget, which is usually to be found in the Machine Page.
in the Machine Master Data widget, which is usually to be found in the Machine Page.
Note
Location history access must be set by an organization admin and is necessary to use this feature.
Configuration
-
Click the marker icon
 in Machine Master Data to open the machine tracking page.
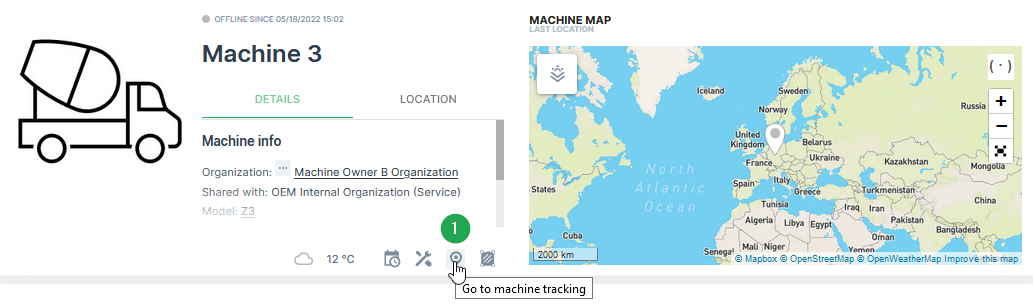
Figure 1: Open Tracking Configuration -
Adjust the settings for the time range, signal and visualisation according to your needs.
Note
The number of allowed waypoints may be limited on the map. A higher resolution view of the path is possible by limiting the displayed time range.
-
Click Apply to track the machine route on the map.
!!! note Additionally, it is possible to select a signal which can be visualised along the track. There are two options. The first option is the visualisation with a Gradient and the second option is to create a Chart in parallel.
!!! note The default color of the path tracking can be customized by selecting Settings > Portal Appearance > Theme > Map Style section.
Samples
Map with Gradient Signal Visualisation
| # | Item | Description |
|---|---|---|
| 1 | Time Range | Define the time range for the track. Please be aware that there is only a maximum time period of 7 days possible when a signal along the tracks needs to displayed. |
| 2 | Signal | Select the signal which needs to be visualized along the track. |
| 3 | Signal Visualisation | Gradient, see Map/Location Reporting |
| 4 | Gradient Options | See Map/Location Reporting |
| 5 | Print PDF | Option to export the track to a PDF. |
| 6 | Overlay | See Maps Overlay. |
| 7 | Zoom Options | With these buttons the size and the center of the map can be optimized. |
| 8 | Machine & Signal Name | The selected machine and signal is shown here. |
| 9 | Map Legend | This legend shows the grouped signal values and the assigned colours for the track. |
| 10 | Waypoint Popup Window | Shows position and signal value. |
Note
A mouse click on a waypoint on the map opens a popup window with the exact position, time stamp and the value for the selected signal.
Map with Chart Signal Visualisation
| # | Item | Description |
|---|---|---|
| 1 | Time Range | Define the time range for the track. Please be aware that there is only a maximum time period of 7 days possible when a signal along the tracks needs to displayed. |
| 2 | Signal | Select the signal which needs to be visualized along the track. |
| 3 | Signal Visualisation | Gradient, see Map/Location Reporting |
| 4 | Track options | See Map/Location Reporting |
| 5 | Print PDF | Option to export the track to a PDF |
| 6 | Overlay | See Maps Overlay |
| 7 | Zoom Options | With these buttons the size and the center of the map can be optimized. |
| 8 | Signal Chart | The chart for the selected signal and time range is shown here. |
Note
A mouse click on a waypoint on the map opens a popup window with the exact position and time stamp. Additionally, the corresponding value of the selected signal is marked at the chart.
Time Fence/Timetable
The Time Fences feature allows you to define a schedule for when a machine should be allowed to be in use. An active time fence checks at machine start if a breach - a connection to the portal outside scheduled operation - exists. If so, a breach event is registered resulting in an immediate email notification to the users subscribed to this notification.
Note
The DataPlatform generates time fence breach events when the machine starts operation due to ignition or CAN activity outside the configured schedule. Wake-ups caused by real-time clock (RTC-driven) mechanisms (for example cyclic wake-up intervals or alarm-based wake-ups) do not trigger time fence breach events, even if the device connects to the DataPlatform after waking up.
Note
This feature is only available if it has been activated for the organization from the Features tab in the Administration menu.
For example the schedule can be arranged thusly:
| Day | From - To |
|---|---|
| Monday | 9:00 - 17:00 |
| Tuesday | 9:00 - 17:00 |
| Wednesday | 9:00 - 17:00 |
| Thursday | 9:00 - 17:00 |
| Friday | 9:00 - 17:00 |
A time fence schedule arranged as shown in the table sends a breach event whenever the machine is in operation outside the designated time frames.
Configuration
To configure the Time Fence the Machine:View Permission Set is required.
To do so, proceed as follows:
On the Machine Page, select the machine you want to manage and click the Manage Machine vehicle button in the top-right corner.
This opens the Manage Machine window.
-
In the Manage Machine window, open the Machine advanced functions and select Time Fence.
-
Click the + sign and select a day and time; you can define multiple time fences from Monday to Friday.
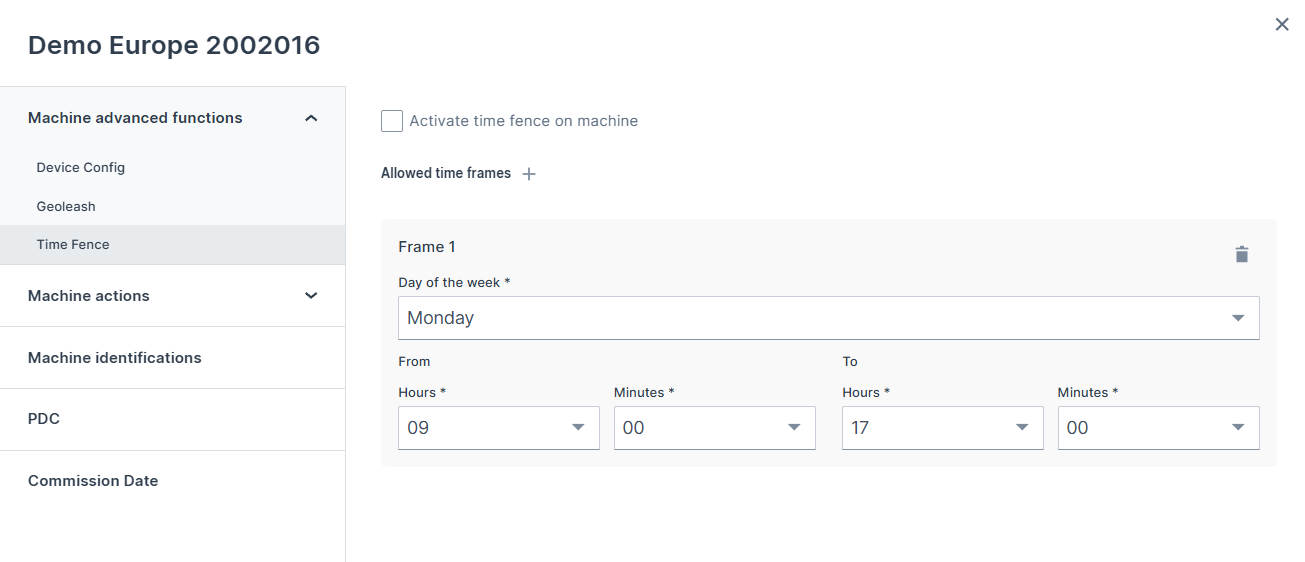
- Click Apply to save the time fence.
Subscribe to Time Fence Notifications
To subscribe to Time Fence Notifications for your organization, configure the Time fence breaches in your Notifications settings
Once subscribed you receive email notification about the first breach per day per machine.
Via Events you can see all breach events:
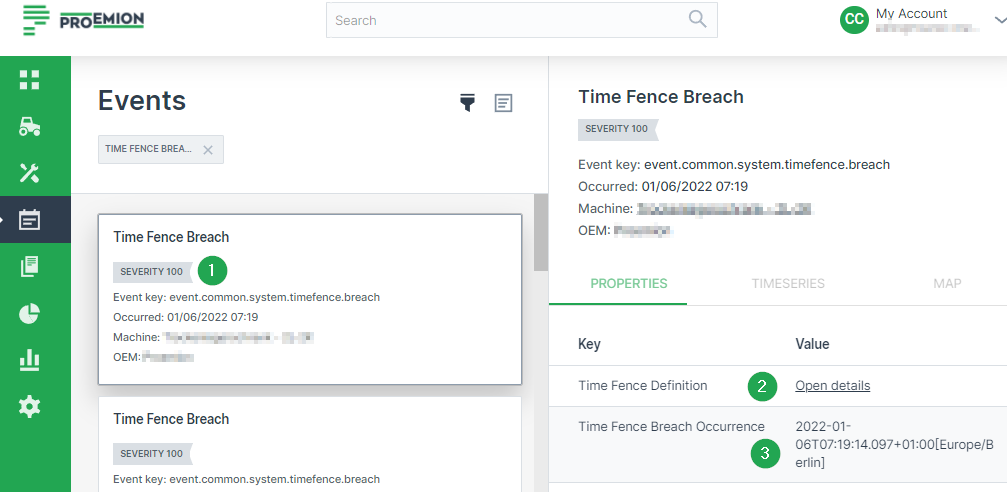
| # | Item | Description |
|---|---|---|
| 1 | Event Severity | Event timestamp (when the event was fired), machine name and severity level. |
| 2 | Time fence Definition | Link to the configured time fence schedule. |
| 3 | Time Fence Breach Occurrence | Incident timestamp (when the breach occurred). |
Connection Types
This documentation provides an overview of the different connection types available for CANlink® mobile devices, with a particular focus on the Online mode, which is the standard connection type for current devices. Legacy connection types such as Logging and Realtime modes are only relevant for older devices and are covered for completeness.
Note
The Online mode replaces the previously separate Logging and Realtime modes that are only used in some legacy devices. In order to use Diagnostic Cases make sure that Realtime cases are included in your machine's Contract Details.
Online Mode
The Online mode connection type combines the functionality of both Logging and Realtime modes. Devices operating in this mode:
- Continuously log data to the DataPortal.
- Support real-time diagnosis sessions for remote diagnostics and monitoring at the same time.
This connection type enables seamless data acquisition and interaction, as devices operate in a combined mode that does not allow switching between Logging and Realtime. Devices using the Online mode connection type appear in the DataPortal with a green indicator (small green circle in the first column). These devices are included in both the Realtime and Online filters. This means they are visible whenever either filter is applied, appearing in both filtered views within the DataPortal.
This feature must be enabled in the Behavior Options.
The mode is displayed and can be filtered in the following DataPortal features, if enabled:
-
Machine Map widget
-
Machine List widget
-
Machine Master Data widget
Realtime/Logging Switch
Note
This functionality is only available for legacy devices.
The Device mode functionality enables switching the CANlink® mobile device between the modes Logging and Realtime.
In Logging mode, the device records preconfigured machine signals when it is online and transmits them to the DataPlatform. In contrast, in Realtime mode, the device transmits raw CAN messages to a service application for live diagnostics, and no signals are logged to the DataPlatform.
Device Mode
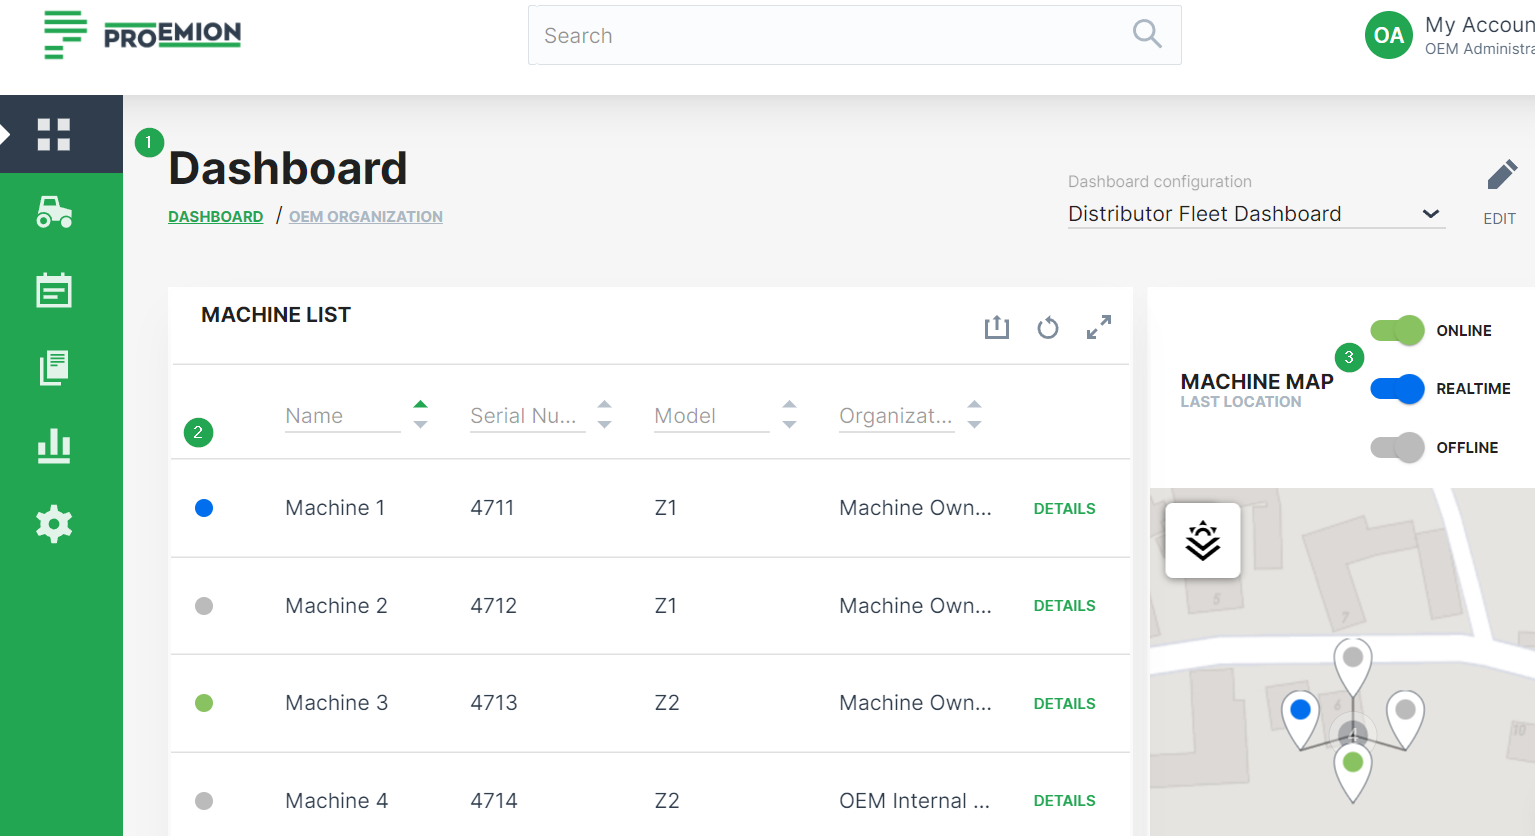
-
You can see the current mode for the machines in both the Organization Dashboard and Model Dashboard.
Note
To display the online status and device mode of the machines, the administrator should have enabled the Machine List or the Machine Map widgets that both show the indicators.
-
On the left of each machine row within the Machine List widget, Realtime mode is indicated by a blue online marker and Logging is indicated by a green online marker.
-
The machine map widget allows to filter machines by their online status/device mode. This is done by means of the corresponding toggle switch.
Switch Device Mode
The Realtime:Admin Permission Set is required to switch between Realtime and Logging modes. If the communication unit is offline, the device mode switch is not available.
To switch the device mode, proceed as follows:
On the Machine Page, select the machine you want to manage and click the Manage Machine vehicle button in the top-right corner.
This opens the Manage Machine window.
-
In the Manage Machine window, open the Machine advanced functions drop-down menu and select Device mode.
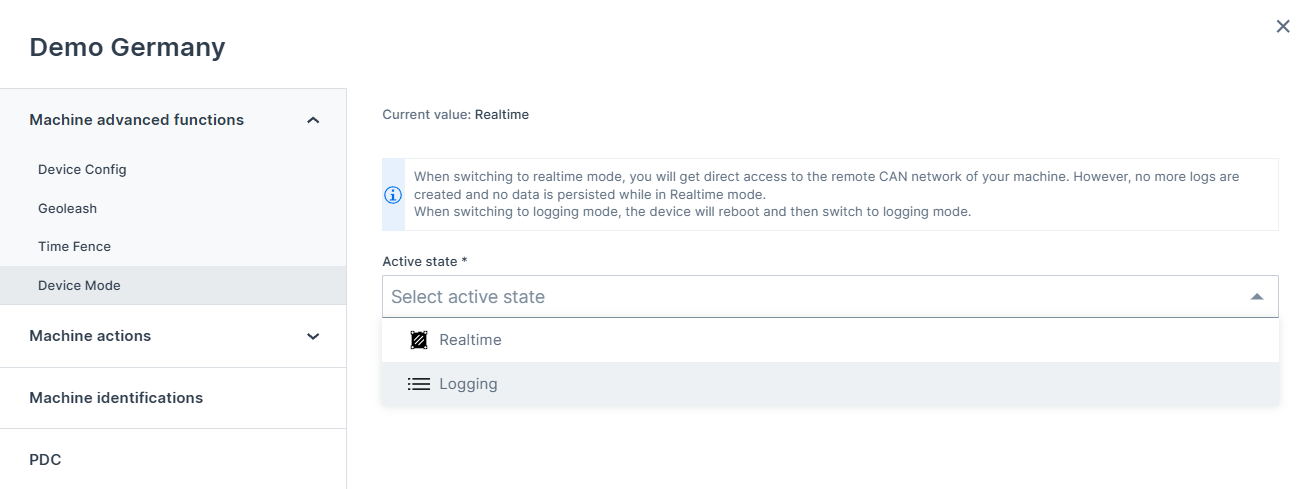
Figure 2: Device Mode Dialog -
Select Realtime or Logging mode from the Active state drop-down menu.
Machine Actions
The Machine Actions functionality enables the user to transfer information entered into the DataPortal interface to the machine. Information can be sent to the machine as one of the following:
| Data Type | Description | Sample Use Case |
|---|---|---|
| Numeric Value | Data sent to the machine that acts as a trigger or target value. | Change a machine control parameter such as maximum engine speed (numeric increase/decrease). |
| Set State | Data sent to the machine that allows the setting of a discrete (or distinct) state. | Change the machine mode from Power to_Eco* mode. |
| String Value | Data sent to the machine so the communication unit can execute some action. | A string could be sent from the DataPortal to the machine display. |
Machine Actions functionality including user permission level and organizational unit access are configured in the PDC file.
Note
The transfer of data to the machine may be delayed depending on whether the communication unit is online or offline.
Numeric Value Example: Time Fence – Start Time
In the Manage Machine dialog, the user can select an action from the list, such as Time Fence: Start time.
This action allows setting the time from which the machine is permitted to operate – a typical example of a numeric value sent to the machine.
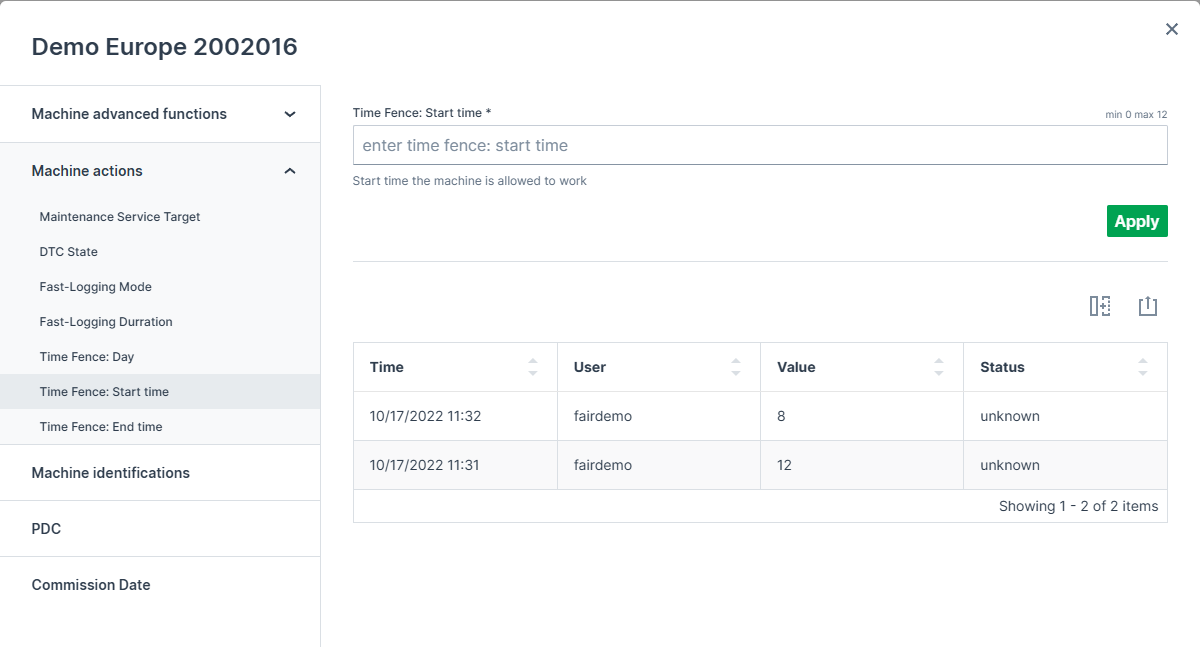
| # | Item | Sample | Description | PDC Item |
|---|---|---|---|---|
| 1 | Action Title | Time Fence: Start time | Label for the action | Action title |
| 2 | Action Input | Enter time value | Numeric value used as a trigger or target time | Action valueLabel |
| 3 | Defined Signal Value | Control Value | Time from which the machine is allowed to work | valueDefinition |
After entering the new value and clicking Apply, the value is sent to the machine and taken into account accordingly.
Set State Example: DTC State
In the Manage Machine dialog, the user can select an action such as DTC State.
This action allows selecting one discrete state from multiple options via a dropdown menu, for example choosing between No Active Errors, Active Error, or Multiple Active Errors.
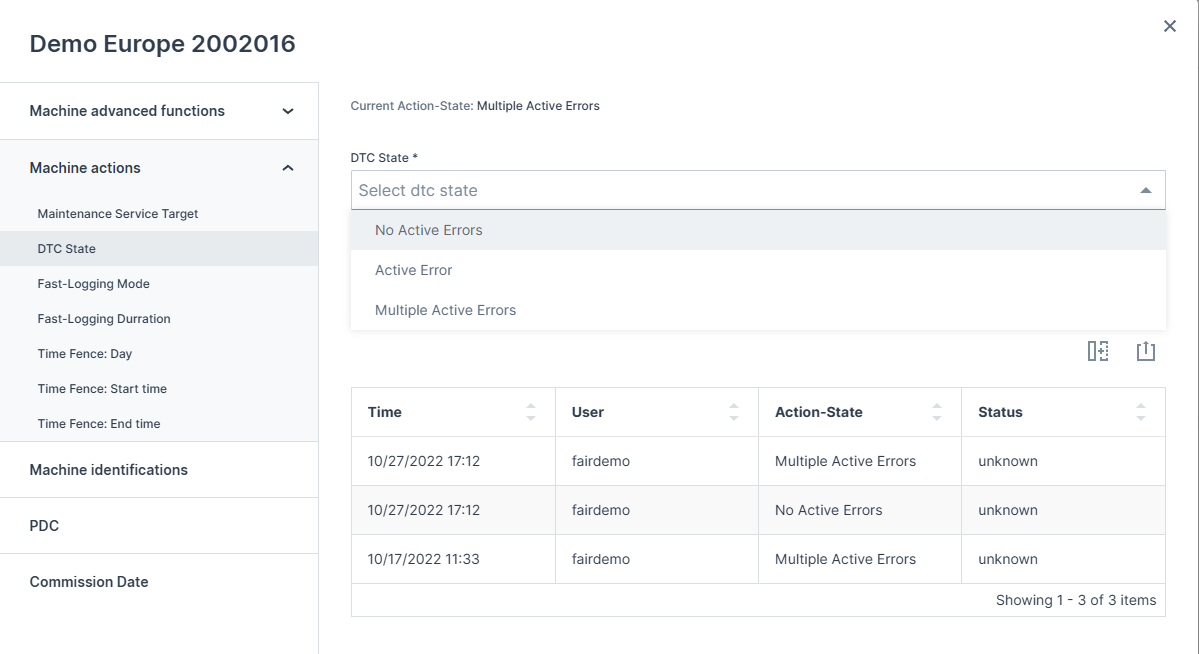
| # | Item | Sample | Description | PDC Item |
|---|---|---|---|---|
| 1 | Action Title | DTC State | Label for the action | Action title |
| 2 | State Selector | Dropdown with multiple states | Select one state from options | Discrete Value valueLabel |
| 3 | Current State | No Active Errors / Active Error / Multiple Active Errors | Current trigger state | valueDefinition |
After selecting the desired state from the dropdown and clicking Apply, the new state is sent to the machine and applied accordingly.
Machine Actions Configuration
The Actions configuration (the labels for the DataPortal and the object descriptions on the communication unit) is described in the PDC Manual (PDC Manual). Contact your Proemion representative for further information.
Reset Device
The Reset Device feature is only available for CANlink® mobile devices.
To reset the device, the Machine:Admin Permission Set is required.
Proceed as follows:
On the Machine Page, select the machine you want to manage and click the Manage Machine vehicle button in the top-right corner.
This opens the Manage Machine window.
-
In the Manage Machine window, open the Machine advanced functions and select Device Config.
-
Select a Reset type from the drop-down menu and click Apply. The device will be restarted.
The following reset options are available:
-
Revert to Factory Configuration
-
Delete All Log Files
-
Revert to Firmware Defaults Remote
-
Revert to Firmware Defaults plus Format Remote
-
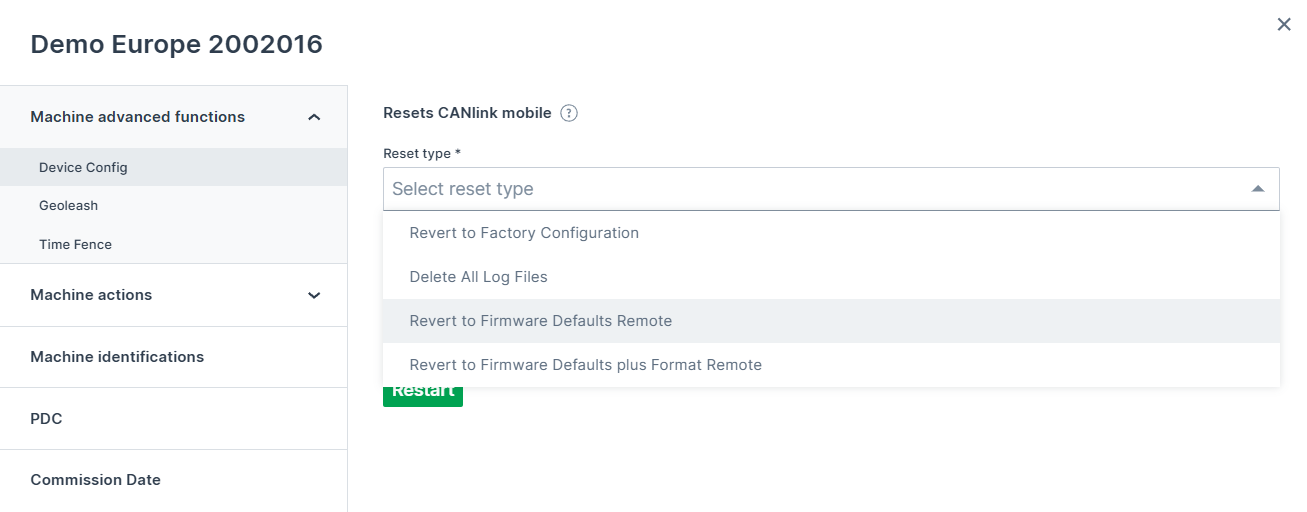
For more details about the different type of resets, refer to following information from the chapter Device Reset CANlink mobile 3600 of the CANlink mobile Device Manual showing the according objects and their sub-indexes for triggering the various reset options available via the CAN interface:
| Function | Index | Subindex | Description |
|---|---|---|---|
| Revert to Factory Configuration1 | 0x1011 |
0x01 |
The factory configuration is restored. All logged data is deleted. |
| Delete All Log Files | 0x1011 |
0x62 |
All logged data stored on the device is deleted. |
| Revert to Firmware Defaults Remote | 0x1011 |
0x63 |
The standard configuration1 of the current firmware is restored. All logged data is deleted. CAN, Wi-Fi®, Bluetooth and mobile radio parameters as well as the factory configuration are retained. |
| Revert to Firmware Defaults plus Format Remote | 0x1011 |
0x64 |
The standard configuration of the current firmware is restored. All logged data and the factory configuration are deleted. CAN, Wi-Fi®, Bluetooth and mobile radio parameters are retained. |
| Revert to Firmware Defaults Local | 0x1011 |
0x65 |
The standard configuration of the current firmware is restored. All logged data and parameters are deleted. The factory configuration is retained. |
Consider that when a Device Reset is being performed, the ON LED flashes in a magenta color and the Status LED orange, see Device Reset CANlink mobile 3600.
-
Difference between Factory configuration and Standard configuration:
Factory configuration
With the end-of-line tests (EOL test), Proemion loads a standard configuration (
DOD.binfile) into the file system of the device.
This configuration is called Factory configuration.
The content of this file is activated in the device by using the object0x1011, subindex0x01. The factory configuration can be easily overwritten by the customer via the object0x3333, subindex0xF0.
This makes it easy for customers to define and install their own configuration as the "factory configuration".
If there is no file in the file system, the device configuration will not be changed, but the logged data will always be deleted.Standard configuration
Each firmware version has its own default values in the code for non-volatile configuration parameters. These default values are loaded automatically for fresh devices, for example.
The default values of the firmware are loaded via the object0x1011, subindex0x63.
In contrast to the factory configuration, the standard values cannot be changed by customers.
These are fixed values in the code memory. ↩↩
Restart Device
The Restart Device feature is only available for CANlink® mobile devices.
You must have Machine:Admin permission to be able to reset the device.
Proceed as follows:
On the Machine Page, select the machine you want to manage and click the Manage Machine vehicle button in the top-right corner.
This opens the Manage Machine window.
-
In the Manage Machine window, open the Machine advanced functions and select Device Config.
-
Click Restart. The device will be restarted.
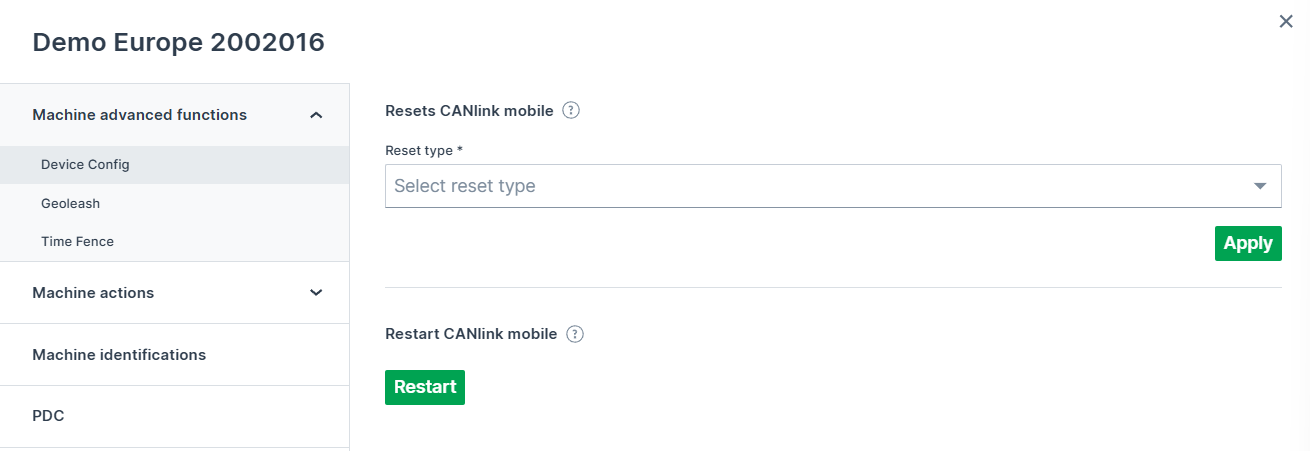
Figure 1: Device Restart
Remote Machine Tunnel
Remote Machine Tunnel
The Remote Machine Tunnel feature allows secure remote access to device services that are connected to the same Ethernet network as the CANlink® mobile 10000. This includes remote access to the CANlink® mobile 10000 itself.
Since the CANlink® mobile 10000 supports the CODESYS EdgeGateway service, it can also be used remotely to access other CODESYS-compatible devices on the same local network. The CODESYS EdgeGateway service is disabled by default and must be enabled via the device configuration.
A Remote Machine Tunnel can expose one or more endpoints.
Each tunnel provides secure access to one or more services on the device through user-defined endpoints.
Only one tunnel can be active at a time. Running multiple tunnels simultaneously is not supported.
All communication via the Remote Machine Tunnel is encrypted. For HTTPS-based services, HTTPS endpoints use the built-in HTTPS encryption of the service itself.
For TCP based services, additional client-side TLS encryption may be required. This is handled by the Remote Machine Tunnel Client.
Preconditions
Before you can use the Remote Machine Tunnel feature, the following requirements must be met:
-
Device type:
Only the CANlink® mobile 10000 supports Remote Machine Tunnel. -
Firmware version:
The feature requires firmware version 2.0.0 or higher. -
Online status:
The device must be online to successfully establish a tunnel connection to the DataPortal. However, tunnel actions (create, start, stop) can also be configured while the device is offline. In this case, the tunnel will initially fail to connect, but the connection will be established automatically once the device is online. This allows a tunnel to be preconfigured and ensures it connects as soon as the device is reachable. -
User permissions:
The user must have the Realtime:Admin Permission Set. -
Service availability:
Only services that are enabled and running on the CANlink® mobile 10000 can be accessed through a tunnel.
If a service such as CODESYS EdgeGateway or WebVisu is disabled on the device, the corresponding endpoint will not be reachable.
Note
The Remote Machine Tunnel does not activate or configure services on the device.
Services must be enabled on the CANlink® mobile 10000 before they can be accessed through an endpoint.
Terminology
The following table defines key terms used when working with a Remote Machine Tunnel between the DataPortal and the CANlink® mobile 10000. Understanding these terms will help clarify the concepts referenced throughout this documentation.
| Term | Context | Description |
|---|---|---|
| Endpoint (DataPortal) | DataPortal | A configuration in the DataPortal that defines how a remote connection should be established. Specifies Target IP, Target Port, Protocol (HTTPS or TCP), and a user-defined Endpoint Name. Not an active connection, just the definition of one. An endpoint does not guarantee that the target service is available. Service availability depends on the device configuration. |
| Service (CANlink® mobile 10000 local UI) | CANlink® mobile 10000 | A network-accessible function running on the device, such as the Web UI (HTTPS), CODESYS WebVisu, CODESYS EdgeGateway, or any other process listening on an IP address and port. A Service must exist and be reachable for the tunnel to succeed. |
| Tunnel | Connection | A secure, temporary connection that becomes active when one or more endpoints are started. Connects the configured endpoint to the remote user, uses encrypted communication, generates a temporary Access URL, and expires after a session timeout or when manually stopped. A tunnel session may include multiple endpoints. |
| Access URL | DataPortal | A randomly generated temporary URL that is created when a tunnel starts. It forwards remote traffic securely to the endpoint’s target service. The URL is valid only for the duration of the tunnel session (default up to 4 hours) and is revoked once the tunnel expires. |
Overview Page
To open the Remote Machine Tunnel Overview Page, choose a CANlink® mobile 10000 machine from the Machines Overview Page and click the Remote Machine Tunnel icon in the upper right corner.
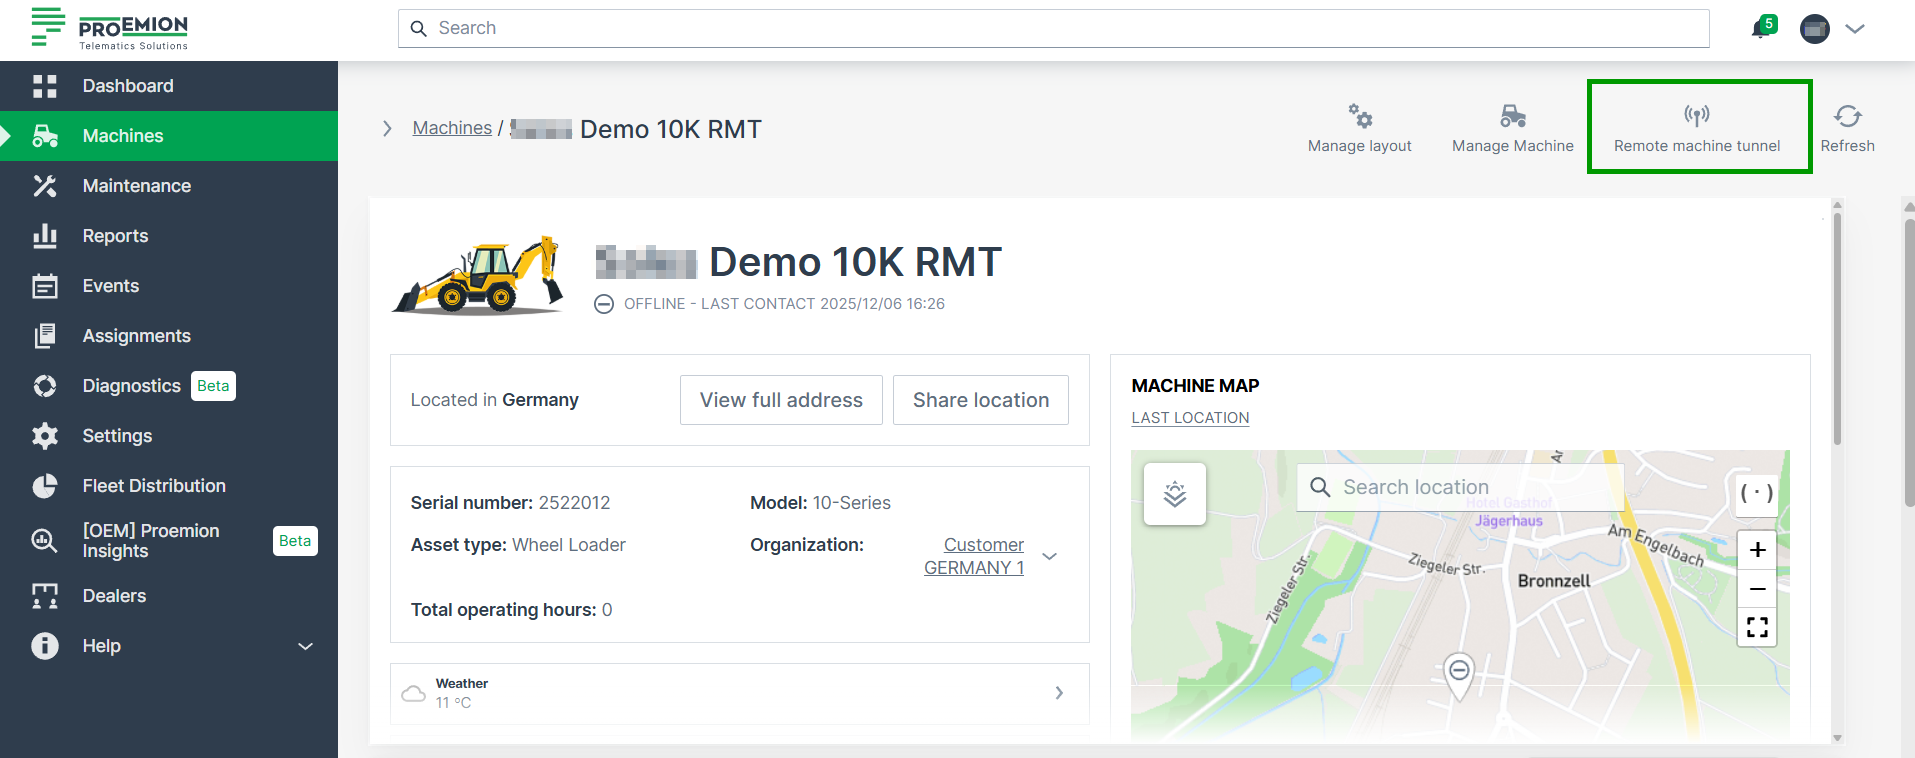
On the Overview Page, the following information is available:
-
Machine Name
The name of the selected CANlink® mobile 10000 as shown in the Machines Overview. -
Online / Offline Status
Indicates whether the device is currently connected to the DataPortal. -
Last Contact
Timestamp of the most recent successful communication between the device and the DataPortal.
| Column | Description |
|---|---|
| Endpoint Name | Unique user-defined name of the endpoint; must be globally unique per machine. Only alphanumeric characters, underscores, and hyphens are allowed. |
| Endpoint Address | Generated remote tunnel address (Access URL). Clickable link for HTTPS endpoints; can be copied via the copy button or opened in a new browser tab. |
| Target IP | IP address of the service the endpoint should access through the tunnel. For services running on the CANlink® mobile 10000, 127.0.0.1 is typically used.If, for example, a display is connected via Ethernet, the IP address of the display that was specified for this communication channel must be used. |
| Target Port | Port on the target device that the tunnel forwards traffic to (for example 443, 8080, 1217). |
| Type | Protocol type selected for the endpoint. Possible values: • HTTP/HTTPS – for browser-based web UIs • TCP – for tunneling generic TCP services (for example CODESYS EdgeGateway). |
| Status | Current state of the endpoint’s tunnel. Possible states: • not started – endpoint is configured, but its tunnel has never been started • disconnected – the tunnel was started at least once, but is currently not active (for example stopped by user or expired) • unknown – a tunnel action was requested, but the device has not yet reported a definitive state • connected1 – tunnel is successfully established and active • failed – the tunnel could not be established • An unexpected error occurred. – Generic or unspecified error • Failed to resolve the remote address. – DNS or hostname could not be resolved • The connection to the machine could not be established. – Unable to establish a connection to the device • Protocol error during communication. – Protocol mismatch or invalid communication • Authentication failure. – Authentication with the remote device failed • Internal system error. – Unexpected internal system failure • Heartbeat failure. – Tunnel lost connection due to heartbeat timeout |
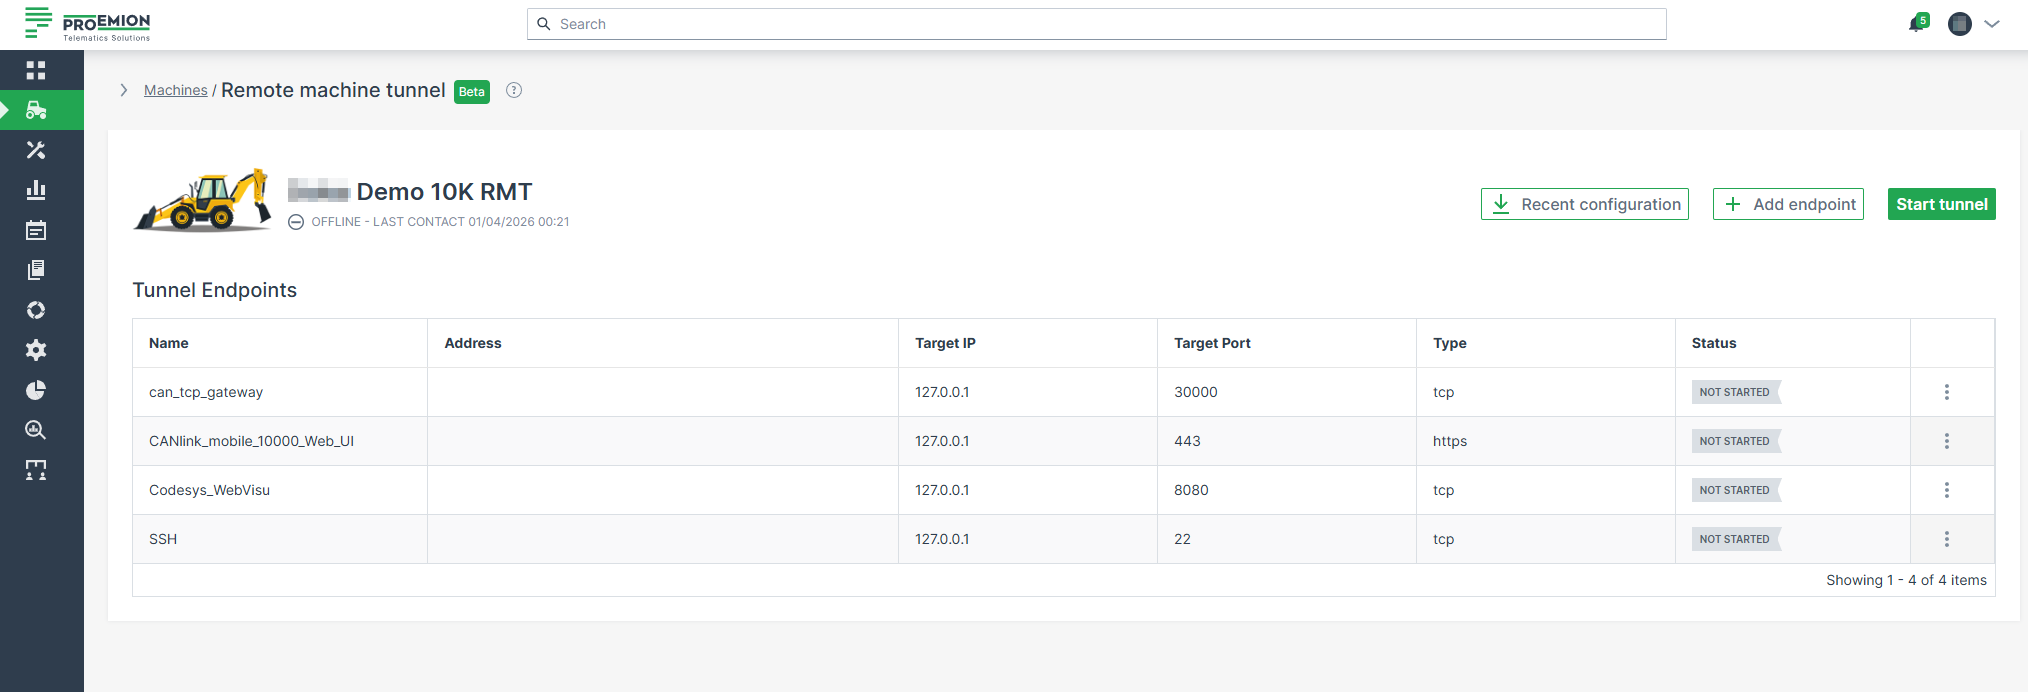
Endpoint Management
The following documentation guides you through the steps when creating, starting, stopping, editing and deleting an endpoint.
Adding Endpoints
To add an endpoint, proceed as follows:
-
Choose a CANlink® mobile 10000 machine from the Machines Overview Page and click the Remote Machine Tunnel icon in the upper right corner. The Remote Machine Tunnel overview page opens.
-
Click + Add endpoint to start the configuration. The configuration form opens.
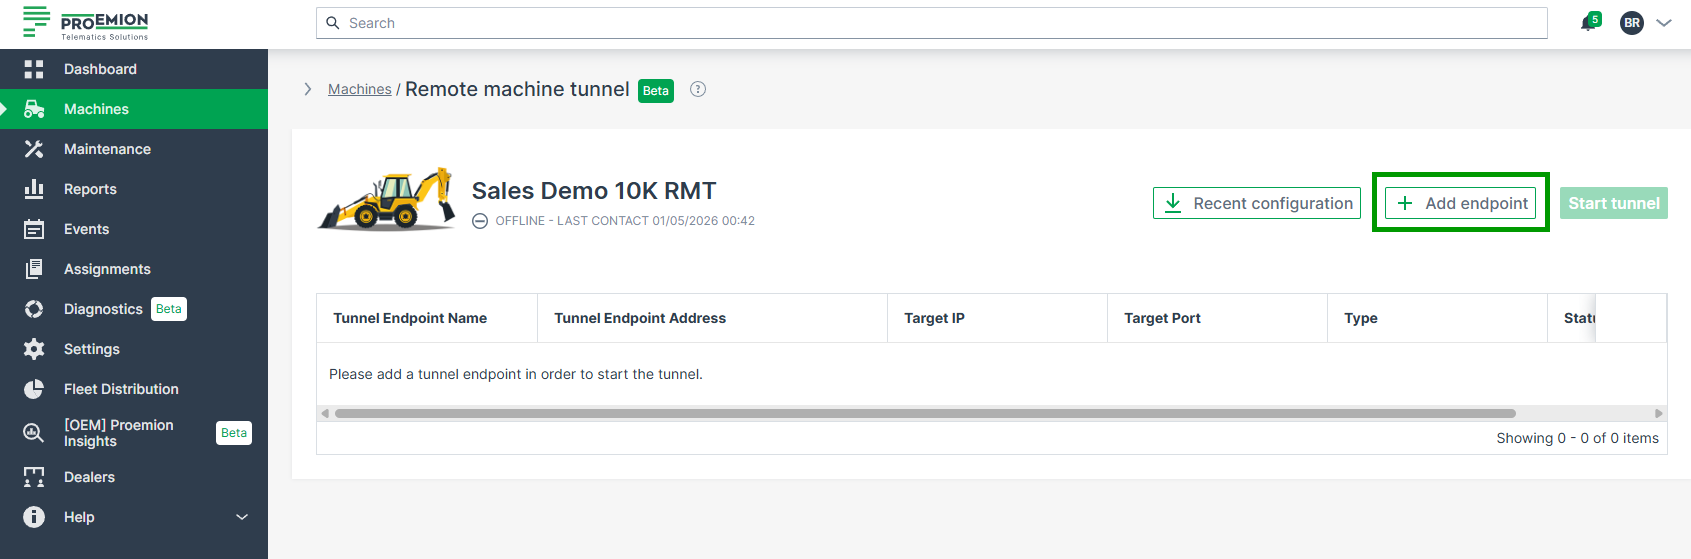
Figure 3: Remote Machine Tunnel Overview -
Fill out the form. Available fields:
- Endpoint configuration (optional):
Choose from predefined configuration options (see table below).
Selecting an option automatically fills in the endpoint type, name, Target IP, and Target Port. -
Endpoint type (mandatory): Choose the endpoint type. Available types are: HTTPS, HTTP, TCP
-
Endpoint name (mandatory):
If using a predefined configuration from the dropdown, the name is prefilled accordingly.
Only alphanumeric characters, underscores, and hyphens are allowed (1–255 characters).
The endpoint name must be unique per machine. -
Target IP (mandatory):
Enter the IP address of the service you want to access through the tunnel.
For services running on the CANlink® mobile 10000, use127.0.0.1.
For services hosted on external devices in the same local Ethernet network (e.g., HMI or display units), enter the IP address assigned to that device. -
Target Port (mandatory):
Enter the port on which the service is listening.
Common examples include:443for HTTPS-based user interfaces8080for visualization services (e.g., CODESYS WebVisu)1217for CODESYS EdgeGateway
The port must match the actual service configuration.
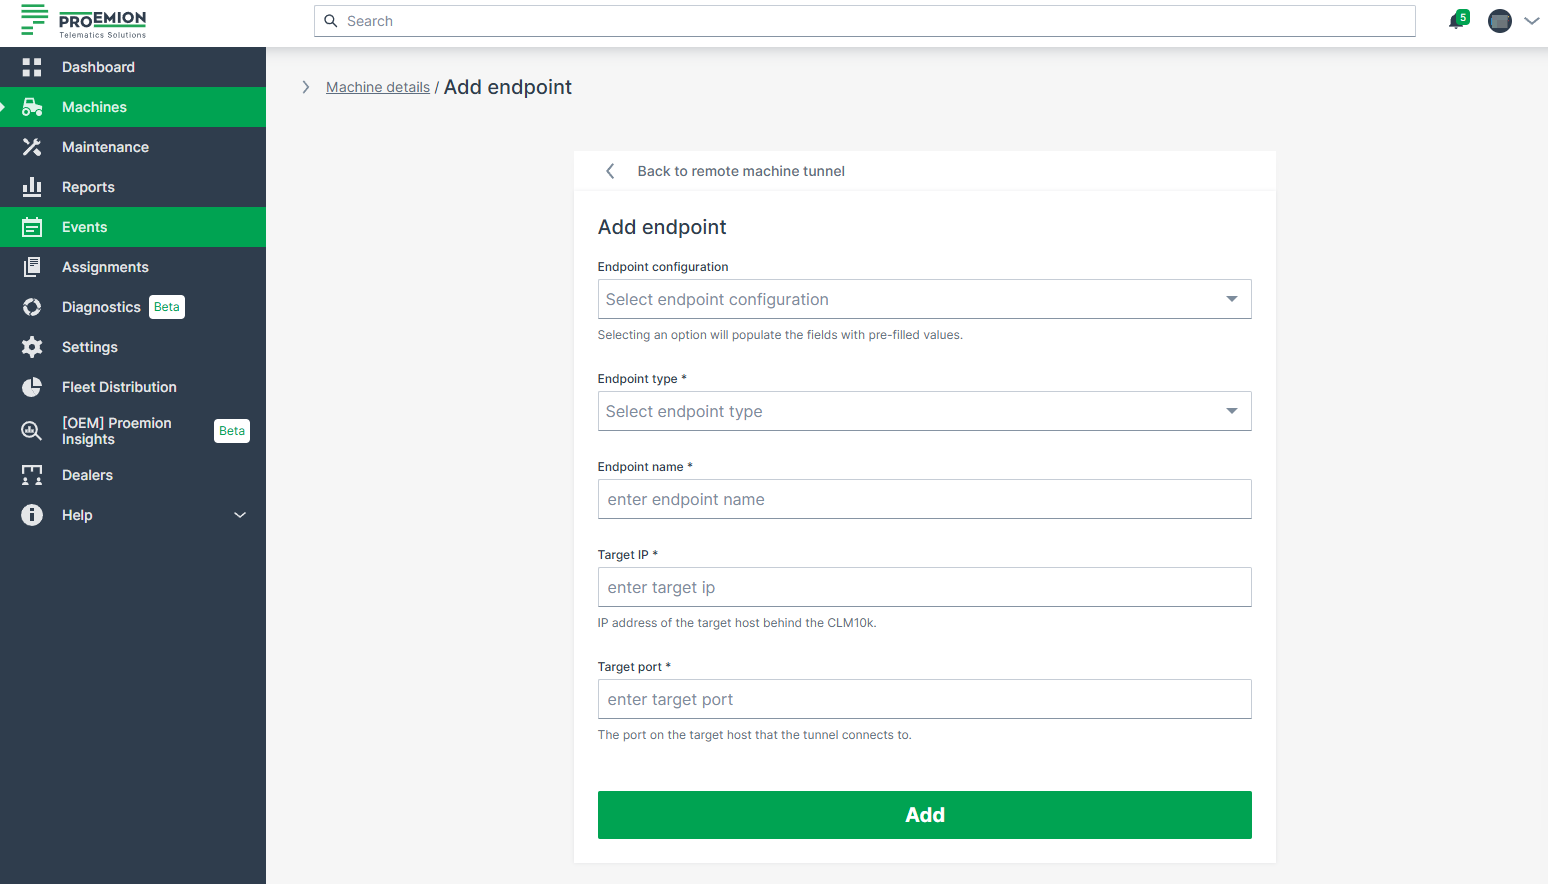
Figure 4: Remote Machine Tunnel Configuration Form
- Endpoint configuration (optional):
A confirmation message appears when endpoint creation succeeds: Endpoint has been added successfully. Start tunnel to get the endpoint address.
Predefined configuration types
| Configuration Name | Target IP | Target Port | Type |
|---|---|---|---|
| CANlink mobile 10000 Web UI | 127.0.0.1 | 443 | HTTPS |
| CODESYS WebVisu | not prefilled, must be specified by the user | 8080 | HTTP |
| CODESYS EdgeGateway | 127.0.0.1 | 1217 | TCP |
Recent Configuration
To restore the most recent successfully established tunnel endpoint configuration, use the Recent configuration button. Once clicked, the tunnel configurations appear in the table and a confirmation message appears: The current tunnel endpoint list now contains the last successfully established tunnel configuration.
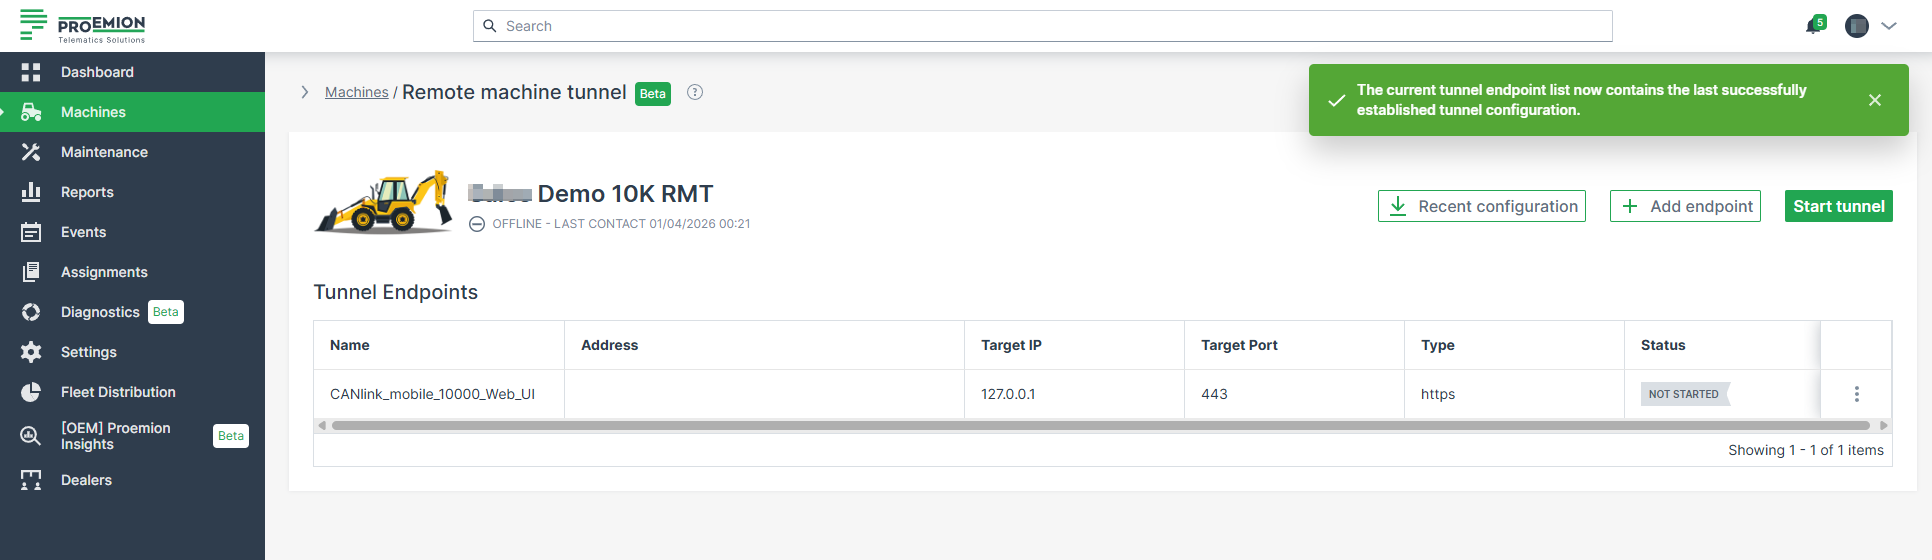
Duplicate Endpoint Validation
The system prevents users from creating duplicate endpoints:
- An endpoint name cannot be reused. If the name already exists, the UI displays: Endpoint name already exists. Please choose a different name.
- A target address and port combination must be unique. If it is already used by another endpoint, the UI displays: This address:port combination is already used by another endpoint. Please choose a different address:port combination.
Starting & Stopping a Tunnel
To start a tunnel, the user must first create at least one endpoint; the Start tunnel button remains disabled until an endpoint exists. Once a tunnel is started, the DataPortal displays the confirmation message Tunnel creation request sent successfully. While a tunnel is running, endpoint management actions — adding, editing, and deleting — are disabled. Users can still copy the endpoint address, which triggers the confirmation message Endpoint address copied to clipboard.
To stop a running tunnel, the user selects Stop tunnel, which immediately terminates all active connections. Endpoint management actions — adding, editing, and deleting — are available again.
You cannot stop individual endpoints; all active endpoints from a tunnel are stopped at the same time.
Editing Endpoints
Endpoints can be edited when no tunnel is running.
When a tunnel is active, endpoint management is disabled and the Edit option is not available.
Once a tunnel has been stopped, the endpoint configuration can be adjusted again.
To do so, proceed as follows:
-
Open the 3-dots menu at the end of the row of an endpoint and choose the Edit option.
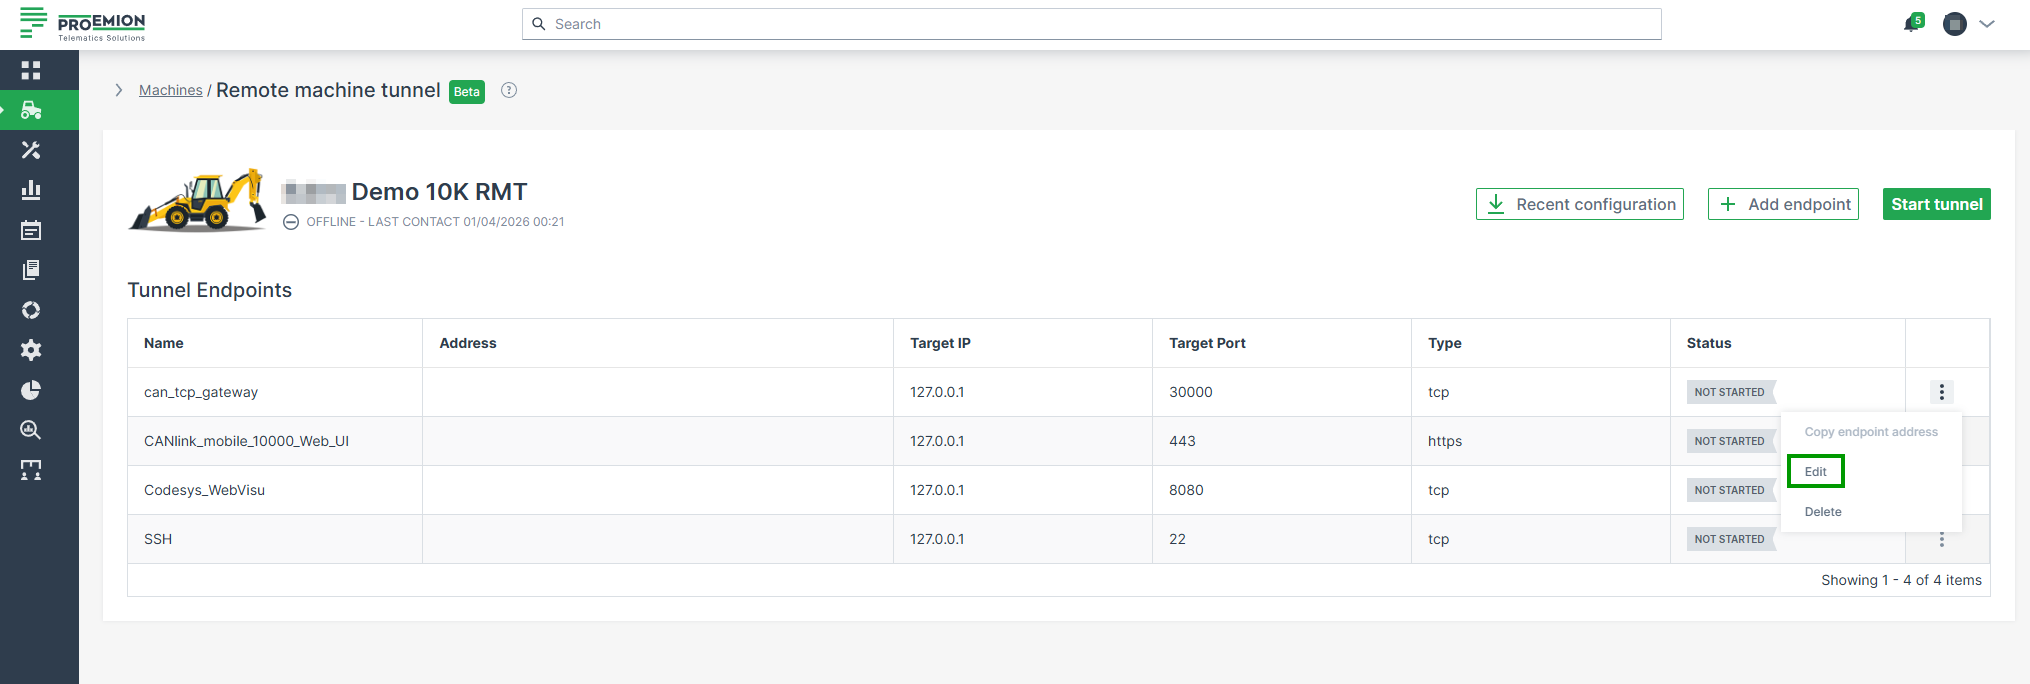
Figure 6: Edit Endpoint -
Edit the configuration as described in Adding Endpoints.
-
Click Update to apply your changes.
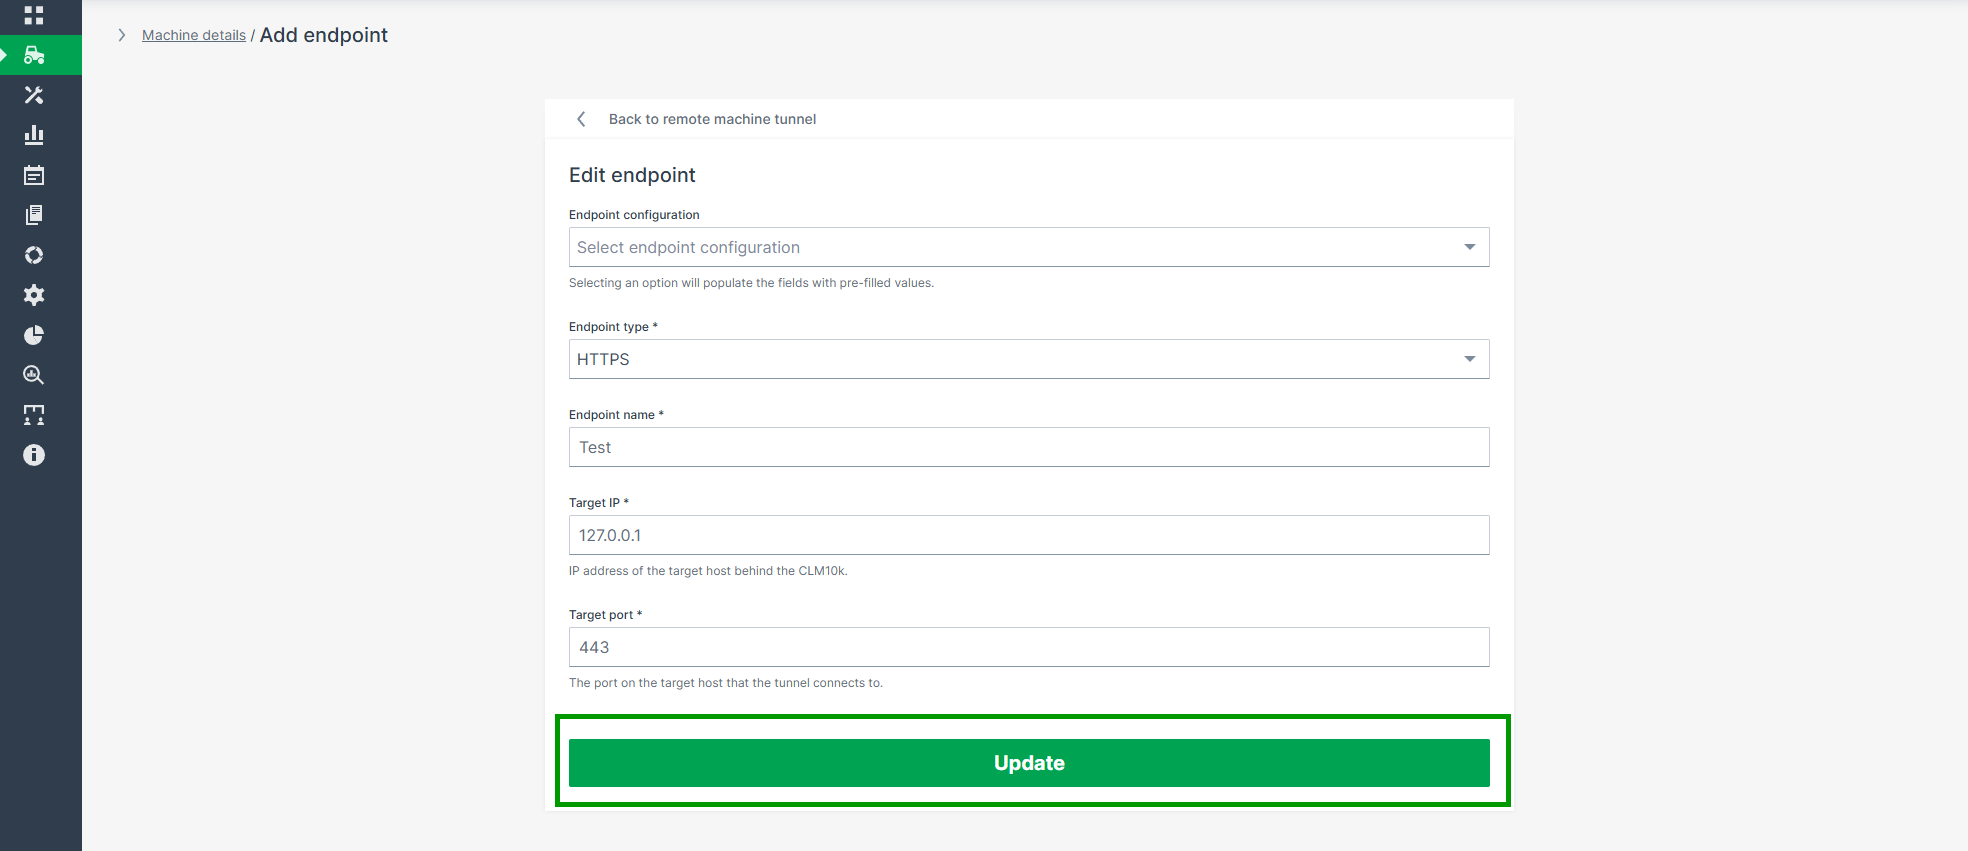
Figure 7: Apply Changes
A confirmation message appears: Endpoint has been updated successfully.
Deleting Endpoints
Endpoints can be deleted only when no tunnel is running.
When a tunnel is active, endpoint management is disabled and the Delete option is not available.
Once a tunnel has been stopped, endpoints can be removed.
To delete an endpoint, proceed as follows:
-
Open the 3-dots menu at the end of the row of an endpoint and choose the Delete option.
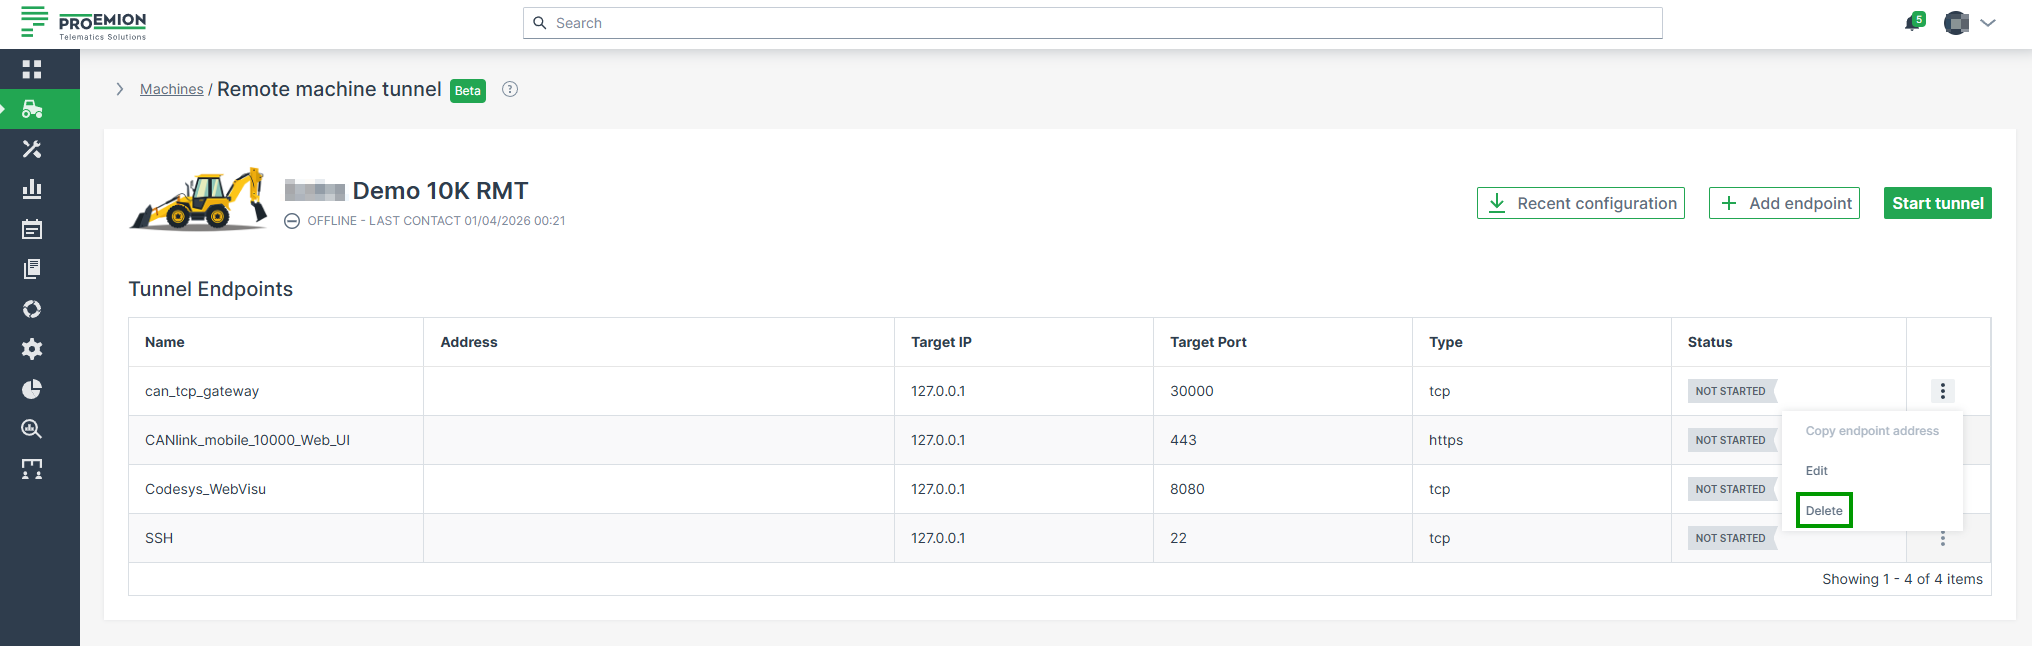
Figure 8: Delete Endpoint -
Confirm the deletion in the dialog that appears.
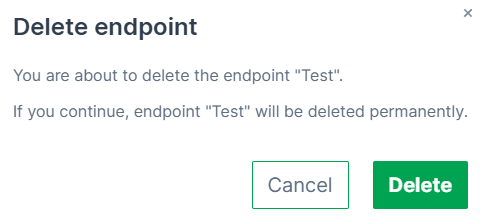
Figure 9: Confirm Deletion
A confirmation message appears: Endpoint has been deleted successfully.
Copy Endpoint Address
For each endpoint, the automatically generated Endpoint Address (Access URL) can be copied for use outside the DataPortal.
This is especially useful when opening HTTPS endpoints directly in a browser or when connecting to TCP-based services through the Remote Machine Tunnel Client.
To copy an endpoint address, proceed as follows:
-
Open the 3-dots menu at the end of the row of an endpoint and click Copy endpoint address.
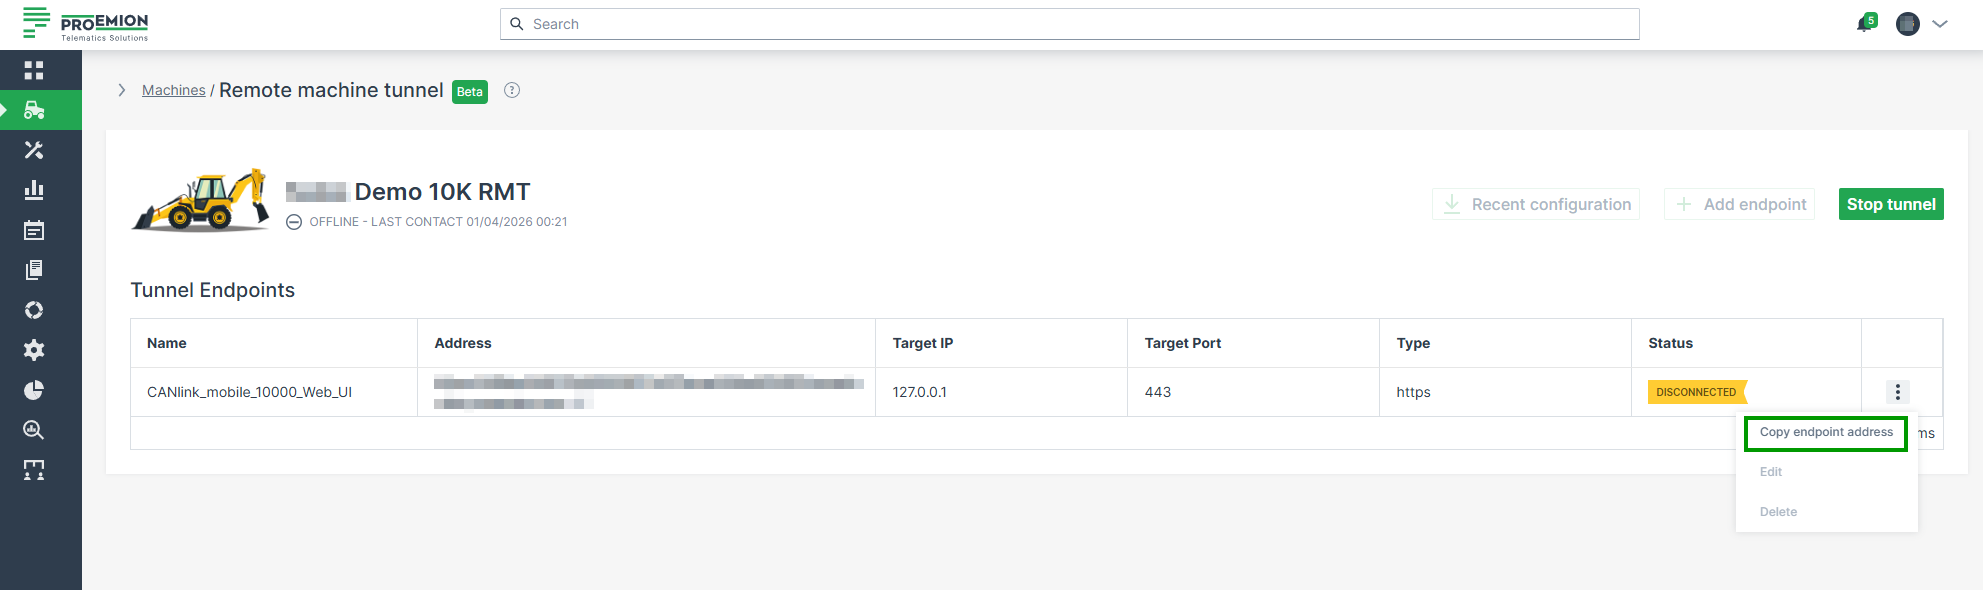
Figure 10: Copy Endpoint Address -
The address is copied to your clipboard.
A confirmation message appears: Endpoint address copied to clipboard.
The copied address can then be pasted into a browser (for HTTPS endpoints) or used as a target for TCP endpoints by the Remote Machine Tunnel Client.
-
The Remote Machine Tunnel Icon in the upper right corner of the machine details page is green. ↩
Remote Machine Tunnel Client
The Remote Machine Tunnel Client (RMT Client) establishes TLS-encrypted local TCP connections to services on remote machines.
This allows local tools (for example, CODESYS) to connect to remote services through 127.0.0.1:<local port> without requiring direct network access.
The RMT Client is specifically designed for use with the Remote Machine Tunnel feature and provides built-in encryption without requiring external tools.
This chapter explains how to use the RMT Client to establish and manage secure tunnel connections.
Refer to the Remote Machine Tunnel documentation for configuration details and general information.
Prerequisites
Before you start, make sure the following requirements are met:
-
The RMT Client is installed. Open the Remote Machine Tunnel overview page and download it directly from the DataPortal.

Figure 1: Download RMT Client -
You have access to the target machine in the DataPortal.
- A Remote Machine Tunnel endpoint of type TCP is configured and started, see Endpoint Management.
Open a tunnel
To initiate a tunnel, proceed as follows:
-
Navigate to Machines > Remote Machine Tunnel to open the Remote Machine Tunnel overview page.
-
In the Address column, click the link with the prefix
rmt://.... Ifrmt://links do not open, make sure the RMT Client is installed.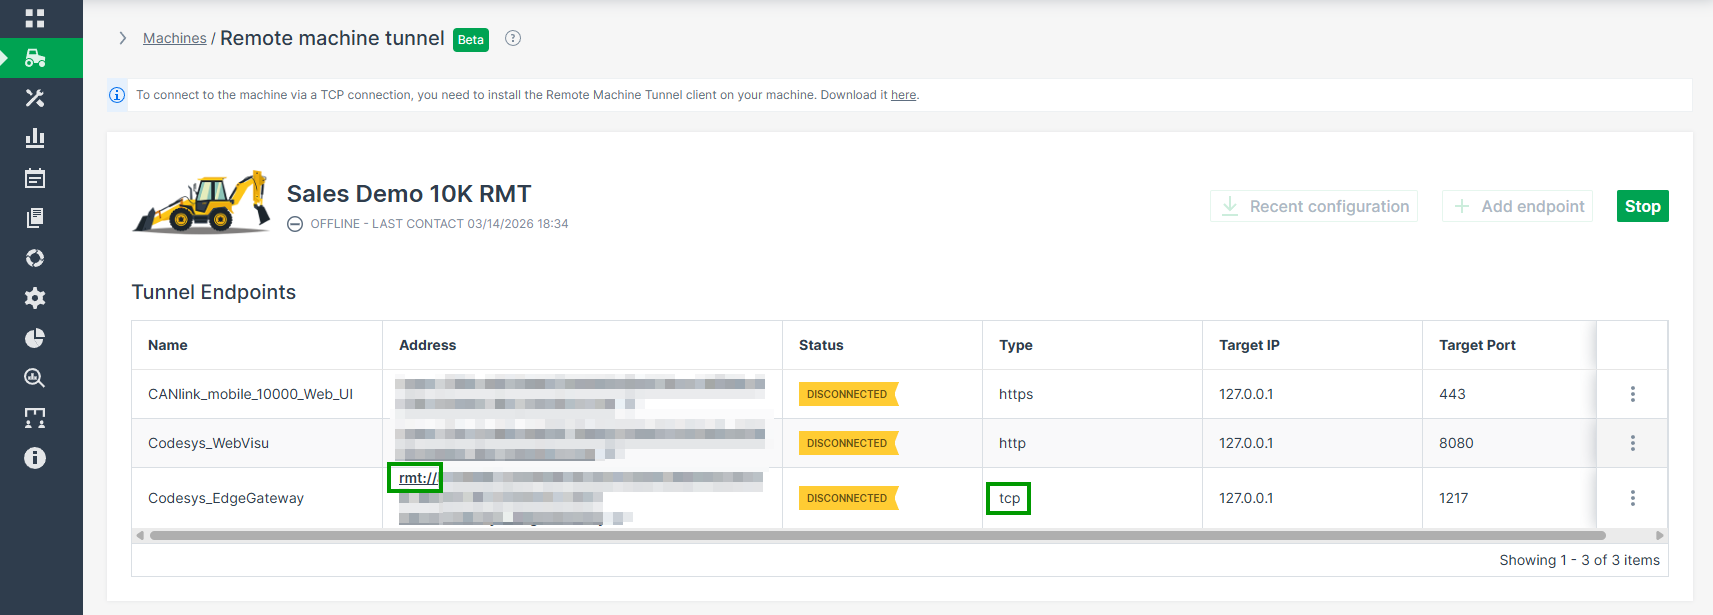
Figure 2: Address column -
In the browser prompt, select Open Remote Machine Tunnel Client to open the connection in the local client.
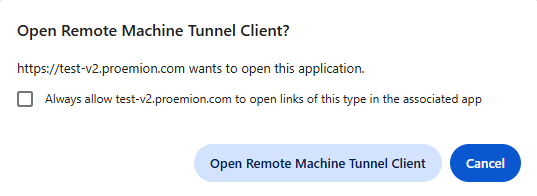
Figure 3: Browser prompt open RMT client -
In the local port configuration dialog, enter an available local TCP port. The valid port range is 0 to 65535, though ports > 1024 are typically used for custom applications.
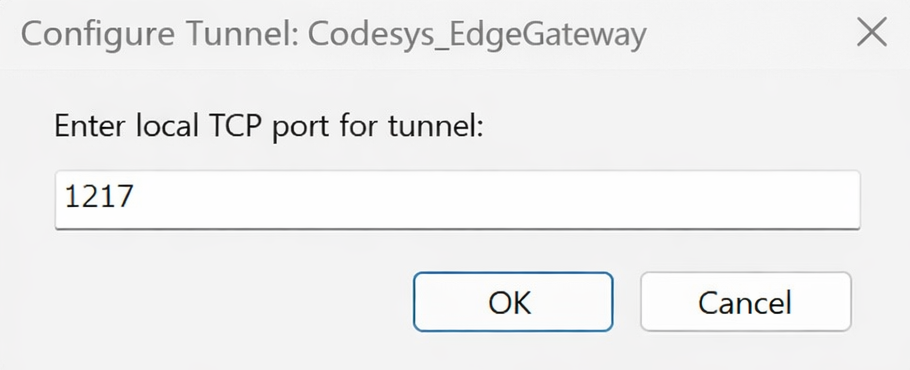
Figure 4: Local port configuration dialog -
Click OK. The tunnel starts automatically once a valid port is confirmed, and a system notification appears to confirm that the tunnel has been successfully added.
Your service tool (like CODESYS) can now connect to127.0.0.1:<local port>using the configured port.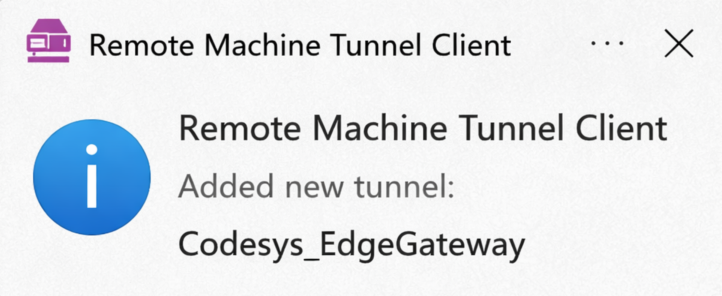
Figure 5: System notification
Manage tunnels
The RMT Client is located in the Windows notification area.
You can run multiple tunnels at the same time.
If the RMT client icon ![]() is not visible, select the arrow in the taskbar to show hidden icons.
is not visible, select the arrow in the taskbar to show hidden icons.
To manage tunnels, proceed as follows:
-
Right-click the RMT Client icon
 to view all active tunnels and their assigned local ports.
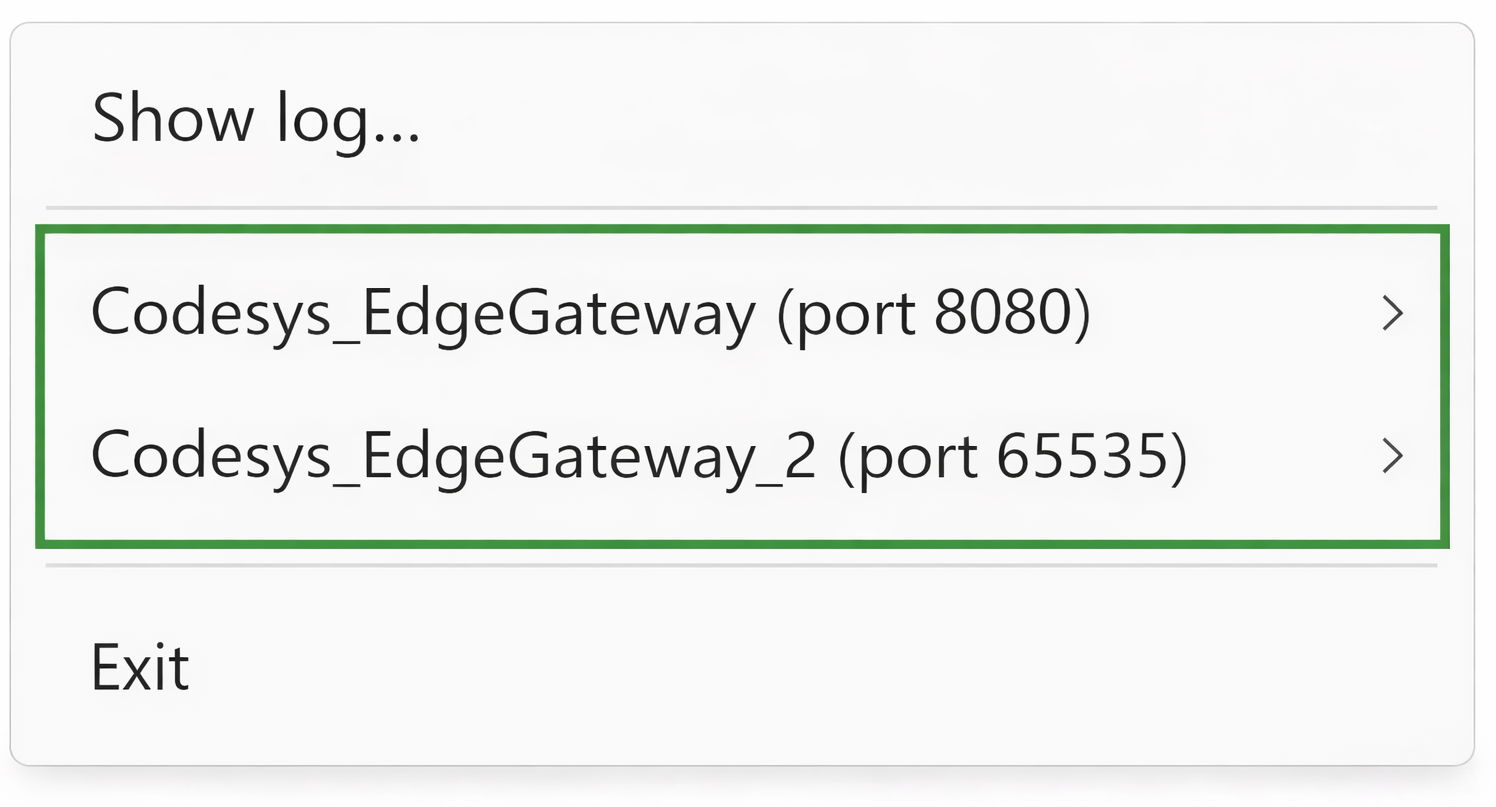
Figure 6: View active tunnels -
Click on the tunnel you want to manage to view all available tunnel options.

Figure 7: View tunnel options -
Hover over an individual tunnel option to access these controls.
Tunnel options
In the following table you find all available options with description.
| Option | Description |
|---|---|
| Start tunnel | Resumes a manually stopped tunnel. Tunnels start automatically upon creation. |
| Stop tunnel | Closes the local port and pauses the connection, but keeps the entry in your list for easy restart. |
| Copy local IP | Copies the loopback address (127.0.0.1) to your clipboard. |
| Copy local port | Copies the active port number to your clipboard. |
| Change local port... | Opens the port dialog. The tunnel is temporarily stopped while you assign a new port and restarts automatically once confirmed. |
| Close tunnel | Stops the connection and removes the tunnel from the list. To re-add it, you must click the link in the DataPortal again. |
Exit the RMT Client
To shut down the RMT Client, select Exit from the tray menu.
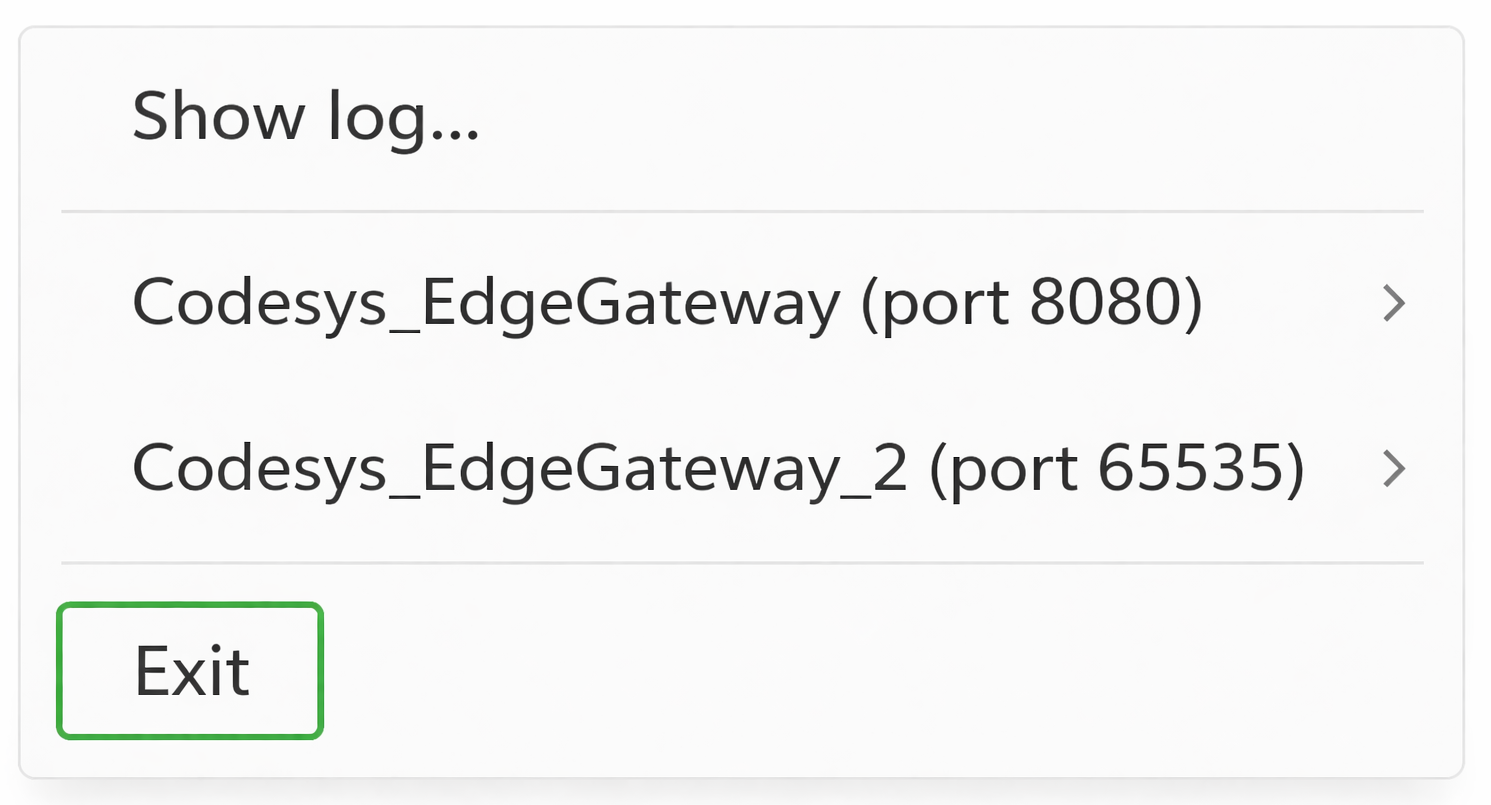
Note
The tunnel list is not saved when the application is closed. When you restart the RMT Client, it will always start with an empty configuration.
Troubleshooting
If you encounter issues when setting up or using a tunnel, check the following:
Port already in use
Problem:
The client prompts you again immediately after entering a port.
Cause:
Another application is already using the selected port.
Solution:
Use a different port (for example, between 8000 and 9000).
Link does not open
Problem:
Clicking the link in the DataPortal has no effect.
Cause:
The RMT Client is not installed.
Solution:
Install the RMT Client and try again.
Cannot connect to the service
Problem:
Your service tool cannot connect to the tunnel.
Cause:
The tunnel is not running.
Solution:
Right-click the RMT icon in the Windows notification area and check the tunnel status.
If the Start tunnel option is enabled, click to start the tunnel.
View logs
If you encounter connection issues, you can inspect the logs of the internal operations of the tool.
To do so, proceed as follows:
-
Right-click the RMT Client icon
. -
Click Show log. The Log window opens.
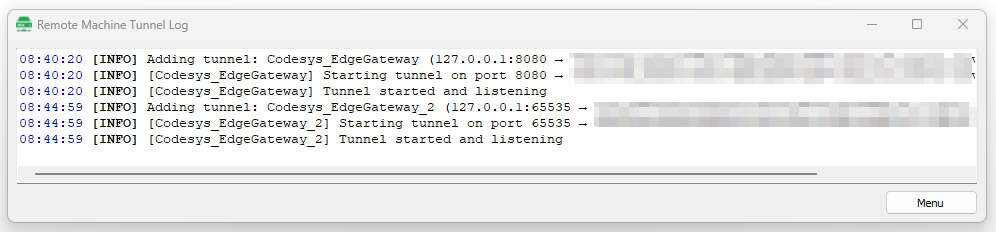
Figure 9: Log window
The Menu button in the log window provides quick access to the same options as the RMT Client icon.
Log entries
The log displays different levels of messages that help you understand the tunnel status and diagnose issues.
| Level | Description |
|---|---|
| INFO | Provides general information about the tunnel status and normal operation. |
| WARNING | Indicates a temporary connection issue. The client may reconnect automatically. |
| ERROR | Indicates a firewall, network, or permission issue blocking the connection. |
Maintenance Tasks
Maintenance Process Overview
The maintenance process in the DataPlatform is enabled by the Maintenance Planner, a feature that automates the planning and management of machine maintenance based on telematics data.
It supports OEMs and service organizations in ensuring timely maintenance execution and improving maintenance coverage.
This section provides an overview of how maintenance tasks are triggered and managed using telematics data and DataPlatform capabilities.
Telematics data enables condition-based and usage-based maintenance by providing continuous insight into machine operation.
Maintenance processes rely on OEM-defined maintenance manuals. For Maintenance Planner in the DataPlatform these are translated into digital maintenance catalogs that specify intervals, activities, and required materials for each machine model.
Maintenance tasks are generated based on these definitions and can be managed within the DataPortal or integrated with external ticket systems.
The following diagram illustrates the overall maintenance workflow, from data acquisition to task execution and completion.
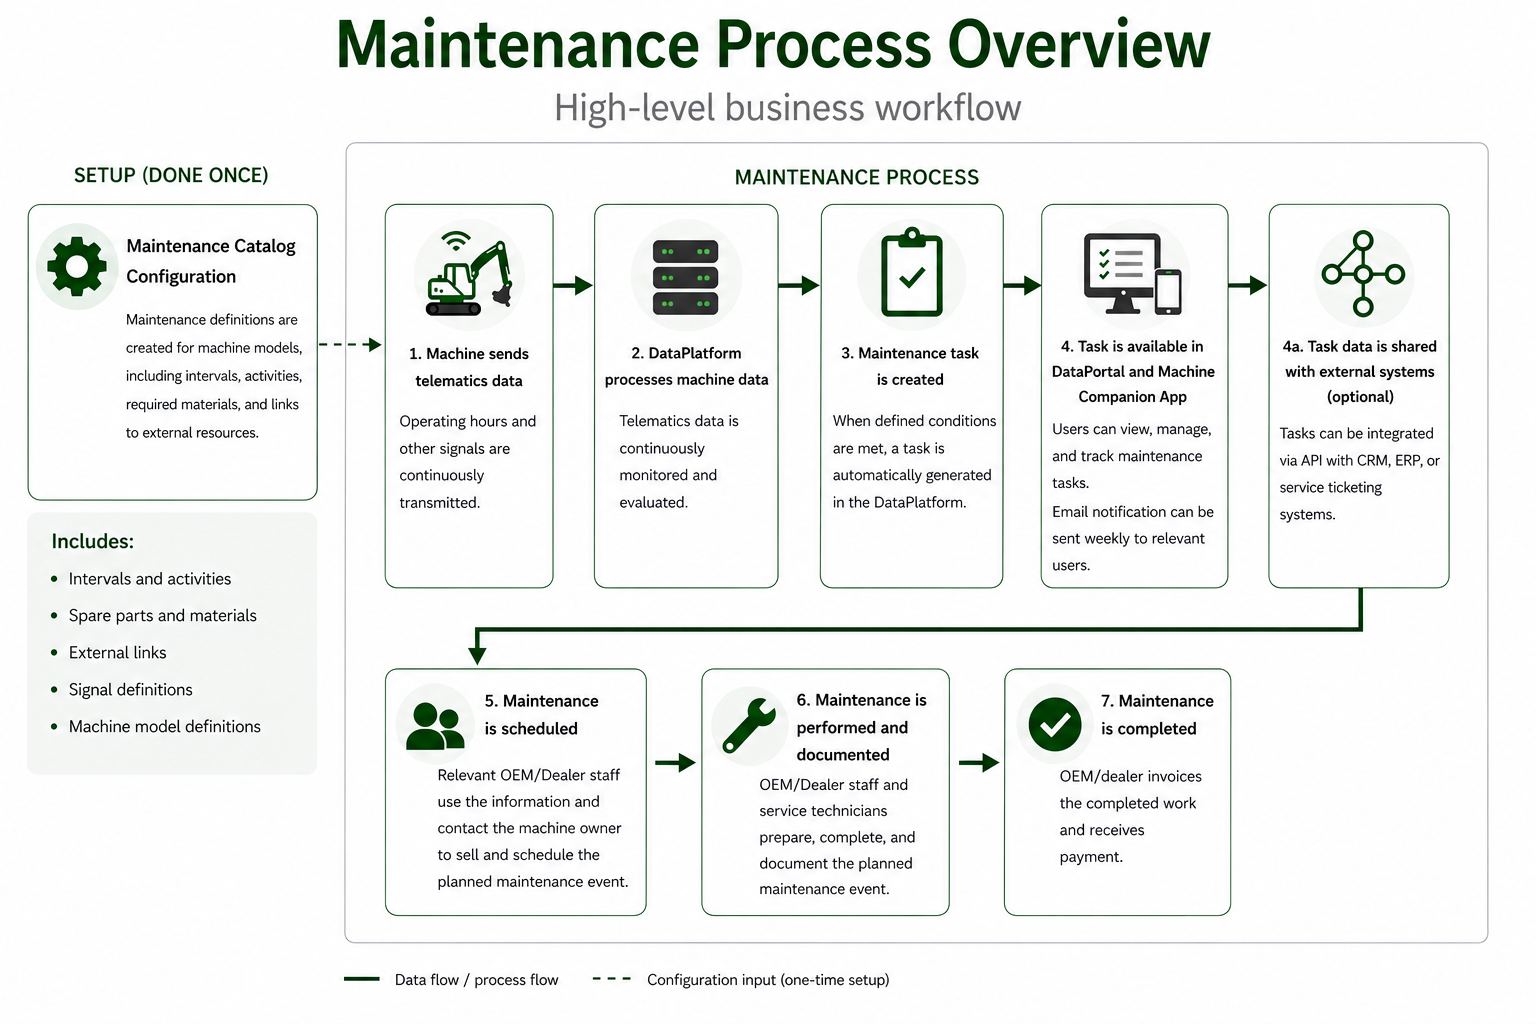
Prerequisites and Setup
The following prerequisites must be met to set up and operate maintenance processes effectively.
These prerequisites cover:
- the data and configuration required to create maintenance tasks, and
- the DataPlatform setup required to manage and assign those tasks.
Telematics Data
Telematics data for maintenance execution is collected and processed by the DataPlatform.
Maintenance can be based on the following signals:
- Machine operating hours.
- ECU-indicated maintenance (e.g. hours to next service counter)
- Wear indication such as brush diameter.
- DTCs - Diagnostic Trouble Codes. When specific DTCs occur, maintenance tasks can be scheduled.
Machine Model Alignment
Maintenance tickets usually contain a description or a list of activities needed which are specific to the machine models. Machine models configured in the DataPlatform must be aligned with the maintenance requirements of the corresponding machines.
Maintenance Catalog
Maintenance processes rely on maintenance catalogs that define intervals, activities, and required materials. The OEM's maintenance manuals' prescription are translated into a digital format that can be used by the Maintenance Planner in the DataPlatform.
For details, see Maintenance Catalog.
DataPlatform Setup
Maintenance Tasks must be activated via Feature Switches. Scheduled Maintenance and Maintenance issues have separate feature switches.
For efficient maintenance organization, service personnel from service centers must be represented in the DataPortal.
This includes:
- setting up appropriate Organizational Structures and
- adding users and assigning maintenance tasks via User Management and Task Assignment.
This enables better workload distribution across the service organization by assigning individual maintenance tasks to service personnel.
Task Management
Maintenance tickets must be monitored by operational staff.
This is required to:
- schedule maintenance activities with the machine owner
- support the coordination of service execution, especially when no regular service contract with the service center is in place.
This ensures that service centers maintain a continuous and well-balanced workload and that upcoming maintenance activities are executed in a timely manner.
It can also support the identification of opportunities for additional service offers and spare parts sales.
Process Alignment
Maintenance processes should be aligned among all stakeholders (partners, service and operational personnel), to ensure consistency and efficiency.
This includes understanding the specific tooling that will be used and the business processes that are part of efficient maintenance business processes.
Maintenance Catalog
A maintenance catalog defines maintenance requirements for machines based on predefined intervals, activities, and related resources.
It is defined using YAML configuration files.
For details on the configuration structure and available parameters, see Maintenance Planner.
For a complete example, see Maintenance Catalog example.
Catalog Content
A maintenance catalog is configured based on the data you provide. Some of this information can be derived from the Proemion device manuals if required.
The following sections describe the main components of a maintenance catalog.
Intervals and Activities
Maintenance is organized in intervals based on a defined base such as operating hours.
Each interval defines a specific maintenance scope and includes a set of activities.
Typical activity types include:
- Check
- Replace
- Change
- Inspect
- Lubricate
- Test
- Service
Spare Parts and Materials
Maintenance intervals can include predefined sets of required spare parts and materials, typically grouped into kits.
External Links
Maintenance entries can include links to external resources such as:
- Spare part ordering portals
- Parts catalogs
Signals
Maintenance tasks are triggered based on telematics data.
Examples of signals:
- Machine operating hours. This is the most common setup.
- ECU indicated maintenance can be implemented in various ways, including a decreasing hours to next service counter. A maintenance task can be created when this counter approaches 0, but without additional information different maintenance task types cannot be distinguished.
- Wear indications (e.g. brush diameter)
- DTCs - Diagnostic Trouble Codes
Machine Models
Maintenance definitions are specific to machine models.
The machine models in the DataPortal need to be aligned with the maintenance requirements for those machines.
Relationship to Maintenance Tasks
A maintenance catalog is used to generate maintenance tasks based on:
- Defined intervals
- Signal values
- Maintenance logic configured in the catalog
Each task contains:
- Descriptions
- Activities
- Required materials
- References to external resources
Maintenance Tasks Overview
This documentation provides an overview of the Maintenance Tasks feature and describes how maintenance tasks are displayed, filtered, and managed in the DataPortal.
Note
The behavior and configuration of maintenance tasks can vary depending on the manufacturer's requirements and implementation.
Maintenance Tasks is available in two views: the default Table View (left) and the old Card View (right).
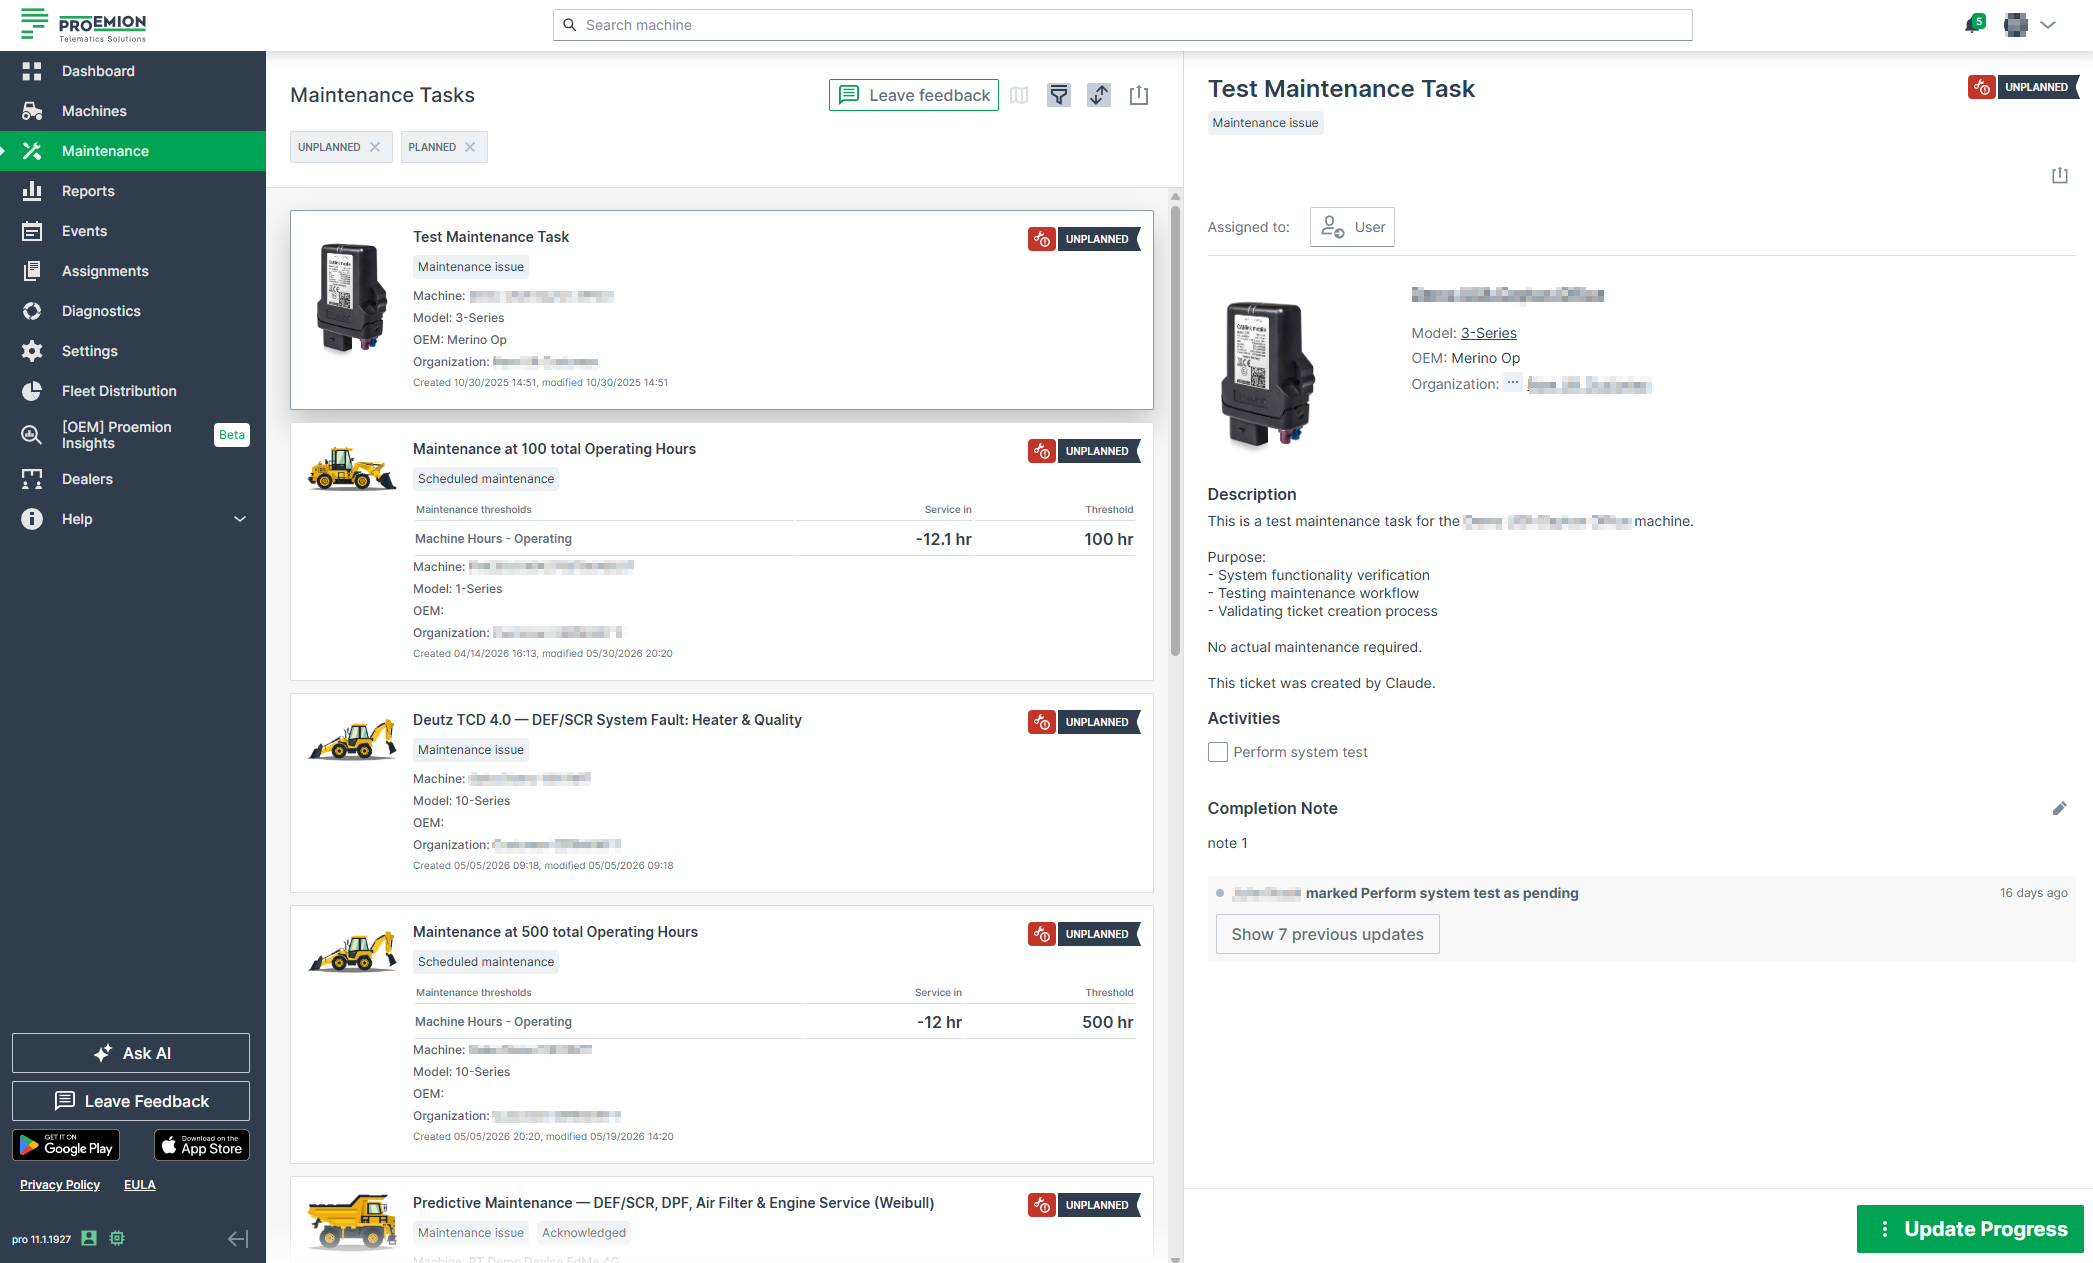
Related Topics
| Topic | Description |
|---|---|
| Process Overview | How maintenance tasks are triggered and managed using telematics data |
| Prerequisites | Requirements for setting up maintenance processes |
| Catalog | Defines intervals, activities, and materials for maintenance tasks |
| Filters | Filter tasks by type, progress, deadline, and more |
| Activities | Optional checklist shown instead of the Description list |
| Completion Note | Add information regarding the maintenance task |
| Acknowledge Maintenance Tasks | Shows who has acknowledged the completion of the maintenance task |
| History | Lists all actions performed on the maintenance task |
| Assign Task | Assign maintenance tasks to users |
| Update Task | Mark a maintenance task as planned, skipped, or completed |
| Print Maintenance Tasks | Print individual or filtered lists of tasks |
| Permission Sets | Required permissions for viewing and managing maintenance tasks |
| Dealers | Contact the service location of your dealer |
Table View
The Table View is the default view for Maintenance Tasks, see Maintenance Tasks Overview.
Note
The behavior and configuration of maintenance tasks can vary depending on the manufacturer's requirements and implementation.
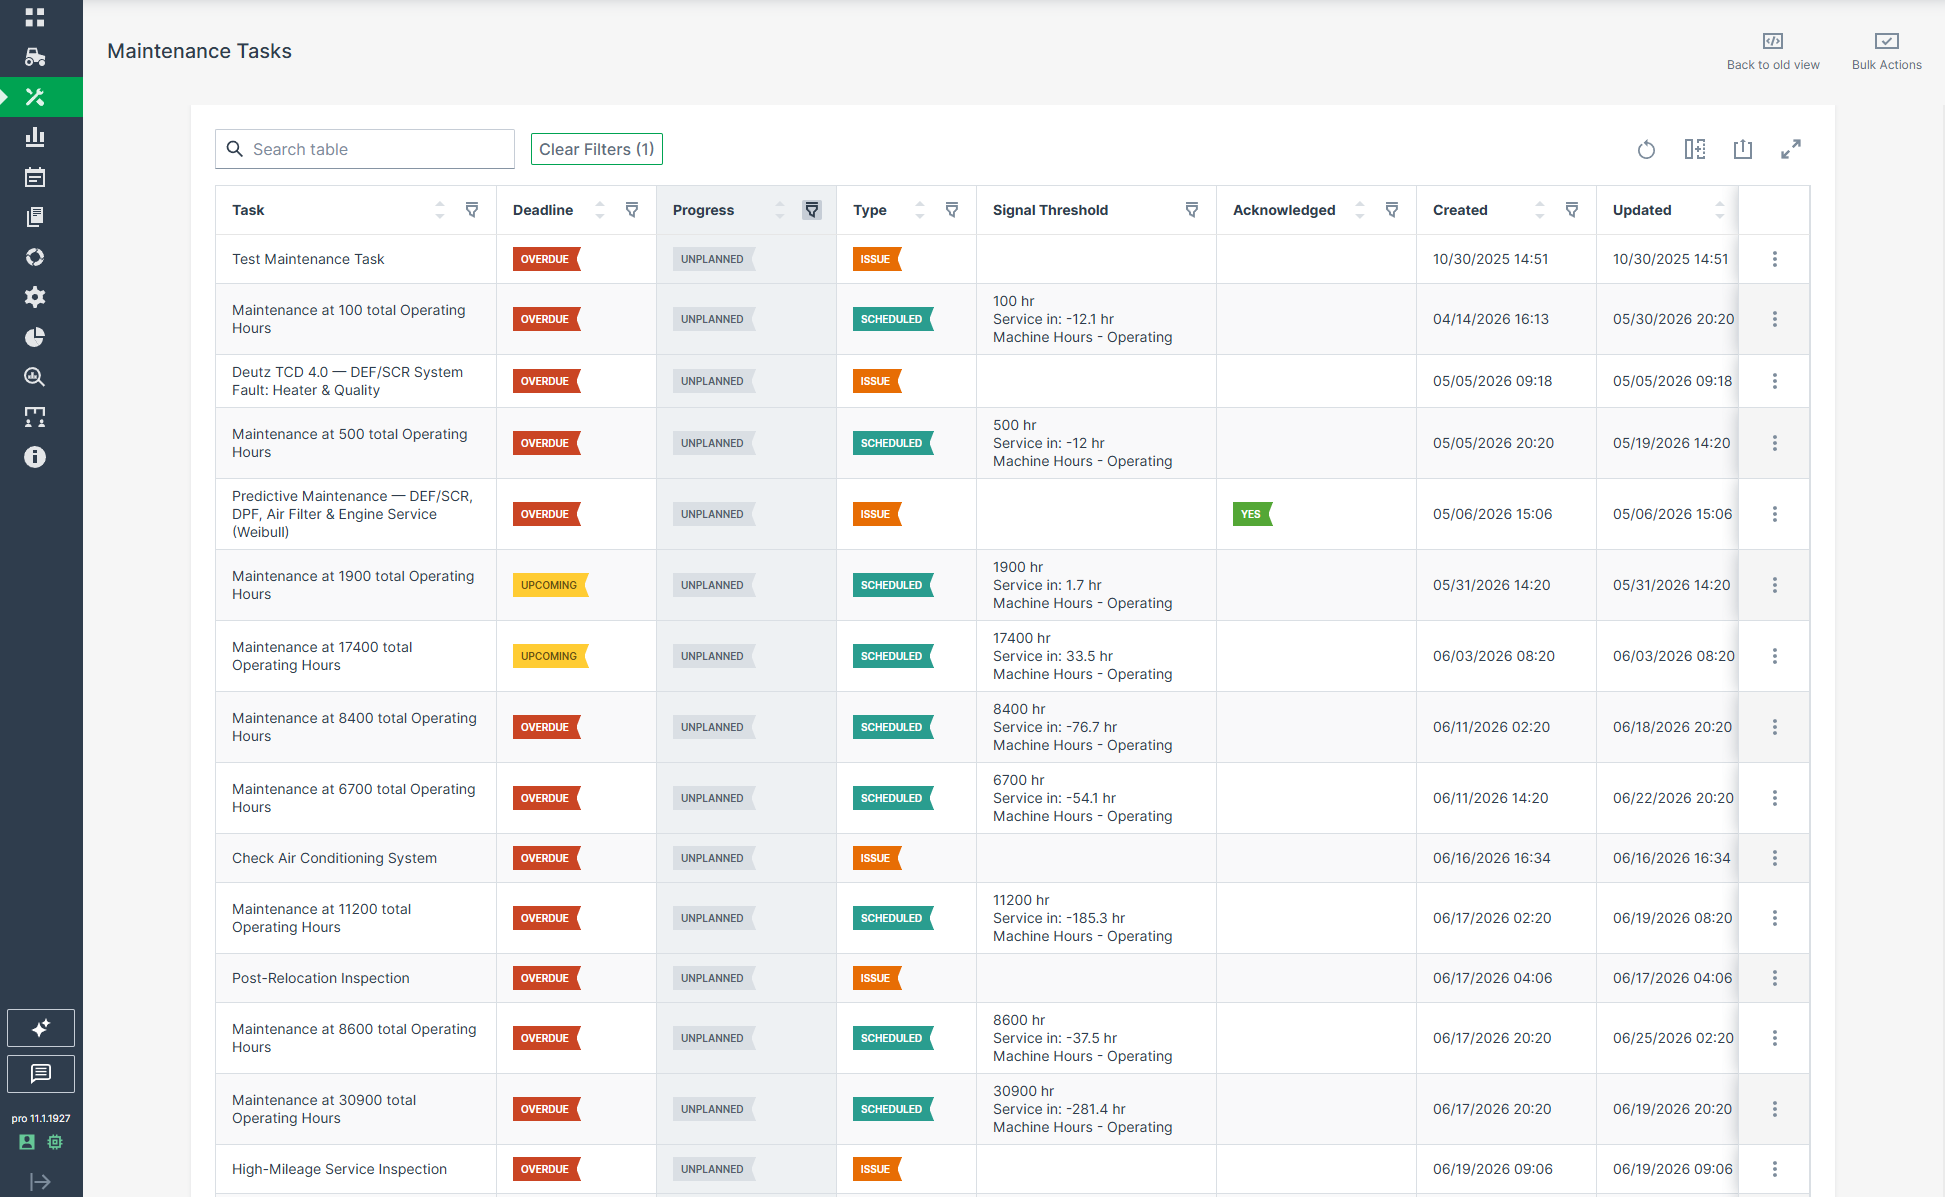
Maintenance Task Table
The following columns are available for each task and can be shown, hidden, or reordered. Most columns can also be filtered individually via the filter icon in the column header, see Filters:
- Maintenance type - Scheduled maintenance or Unscheduled maintenance
- Deadline - Upcoming or Overdue, shown as a colored label with tooltip
- Progress - Unplanned, Planned, Skipped, or Completed, shown as a colored label with tooltip
- Signal threshold (e.g. operating hours)
- Date threshold (calendar-based maintenance)
- Created / Updated
- Assigned user
- Description or Activities
- Completion Note
- Acknowledgement
Depending on the defined maintenance workflow, Deadline and Progress states might be set by the Maintenance Planner, see Maintenance YAML configuration explanation.
The table supports the standard table functions:
- Search
- Export to CSV or XLSX, see Print list of tasks
- Resizing for a larger screen view
Single Task Actions
Each task row provides access to individual actions via the three-dots menu. Clicking anywhere on a row opens the task detail view without using the three-dots menu.
| Action | Description |
|---|---|
| View task | Opens the task detail view (same as clicking anywhere on the row) |
| Mark as planned / skipped / completed | Changes the progress state directly without opening the task detail view, see Update Task |
| Show signal in plots | Opens the Plot Report pre-configured with the machine and signal driving the maintenance task |
| View machine | Navigates to the Machine Page of the machine associated with the task, showing machine state, diagnostics, and operating data |
| Print task | Opens the print dialog for the individual task, see Print Maintenance Tasks |
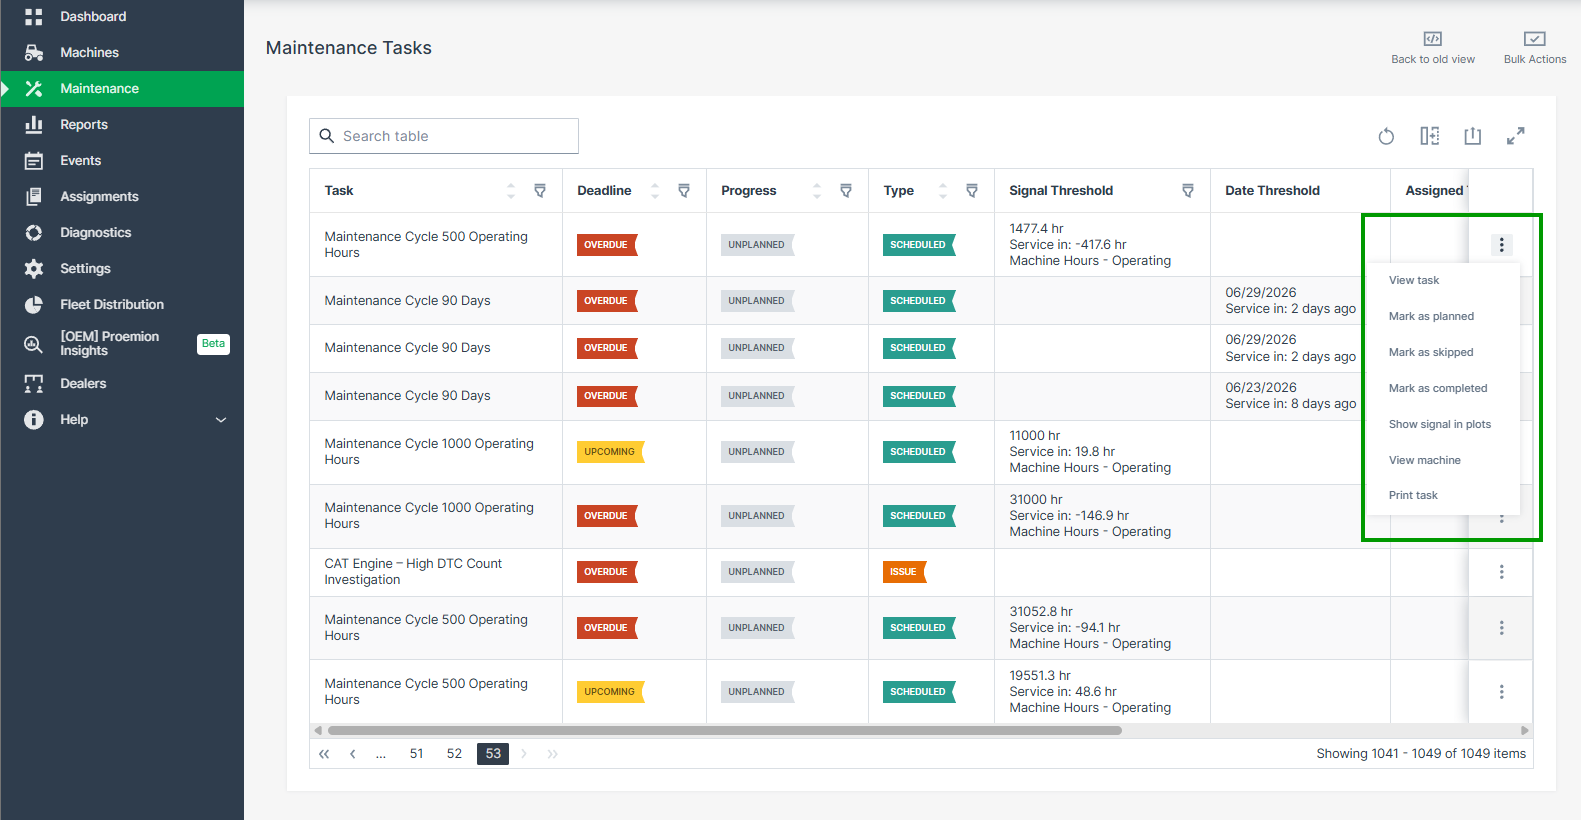
Bulk Actions
Use bulk actions to apply the same change to multiple tasks at once, without opening each task individually.
Click Bulk Actions at the upper right to enable multi-selection of maintenance tasks. Select the desired tasks using the checkboxes, then click Choose Actions to open the bulk edit dialog.
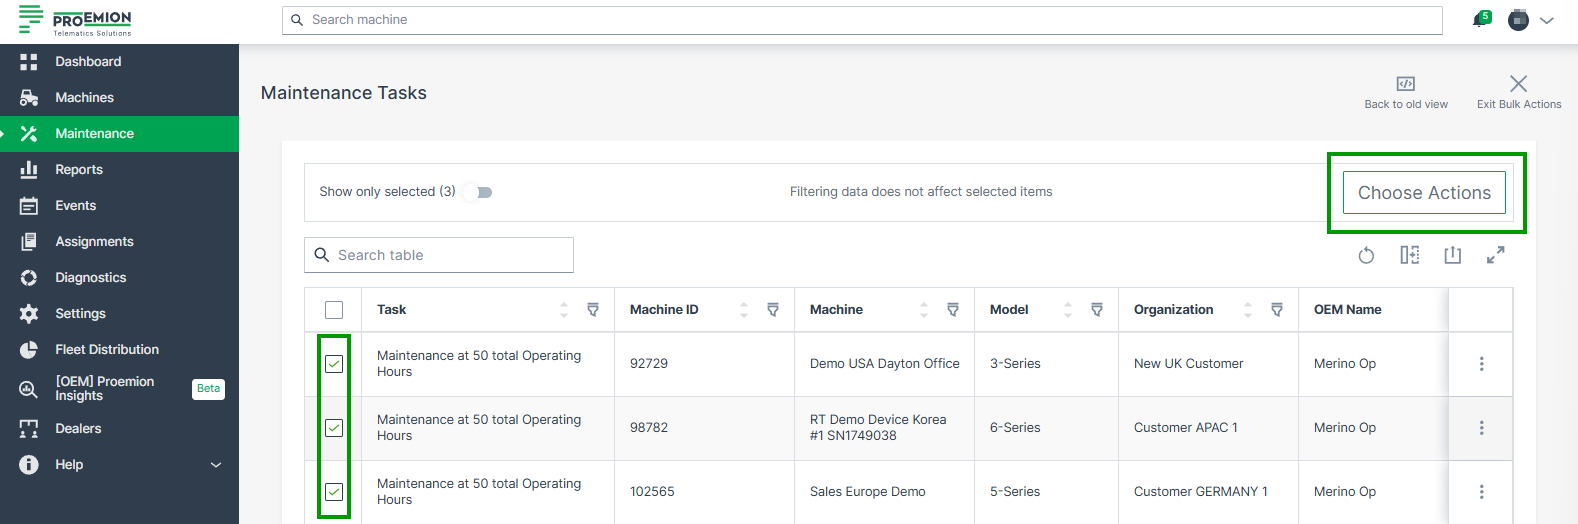
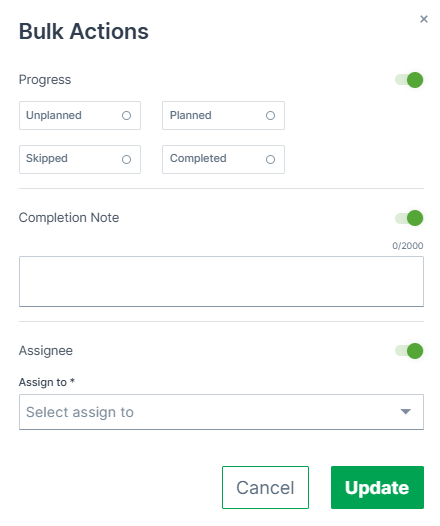
Bulk actions support:
- Progress: set the progress state (Unplanned, Planned, Skipped, or Completed) on all selected tasks at once
- Completion Note: add or delete a completion note (up to 2,000 characters) on all selected tasks at once
- Assignee: assign a user to or remove a user from all selected tasks at once
Each section can be toggled on or off in the dialog. Click Update to apply the changes.
Selecting Show only selected displays only the selected rows, independent of the active page or any applied filters. Active filters do not affect the current selection.
Selecting Select all is limited to 50 results. When assigning a user during a bulk action, the assignee list is not searchable.
Note
Submitting an empty Completion Note during a bulk action deletes the existing Completion Note on the selected tasks, unless the Completion Note has been configured as mandatory - in that case, an empty note shows a validation error instead, see Completion Note.
Task Detail
The task detail view shows:
| Item | Description |
|---|---|
| Deadline / Progress / Type | Shown as colored labels |
| Maintenance Thresholds | Shown for scheduled maintenance tasks based on a signal. Displays the signal name, Latest value, Service in value, and Threshold. Click View latest value in plot report to open the Plot Report for the signal. Not shown for unscheduled maintenance issues. |
| Assigned to | Assign a user to the task, see Assign Task |
| Machine | Name, model, OEM, and organization of the associated machine |
| Description | The maintenance task description |
| Activities | Optional checklist of steps to complete, grouped by category where configured. Can be shown instead of Description. |
| Completion Note | Add information regarding the task |
| Document links | Links to external resources such as spare part ordering portals or documentation, configured via the Maintenance Planner |
| Acknowledgement | Shows who has acknowledged the completion of the maintenance task |
| History | Chronological list of all actions performed on the task |
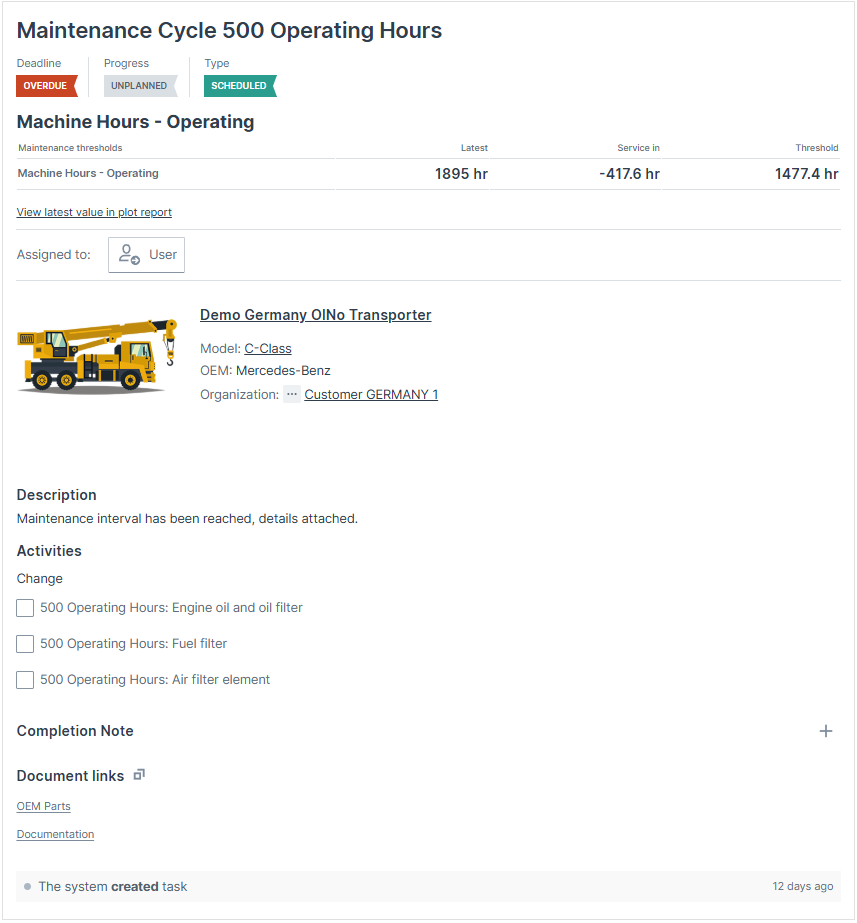
When a maintenance task is completed, click Mark as... > Mark as completed in the header, see Update Task.
Assign Task
Maintenance tasks can be assigned to service technicians directly from the task detail view.
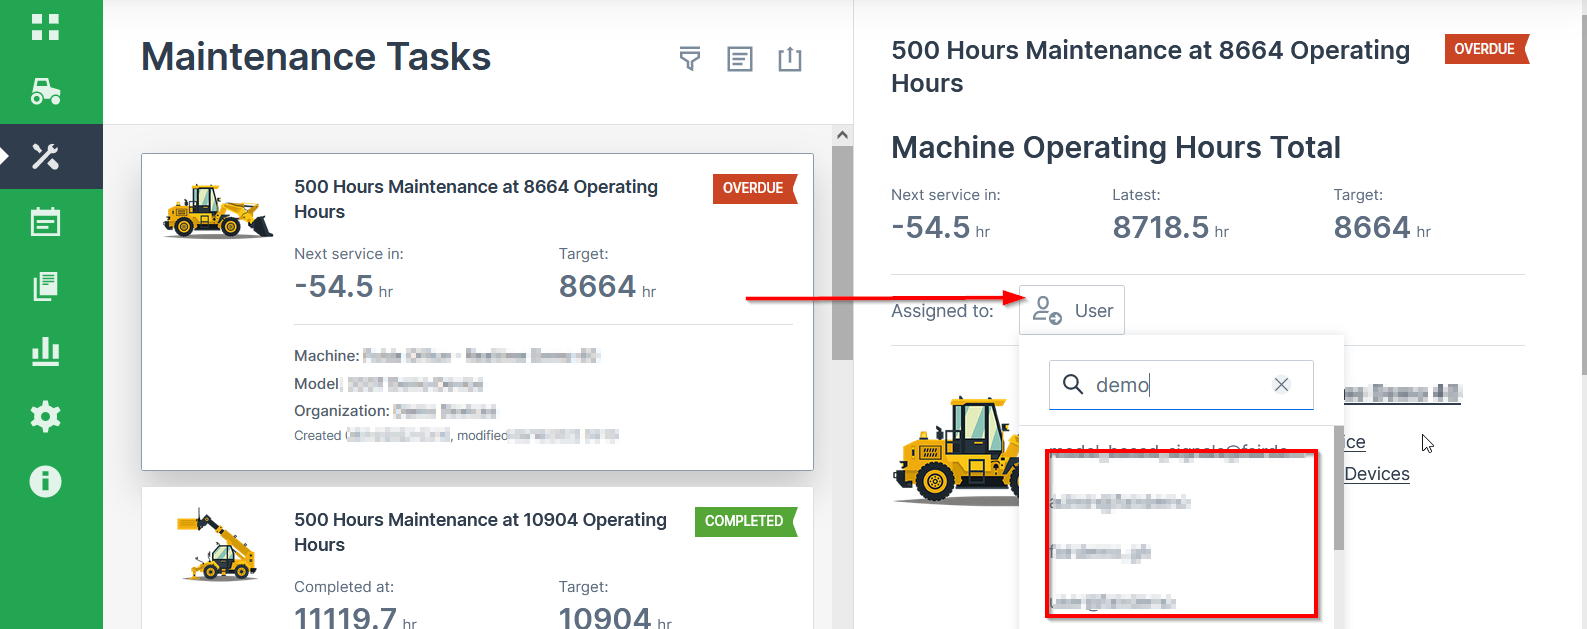
- Open the desired Maintenance Task.
- Choose from the list of eligible users in the Assigned to field. You can also search by name.
The user is now assigned to the Maintenance Task.
To unassign the user, click the delete icon next to the name:
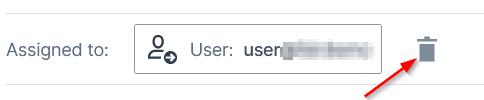
Note
If the permission of the assigned user changes to a lower level, the user will be automatically unassigned.
Acknowledge Task
Acknowledging a maintenance task means adding a signature to confirm the completion of the task. Once signed, the maintenance task shows the Acknowledgement section.
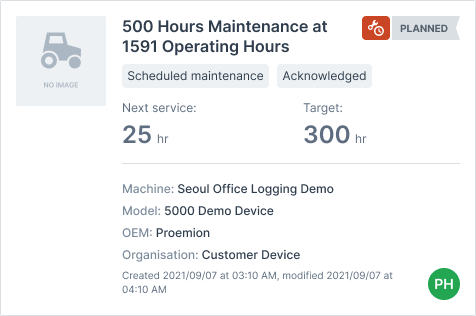
Click Show image to view the signature. This is only available to users with Maintenance Task:Admin Permission Set.
Machine Owners can see the completion note and that the task was acknowledged for completed tasks only.
Update Task
The Mark as... menu at the top of the task detail view can be used to set a task's progress to Planned, Skipped, or Completed. The menu is not displayed for skipped maintenance tasks.
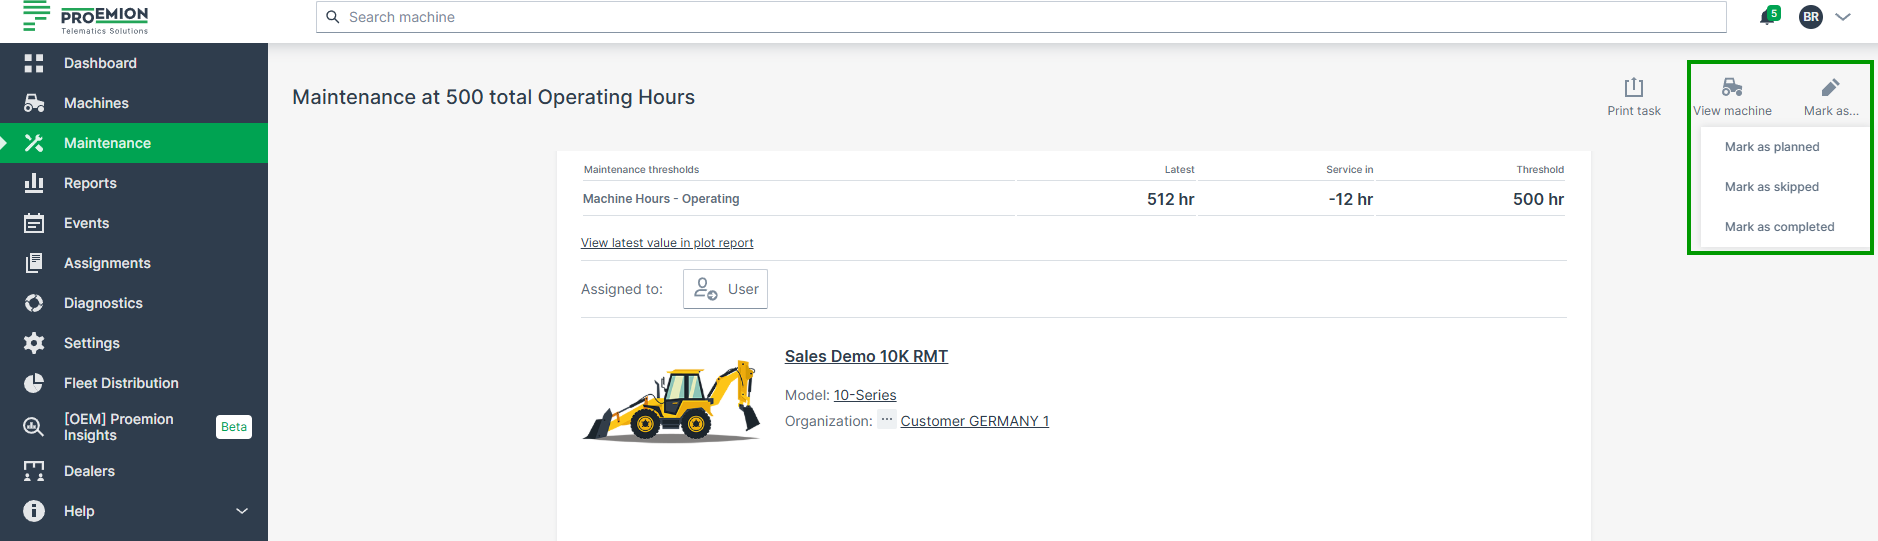
To complete the maintenance task, click Mark as... and select Mark as completed. A confirmation dialog is displayed:
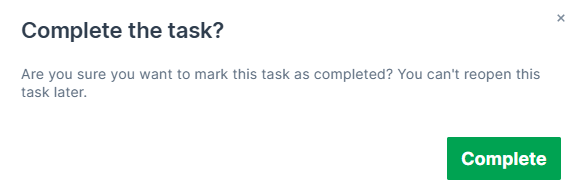
Confirming with Complete changes the Progress of the maintenance task to Completed and iterates/resets the Service Cycle. This action cannot be undone.
Note that a maintenance task may be closed despite pending Activities.
Switch to Card View
To switch to the Card View, click Back to old view at the upper right of the table.
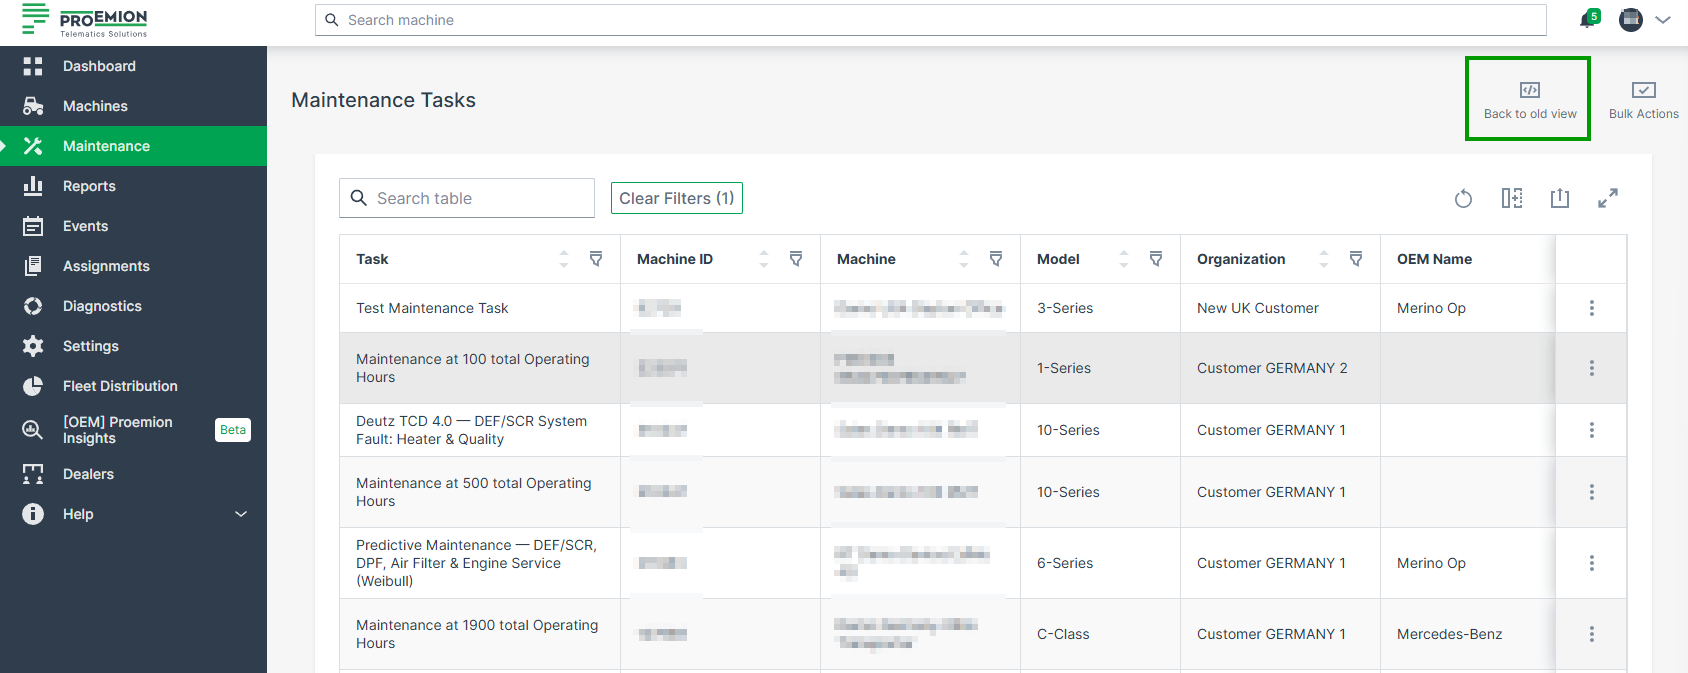
Card View
The Card View is the old view for Maintenance Tasks, see Maintenance Tasks Overview.
Note
The behavior and configuration of maintenance tasks can vary depending on the manufacturer's requirements and implementation.
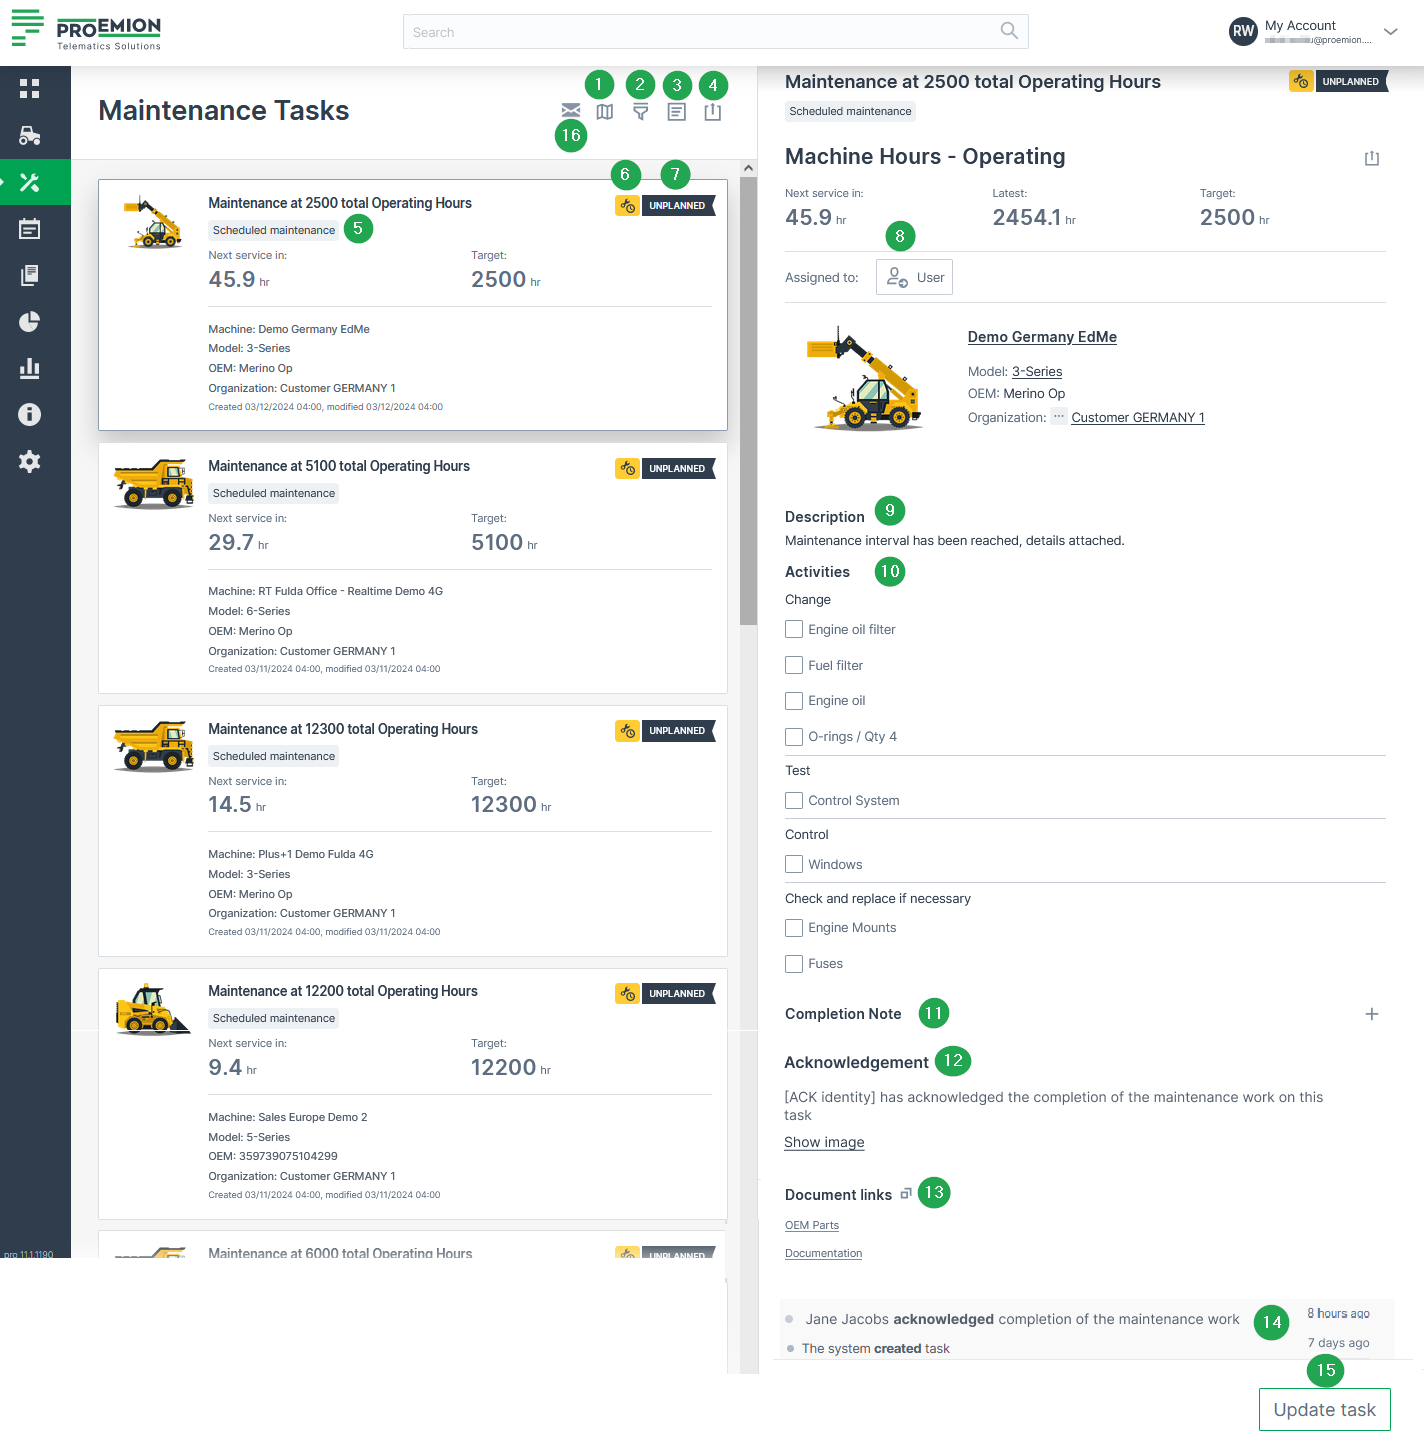
Task List
Maintenance tasks are displayed as a list of cards. Each card shows:
- Maintenance type indicator, see Maintenance Task Types: Scheduled maintenance or Unscheduled maintenance
- Deadline and Progress state, shown as a colored icon combined with a text label (e.g. Upcoming/Overdue, Unplanned/Planned/Skipped/Completed)
- Machine, model, OEM, and organization
- Created and updated dates
Depending on the defined maintenance workflow, Deadline and Progress states might be set by the Maintenance Planner, see Maintenance YAML configuration explanation.
Above the list:
- The map icon
 forwards you to the Machine Map where you can view machines with upcoming and overdue Maintenance Tasks.
 - Filter tasks by Type, Progress, Deadline, Organization/Machine/Model, Assigned to, Total service cycle, or Time, see Filters
- Active filters are shown as removable tags above the task list
- Sort by Newest, Oldest, or Last Modified
- Export/Print list of tasks as CSV, XLSX, or PDF
Task Detail
Clicking a card opens the task detail panel, showing:
- Assign Task to User - the user's initials are added to the Maintenance Task
- Description, or Activities shown instead as a checklist
- Completion Note
- Acknowledge Maintenance Tasks
- Document links, added via the Maintenance Planner
- History of all actions performed on the task
For details on assigning tasks, acknowledging tasks, and updating the progress, see Table View - the process is identical in both views.
When a maintenance task is completed, click the Update Progress button and mark the task as completed, skipped or planned.
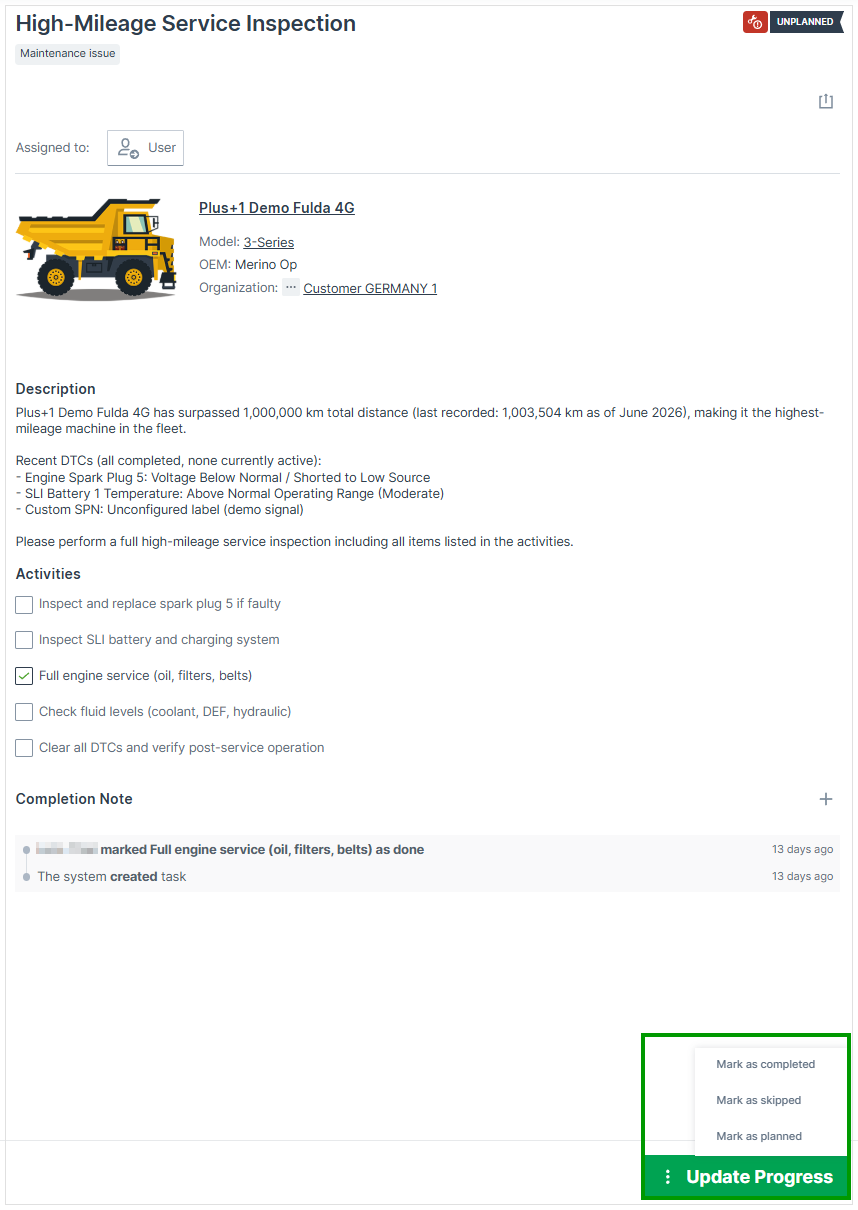
Leave Feedback
Use this feature to explain why you switched back from the Table View and what prevented you from continuing to use it.
A Leave feedback button is shown after switching back from the Table View.
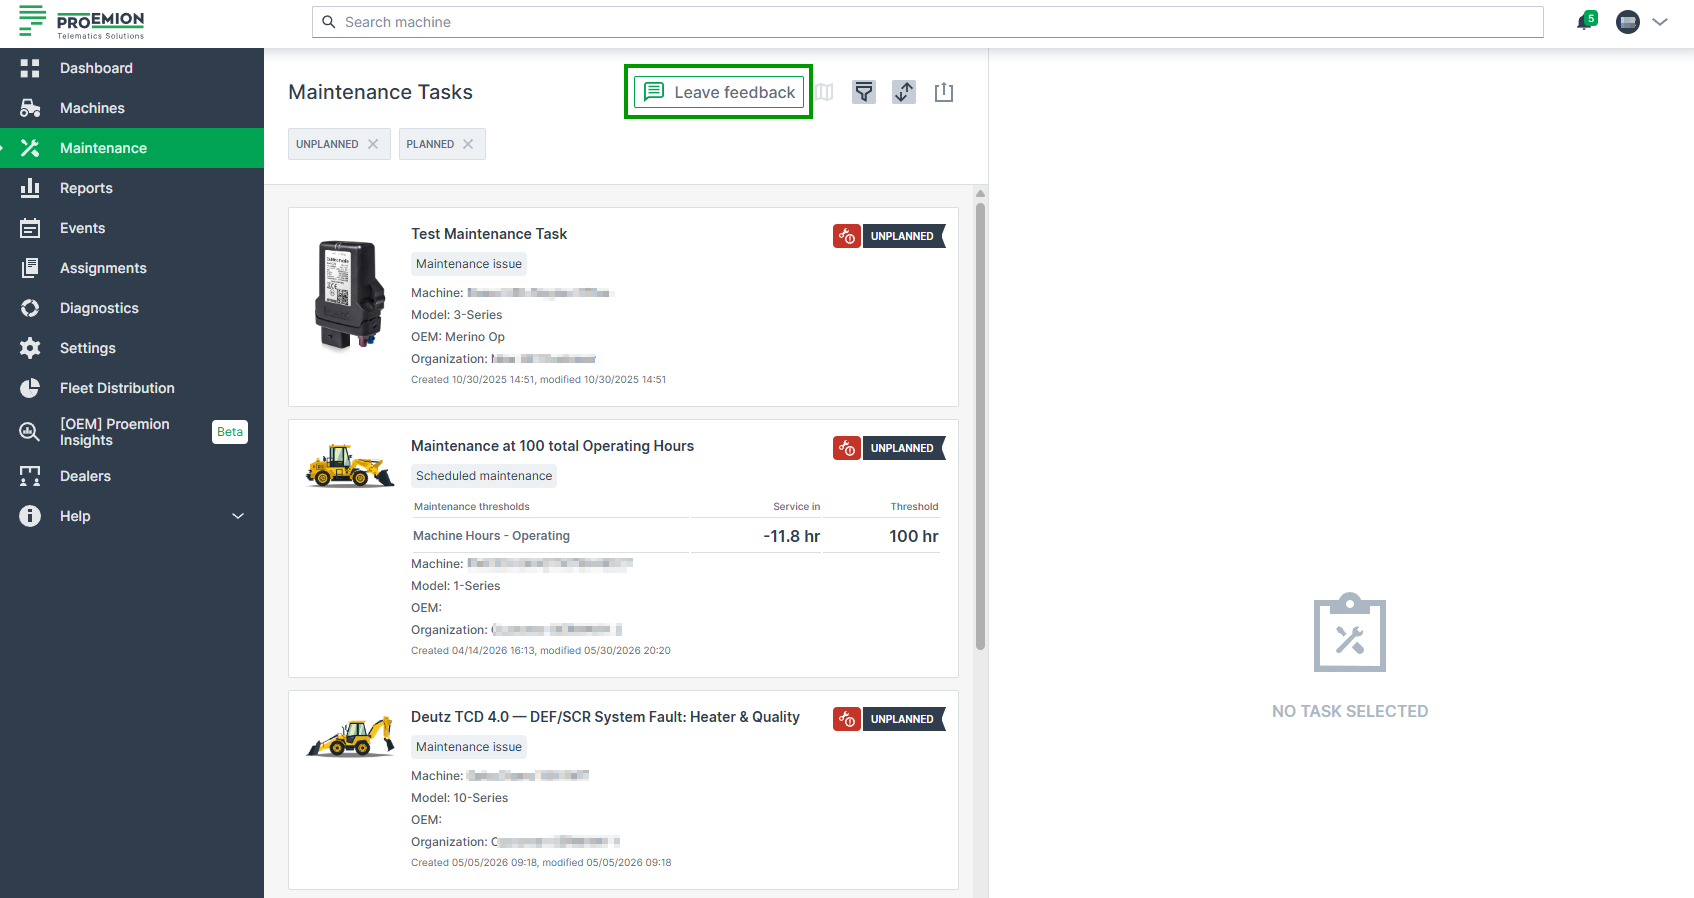
Clicking Leave feedback opens the following form:
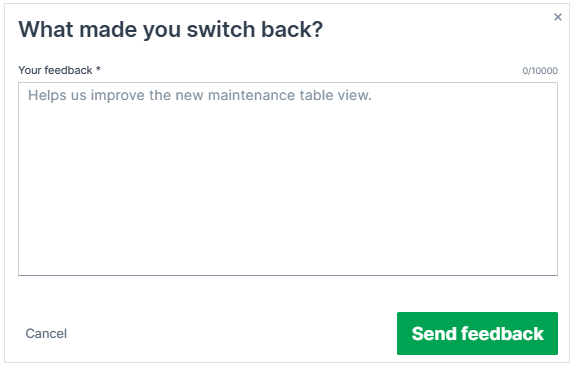
Maintenance Task Types
This section explains the different types of maintenance tasks, how they are created, and how they are managed.
Scheduled Maintenance
Scheduled maintenance tasks are based on the Service Cycle, DTCs, faults, or other regular intervals and are implemented by the manufacturer via the Maintenance Planner.
Maintenance Issues
Unscheduled tasks, so-called Maintenance Issue, can be created by manufacturers and machine owners for tasks that need to be done in between service cycles, using the REST API call Create Maintenance Task.
Dealers and machine owners are able to view and manage tasks, such as adapting the state or adding a Completion Note.
Both scheduled and unscheduled maintenance tasks undergo the same progress from Unplanned to Completed and can have the same deadlines Upcoming and Overdue.
Hours-to-next-service
Maintenance tasks can also be based on hours-to-next-service. In this case, a decrementing, resetting signal is used to create the next maintenance task, in contrast to scheduled tasks which use an incrementing, non-resetting operating hours counter.
You can choose between hours-to-next-service or scheduled maintenance task types.
Consider that in the Machine Companion App Manual, a mix of maintenance tasks based on the signals hours-to-next-service and operating hours is used.
Filters
Filtering options depend on the view you are using, the Table View or the Card View.
Table View Filters
Most table columns support the standard column filter, including text search and date-time/numeric range filters, see Table Options.
Maintenance-specific columns that can be filtered include Deadline, Progress, Type (see Maintenance Task Types), Acknowledgement, and Signal Threshold.
The Date Threshold column does not currently offer a filter.
The Organization column filter also includes machines shared into the selected organization.
Card View Filters
Click the filter icon to open the filter dialog. Select the desired filters and click Apply Filters to apply them, or Clear All to reset all filters.
| Filter | Options |
|---|---|
| Deadline | Upcoming, Overdue |
| Progress | Unplanned, Planned, Skipped, Completed |
| Type | Scheduled maintenance, Maintenance issue |
| Acknowledgement | All tasks, Acknowledged only, No acknowledgement |
| Organization | Select by organization. Also includes machines shared into the selected organization. |
| Machine | Select by machine, see Machine Selector |
| Model | Select by model |
| Assigned to | All, or select a specific user |
| Total service cycle | All cycles, or select a specific cycle |
| Time | Filter by Created or Updated date |
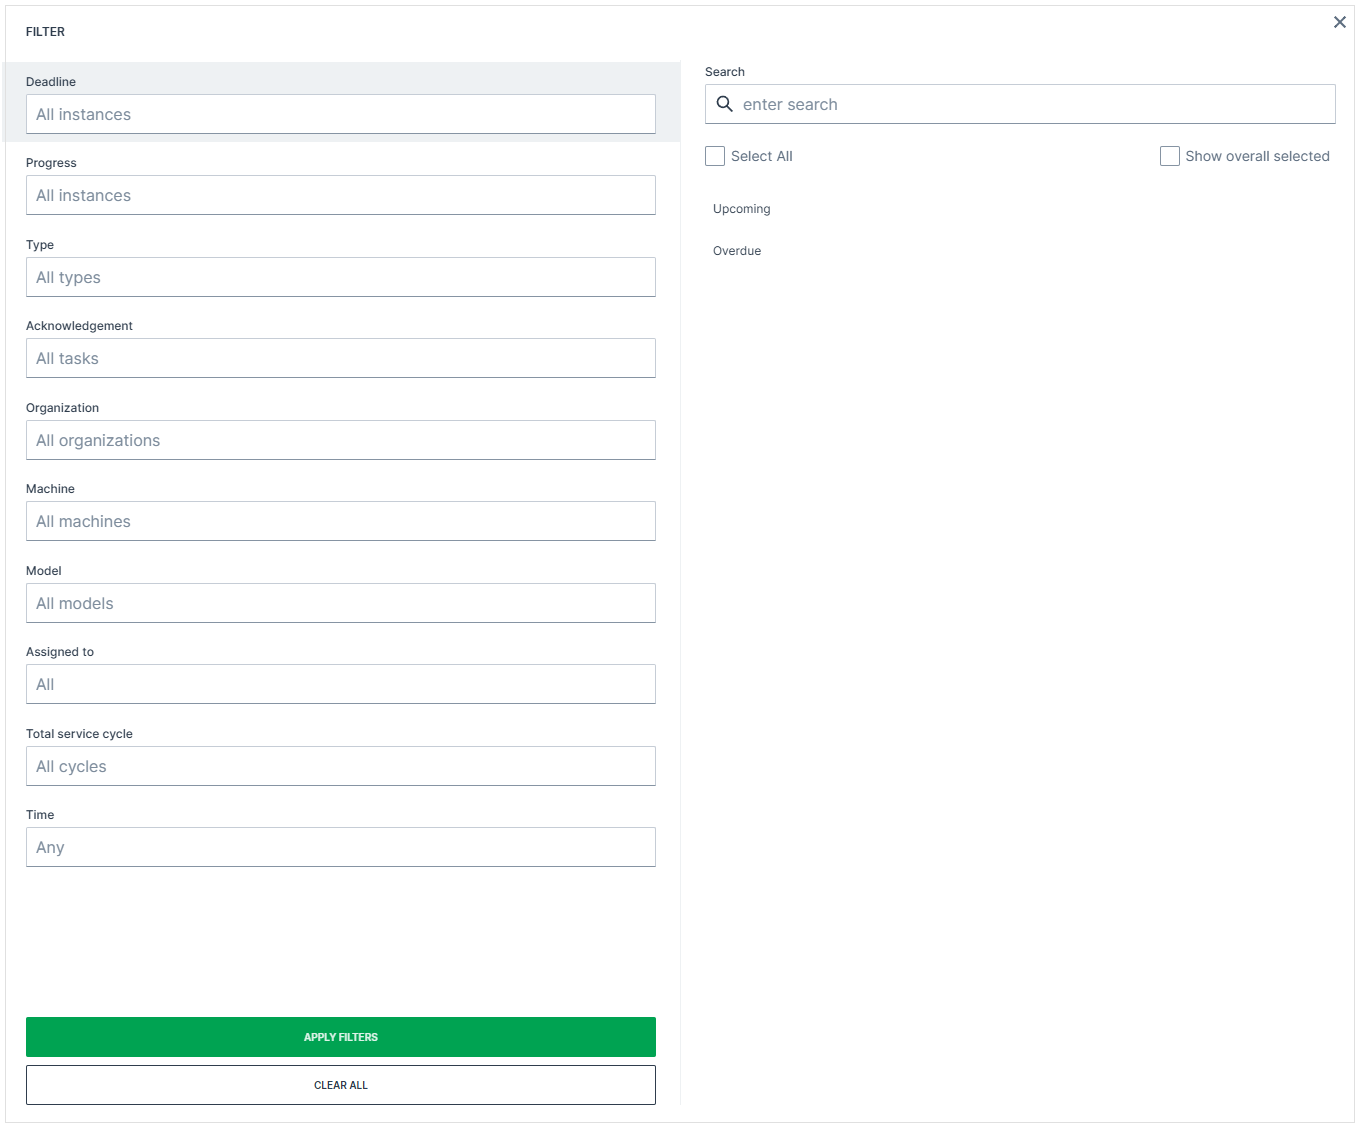
These filters are also useful when exporting or printing maintenance tasks.
Activities
Activities are an optional checklist of the single steps for completing the maintenance task. Use Activities to guide service technicians through the required work and track completion of individual steps.
When activated, the checklist is shown in the task detail view. To activate the list of Activities, create a ticket at the Support or contact your Proemion representative.
These activities are imported from the Maintenance Catalog and will be listed as separate checkboxes. Activities can be grouped under a category (e.g. Change, Test, Control), depending on whether they are configured as a flat or nested list in the Maintenance Catalog, see Activities configuration.
The checkbox for each step can be ticked separately by the maintenance service technicians when completed. The History will be updated accordingly.
For the required permissions, see Permission Sets.
Note
Consider that the maintenance task may be closed despite pending activities, see Update Task.
Completion Note
The Completion Note field allows service technicians to document work performed, observations, or follow-up actions directly on the Maintenance Task.
The note can be edited at any time during the Maintenance Task, before or after finishing it.
It can be added by the maintenance service technicians with Maintenance Tasks:Maintain Permission Set for the Maintenance Tasks they are assigned to.
This Completion Note is then made accessible to users with Maintenance:View Permission Set, e.g. Machine Owners as soon as the Maintenance Task is completed.
In the History, a new entry "updated Completion Note" will be noted when adding, editing or deleting a Completion Note.
To add a Completion Note, proceed as follows:
-
Open the task details page of a Maintenance Task and click + in the Completion Note section.
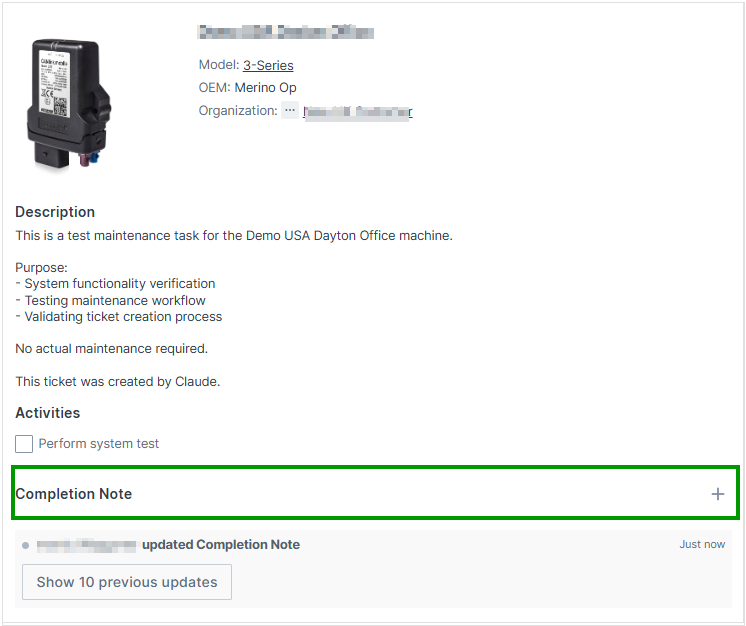
Figure 1: Add Completion Note -
Add the desired text and click the Disk icon to save your Completion Note. The change will be directly written in the History below.
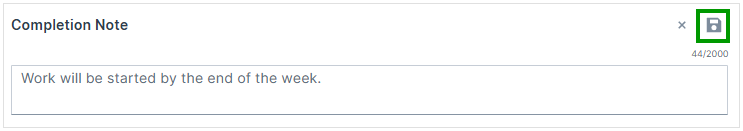
Figure 2: Add Completion Note Text The Text cannot be formatted and is limited to 2000 characters.
-
Click Update Progress and choose one of the available options to close the complete Maintenance Task with the note.
✓ The Completion Note will be added to the Maintenance Task and a corresponding message is displayed in the History.
To change the Completion Note, add a new text in the Completion Note field and click the Disk icon to save your changes.
To delete the Completion Note, save an empty Completion Note.
A note may be edited multiple times.
History
The History section lists all actions including their time stamp performed regarding the selected Maintenance Task. Filtering or sorting based on the History is not supported.
Additional to the creation date of the maintenance task, it will also show for example:
-
actions regarding the Completion Note when it has been created, adapted or deleted: "User xy updated Completion Note"
-
actions regarding Activities: "User xy marked Change: Engine oil filter as pending".
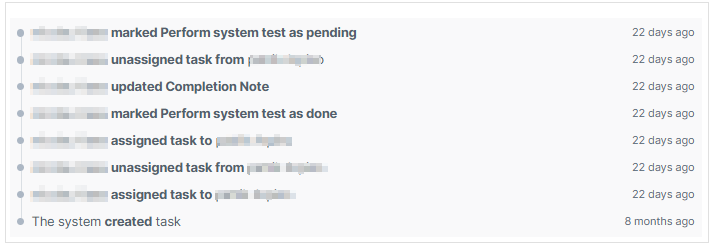
Print Maintenance Tasks
You can print individual tasks, a collection of tasks by using the filters beforehand, or all displayed tasks (without filters).
The prints include the Activities, the Completion Note and their state, and the full History of the task.
You must have the Maintenance Task:View permission set to use the print feature.
Table View
To print task(s) from the Table View, proceed as follows:
-
Use the Filters to display only the desired tasks, or select an individual task.
-
Print the task(s) using one of the following options:
- Click the
 export icon above the table to print all displayed (pre-filtered) tasks.
 - Click Print task in a row's three-dot menu, or Print task in the task detail view, to print an individual task. The print dialog of your system opens where you can proceed to print the maintenance tasks.
- Click the
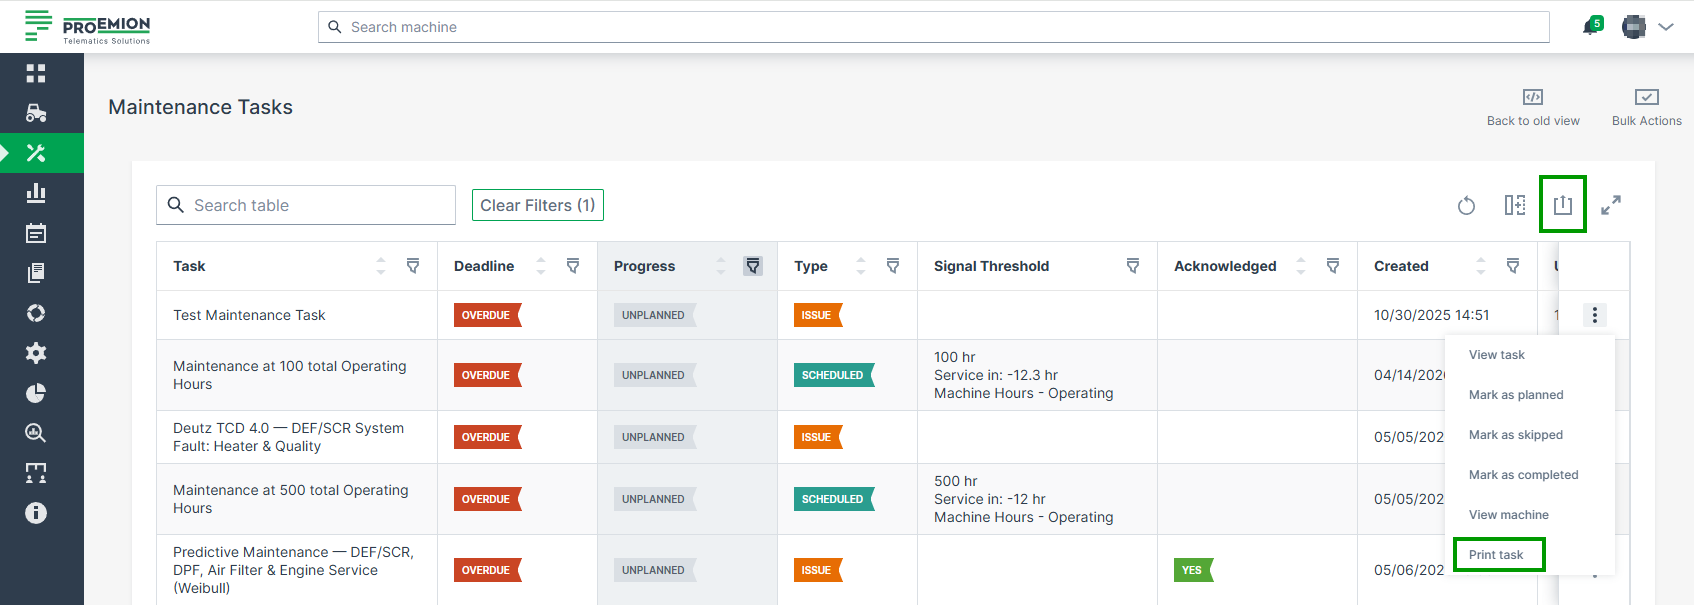
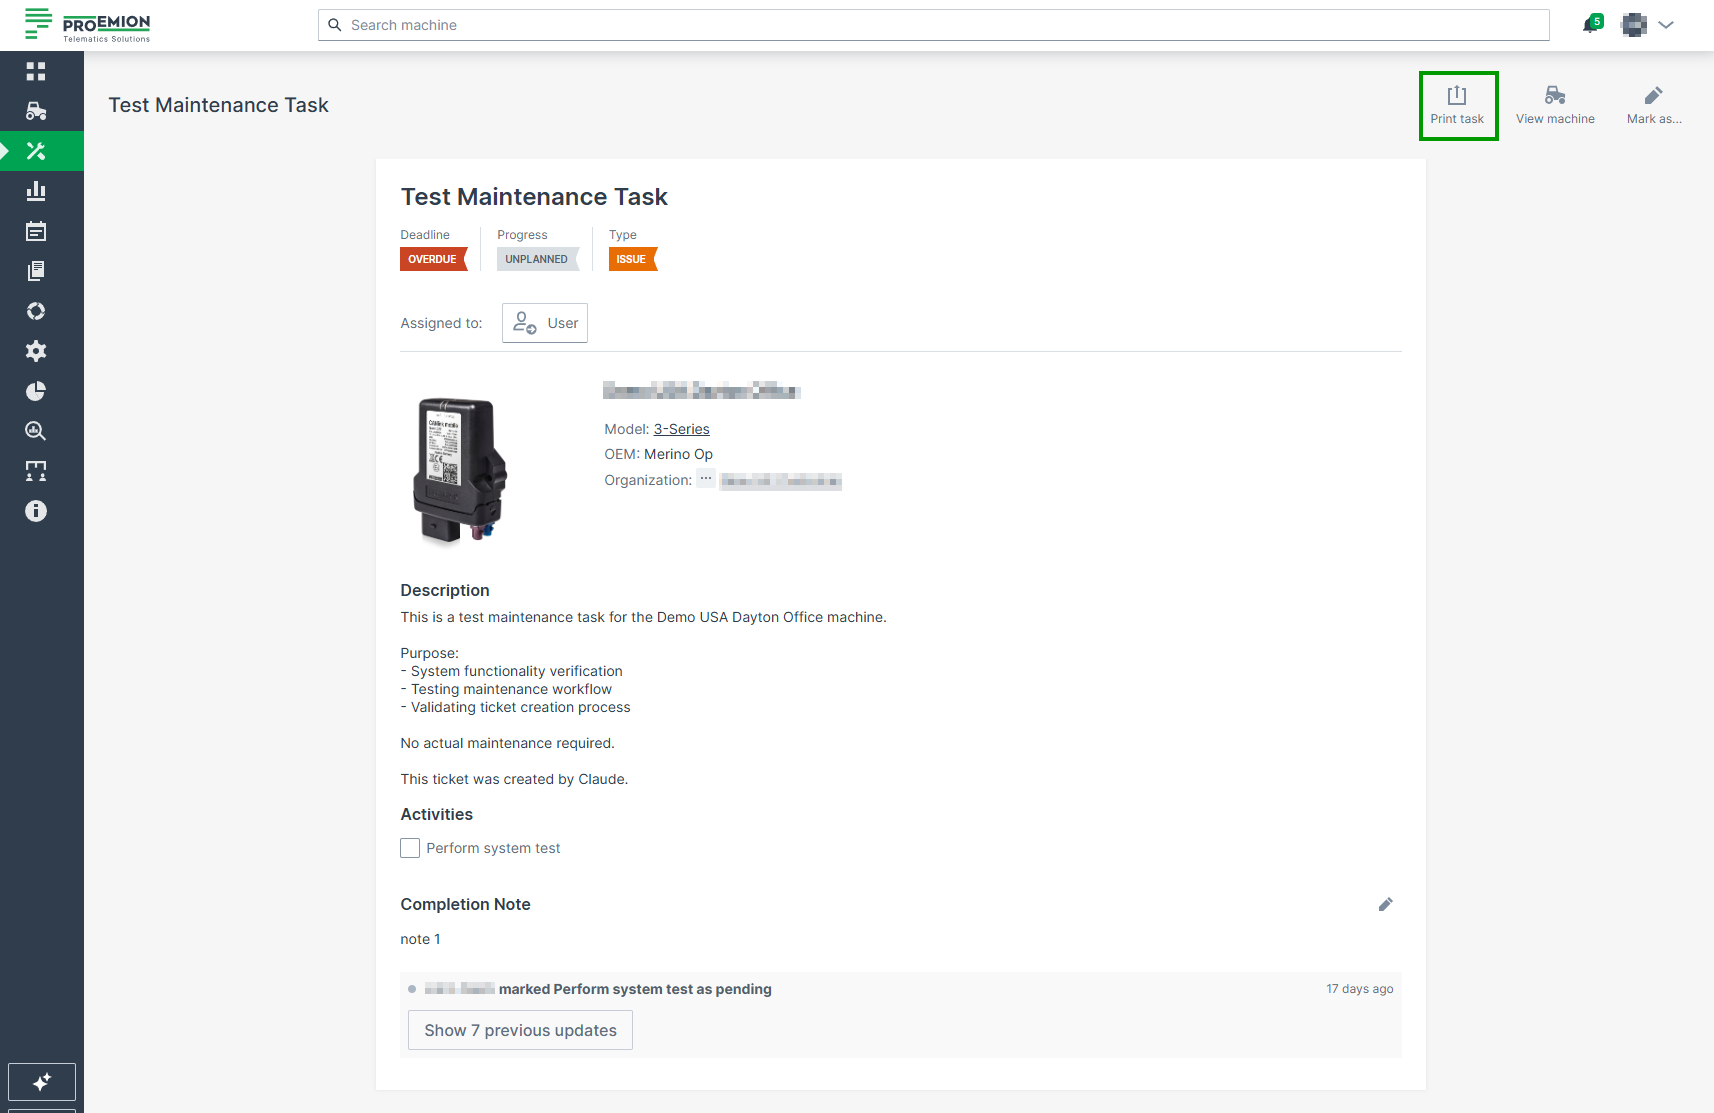
Card View
To print task(s) from the Card View, proceed as follows:
-
In the Maintenance Task menu, select the individual task or use the Filters to display only the desired tasks.
-
Click the
export icon:- On the left side, to print all displayed (pre-filtered) tasks.
- On the right side, to print the individual task.
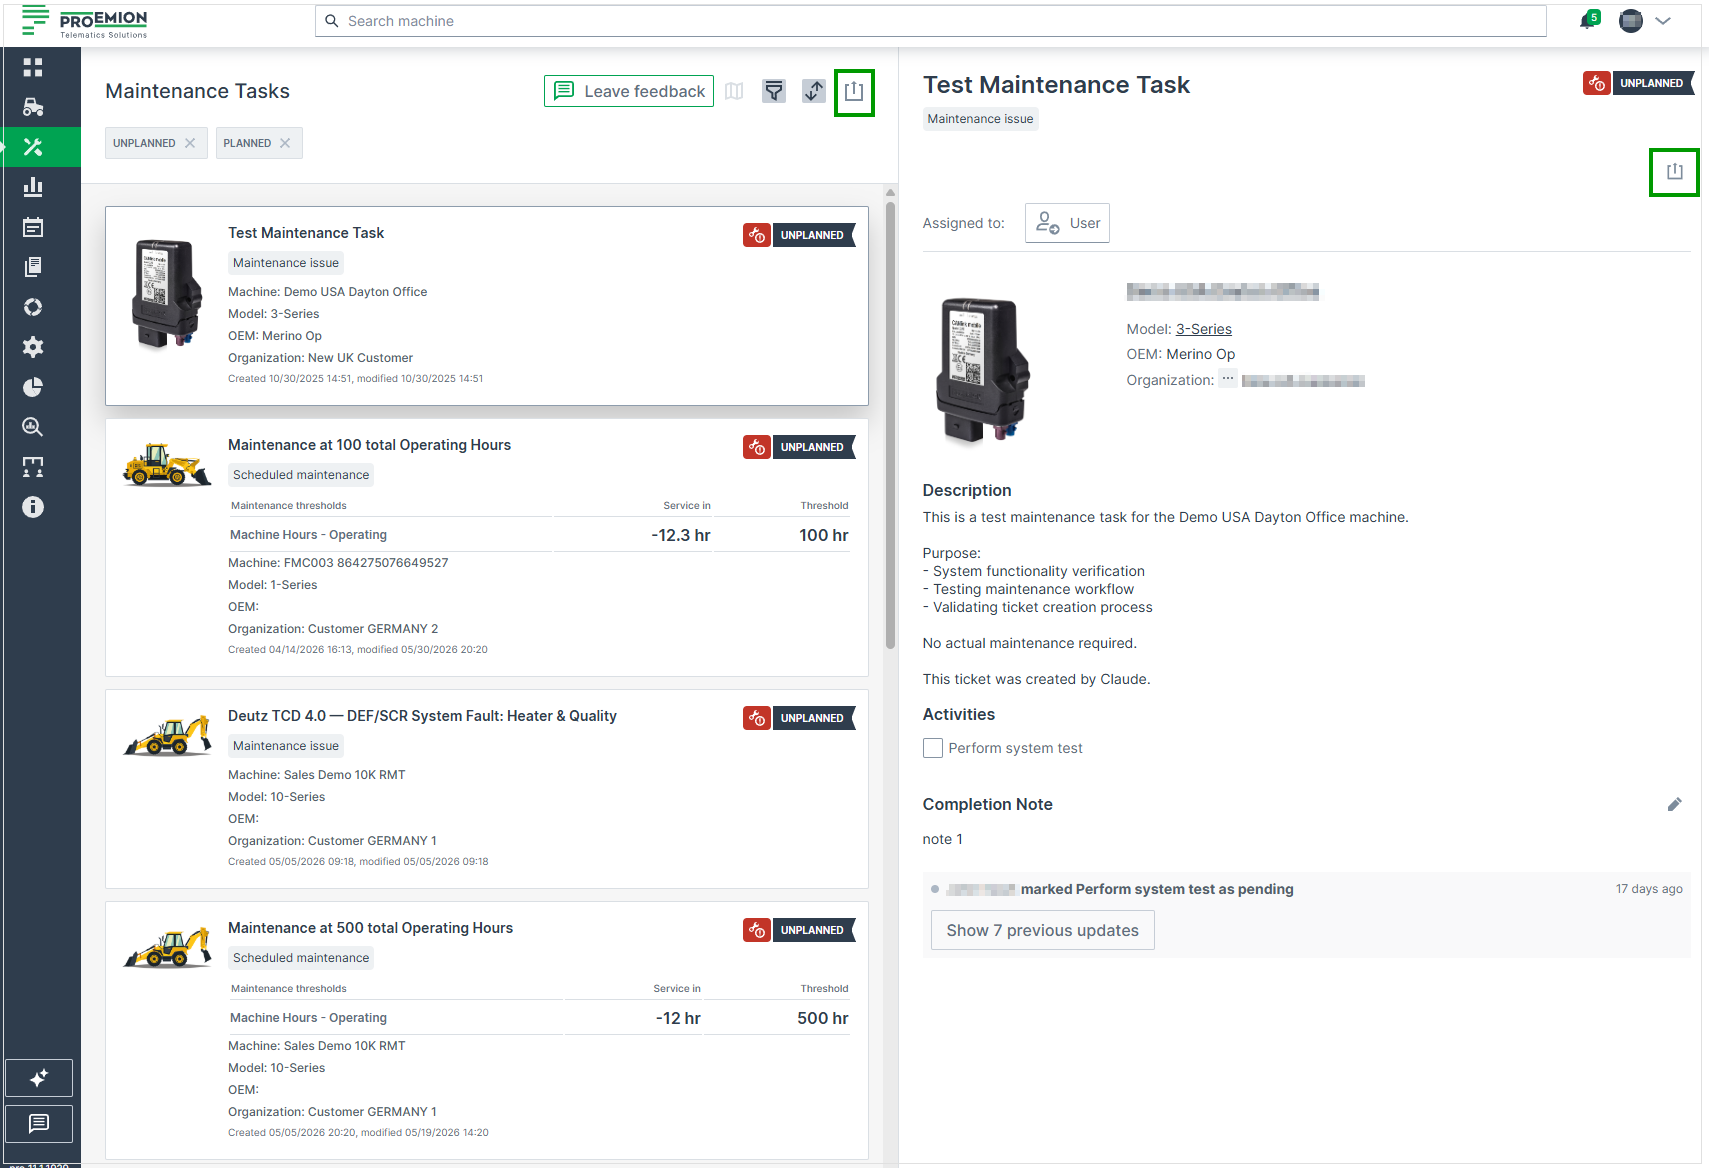
Figure 1: Maintenance Task Print -
Select Print list of tasks/Print task
The print dialog of your system opens where you can proceed to print the maintenance tasks.
Diagnostic Cases
Diagnostic Cases allow secure real-time diagnostics and remote connectivity to components in the machine’s local network during active operation.
A Diagnostic Case is triggered whenever a diagnostic session is started, either through:
- Realtime Mode (CANlink® mobile 3000 family): live CAN message streaming, or
- Remote Machine Tunnel (RMT) (CANlink® mobile 10000 family): secure remote access without CAN message transmission.
Diagnostic Session in Realtime Mode require tools such as the Proemion Remote Service Tool application, the Proemion SoftGateway or a custom application.
RMT sessions are initiated via the DataPortal; depending on the type of service accessed through the tunnel, additional local tools may be required to establish a secure connection.
For more information on Remote Machine Tunnel, see the RMT documentation.
Diagnostic Cases by Contract
The DataPortal manages the number of Diagnostic Cases based on machine's hosting contracts and Platform-wide limits. It enforces usage limits across both diagnostic mechanisms (Realtime Mode & RMT). Some contract types include a fixed number of Diagnostic Cases per month/year, while others completely restrict diagnostic functionality.
In general, there are two contract types:
- Device Contracts: Limit of Diagnostic Cases monthly per device.
- Platform Contracts: Limit of Diagnostic Cases annually per contract for the whole fleet pool.
Note
It is recommended to conclude a Platform Contract to ensure seamless access to real-time functionalities and optimized fleet management. The Platform Contract includes a defined annual limit of Diagnostic Cases applicable to the entire fleet. This enables efficient use of real-time diagnostics and monitoring across all connected machines.
Note
Please contact your Sales representative for more information about the contracting options.
Contract Enforcement
Once the Diagnostic Case limit is exceeded:
- Both Realtime Mode sessions AND RMT sessions are blocked.
- No new Diagnostic session can be started
- Regular data logging (.clf) remains unaffected, i.e. devices can still go online and connect with the DataPlatform and transmit machine logged data.
Diagnostic Case Counting and Display Logic
All diagnostic sessions initiated within the configured case window (default: 4 hours) are grouped into the same Diagnostic Case. Once the window expires, the next newly started session creates a new Diagnostic Case. A single Diagnostic Case can therefore include one or multiple diagnostic sessions.
Both mechanisms start Diagnostic Cases and are counted uniformly toward contract limits.
The number of available Diagnostic Cases — i.e., the remaining limit value — is updated once per day. However, the number of used Diagnostic Cases is updated immediately when a new case is started. Diagnostic sessions initiated by the Proemion Support team do not count against your contract quota. Only Diagnostic Cases of the last 24 months can be displayed.
Diagnostic Case Attribution and Traffic Rules
Diagnostic Cases are attributed to contract limits based on the following rules:
- Device Contract first: If a machine has a Device Contract with remaining Diagnostic Cases, each new Diagnostic Case is counted against this device-level monthly limit.
- Fallback to Platform Contract (FDP): If the device-level limit is exhausted or no Device Contract exists, Diagnostic Cases are counted against the annual fleet-wide limit of the Fleet Diagnostics Package (FDP).
Traffic attribution depends on the contract type:
- FDP-attributed cases: For Diagnostic Cases counted against the FDP contract, the data traffic generated by RMT sessions contributes to the FDP traffic limit.
- Device-attributed cases: Diagnostic Cases counted against a Device Contract do not contribute to the FDP traffic limit; Device Contracts do not enforce traffic limits. The behavior is identical for Realtime Mode and RMT sessions.
New diagnostic sessions (Realtime Mode or RMT) are rejected only when both the device-level limit and the FDP fleet limit are fully exhausted.
Diagnostics Page in the DataPortal
To access the Diagnostics page in the DataPortal the following requirements must be met:
- A contract must include Diagnostic Cases in its Contract Details.
- The user needs the Machine:Maintain Permission Set.
On the Diagnostics page you can view all Diagnostic Cases for the selected time period, including active sessions, past sessions, and the corresponding contract usage.
This includes Diagnostic Cases triggered by both Realtime Mode and Remote Machine Tunnel (RMT) sessions.
The page consists of two sections:
Diagnostic Usage Overview
This section summarizes the Diagnostic Case consumption for the currently active contract period. In the example screenshot below the following information are displayed:
-
Fleet Diagnostics Package Cases: The number of Diagnostic Cases used versus the allowed limit.
-
Case duration: The length of the configurable case window (default: 4 hours).
-
Fleet Diagnostics Package Traffic: Traffic consumed by Diagnostic Cases attributed to the Fleet Diagnostics Package (FDP).
This information helps you quickly assess current usage in relation to contract limits.
Diagnostic Cases Table
The table lists all Diagnostic Cases for the selected month. Each entry represents one Diagnostic Case, which may include several diagnostic sessions grouped within the case window.
| Column | Description |
|---|---|
| Machine Name | The name of the machine for which the Diagnostic Case was created. |
| Serial No | The machine’s serial number. |
| Start / End | Begin and end timestamps of the Diagnostic Case. For active cases, the remaining time until the case window expires is shown. |
| Duration | Total duration of all sessions included in the Diagnostic Case. |
| Traffic | Data volume generated during the Diagnostic Case. For cases attributed to a device contract, this value is informational only (no traffic limit applies). |
| Limit Type | Indicates to which contract limit the Diagnostic Case is attributed. Possible values: • Device limit – per device per month • Fleet pool – per fleet per year |
| Diagnostic Type | Shows which mechanism initiated the Diagnostic Case. Possible values: • Realtime – triggered by a Realtime Mode session • Remote Machine Tunnel – triggered by an RMT session |
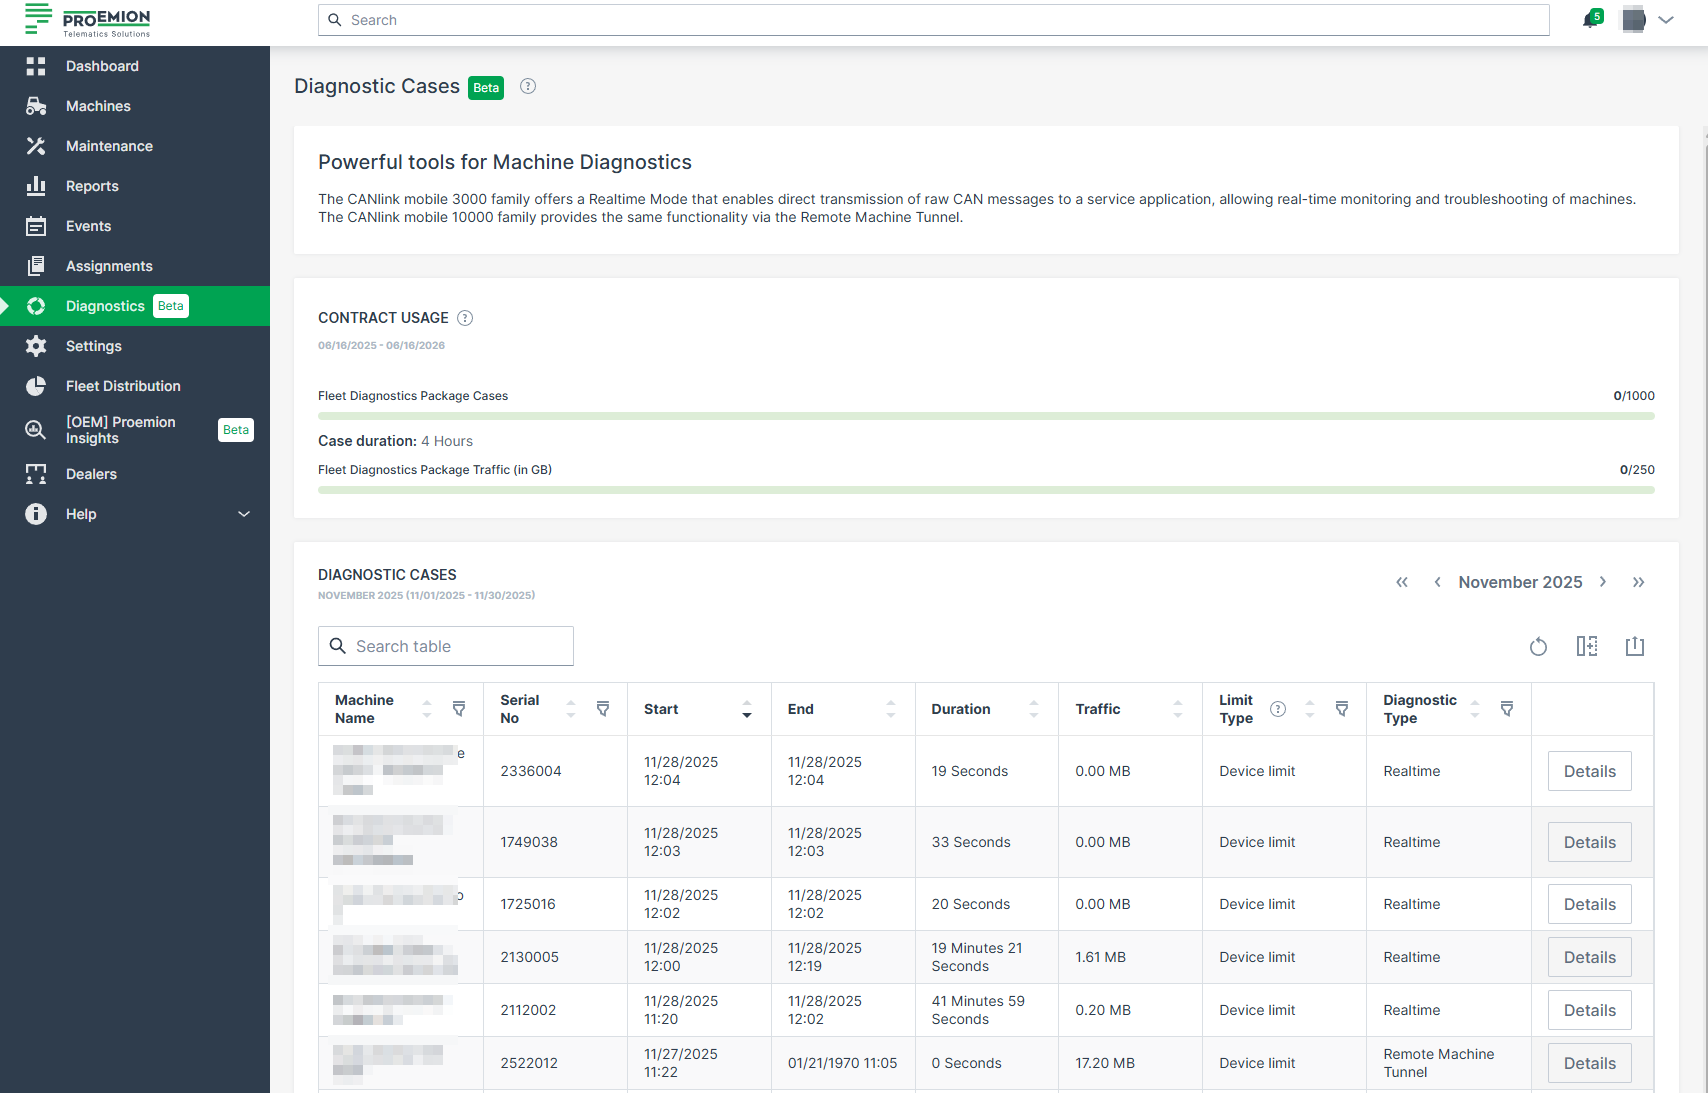
Details Page
A Details button is available for each entry to open the Diagnostic Case Details page, where all sessions belonging to that case are listed individually.
To view more details about a specific Diagnostic session for the current month, proceed as follows:
-
Click on the Details button at the end of the line of a machine.
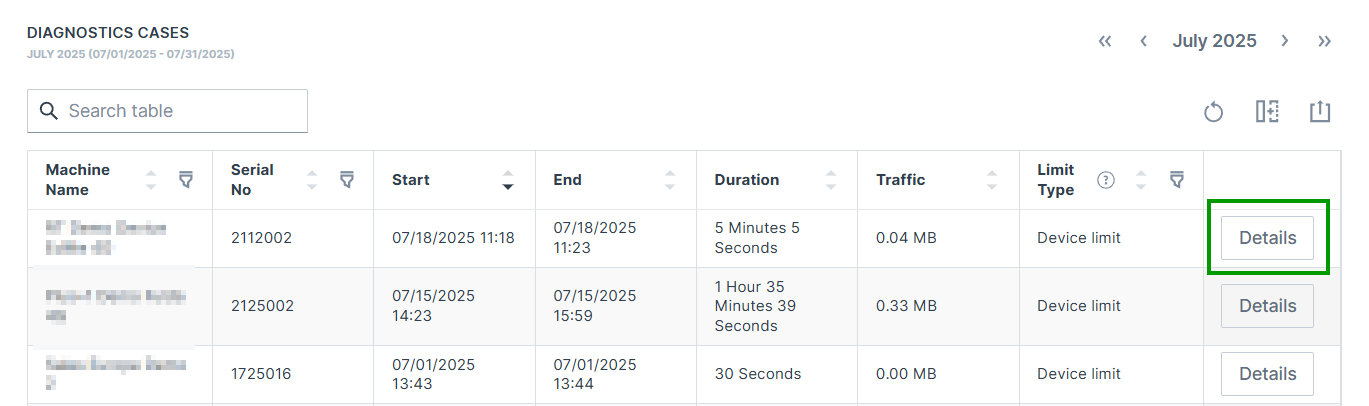
Figure 2: Diagnostic Case Details button -
The Diagnostic Case Details page opens.
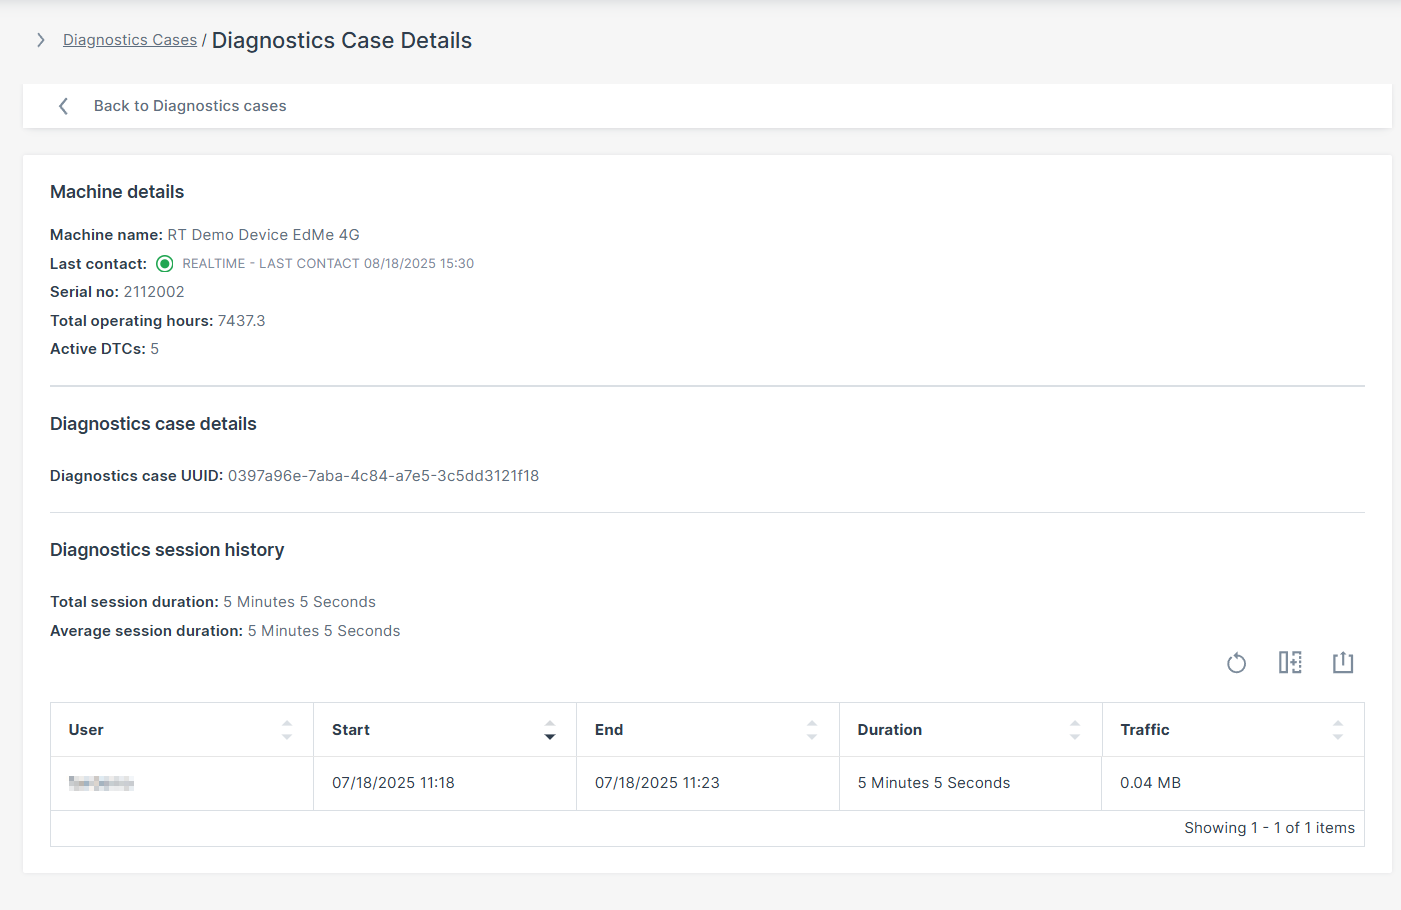
Figure 3: Diagnostic Case Details Page
In the following table you find the description of the displayed details.
| Field | Description |
|---|---|
| Machine Name | The registered name of the monitored machine/device. |
| Last Contact | Timestamp of the last successful communication. REALTIME indicates an active realt-time connection. OFFLINE indicates no current real-time connenction. |
| Serial Number | Unique hardware identifier assigned to the machine. |
| Total Operating Hours | Total accumulated runtime of the machine in hours. |
| Active DTCs | Number of currently active Diagnostic Trouble Codes (DTCs). |
| Diagnostics case UUID | Unique identifier (UUID) associated with a specific Diagnostic Case, used for session tracking and backend reference. |
| Total Session Duration | Combined time spent in all Diagnostic sessions. |
| Average Session Duration | Average duration of a Diagnostic session. |
| User | The DataPlatform user that initiated the session. |
| Start | Start timestamp of the Diagnostic session. |
| End | End timestamp of the Diagnostic session. |
| Duration | Total length of the Diagnostic session. |
| Traffic | Amount of data transmitted during the Diagnostic session (in MB). |
The count and the number of available Diagnostic Cases is displayed in the Contract Details:

Add Additional Diagnostic Cases per Device
If a specific machine requires more Diagnostic Cases than your current hosting contract allows, DataPortal will block the initiation of new Diagnostic sessions for that machine once the quota is exceeded.
You may request a one-time Diagnostic Case top-up to temporarily increase the monthly limit for a specific machine when additional capacity is needed and no fleet-level Platform contract is available. This top-up applies only to the specified calendar month, is not a permanent change to your contract, and is intended for exceptional, short-term use cases. Unused top-up cases do not carry over to future months. Top-ups are billed separately based on the requested amount and duration.
To request additional Diagnostic Cases use the Request Diagnostic Cases form.
Once confirmed, a new row titled Real Time Top Up [requested number] Cases appears in the Active tariffs list (see image below) and the Diagnostic traffic cases (used/limit) number increases accordingly.
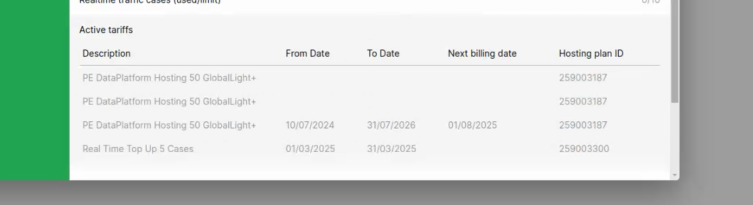
Events
Events
The DataPortal visualizes standard events such as GeoLeash and Thresholds captured by the DataPlatform.
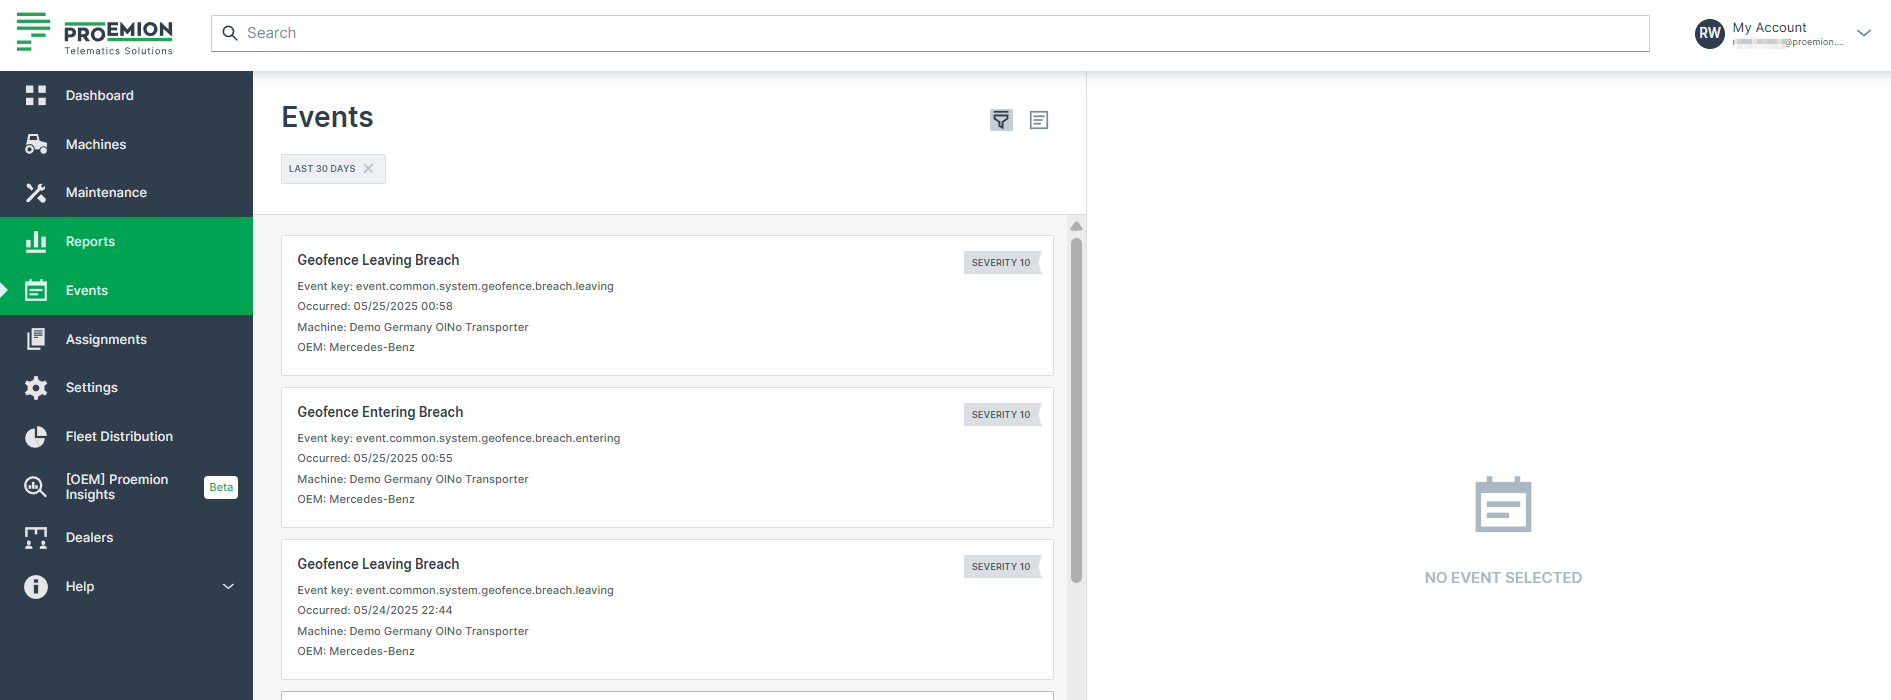
Note
This feature is available via Feature Switches, see Configuration
| Events | Description |
|---|---|
| GeoLeash | Tracks machine movement and enables automatic notification about machine relocation. |
| GeoFence | Monitors machine movements to determine if it is inside or outside a pre-defined GeoArea and detect when it crosses the boundary, i.e. enters/leaves the GeoArea. GeoFence events are self-contained; they store the GeoArea as it was at the time of creation. The visibility is restricted, for more information read the linked documentation. |
| Thresholds | Machine signal changes outside the defined normal signal value range. |
| Time Fence Breach | Detects if a machine is active outside a weekly schedule. |
| Realtime Sessions | Tracking and audit realtime sessions identifying who connected to a machine. |
| Fuel Guard | Detects fuel refill, loss and DEF/AdBlue refill events. See DataScience Manual → "Fuel Guard" for more information. |
| PDC Changes | Tracks PDC changes: The DataPlatform stores the update time. A PDC change event is generated for each update. Event types: Machine PDC change Model PDC change (event per machine) Machine model change (if PDC differs) |
| Software Version History | Tracks firmware versions, configuration versions and CODESYS application versions (for supported CANlink® mobile 10000 devices). |
Custom events are not captured by the platform as a standard feature. These events are implemented upon customer request.
Note
Events exposing location history are hidden from users with access only to the latest location. Access must be set by an organization admin.
Configuration
Activate the menu to display implemented events via Settings > Features, see Feature Switch.
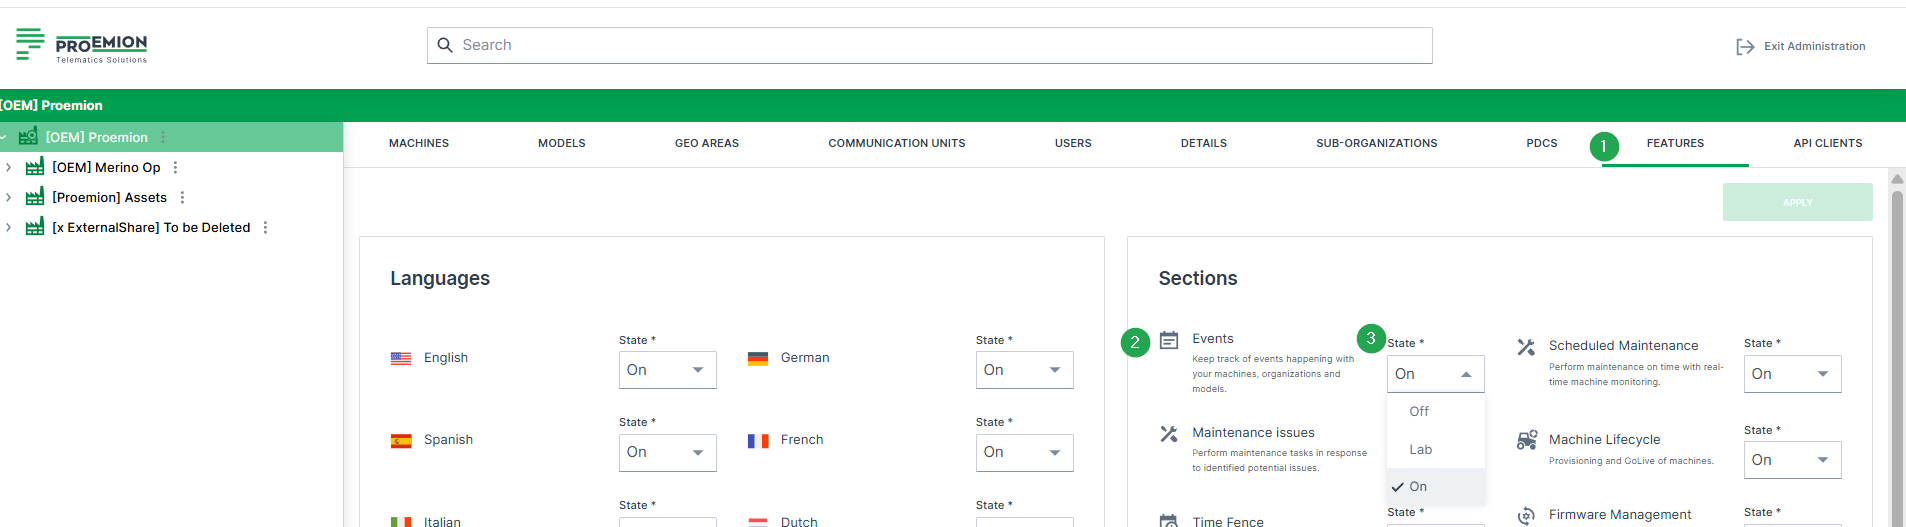
You can now select Events from the left side menu.
View Event
You can Filter and/or sort events by oldest, newest or by maximum or minimum severity.
Selecting an event shows you the following items:
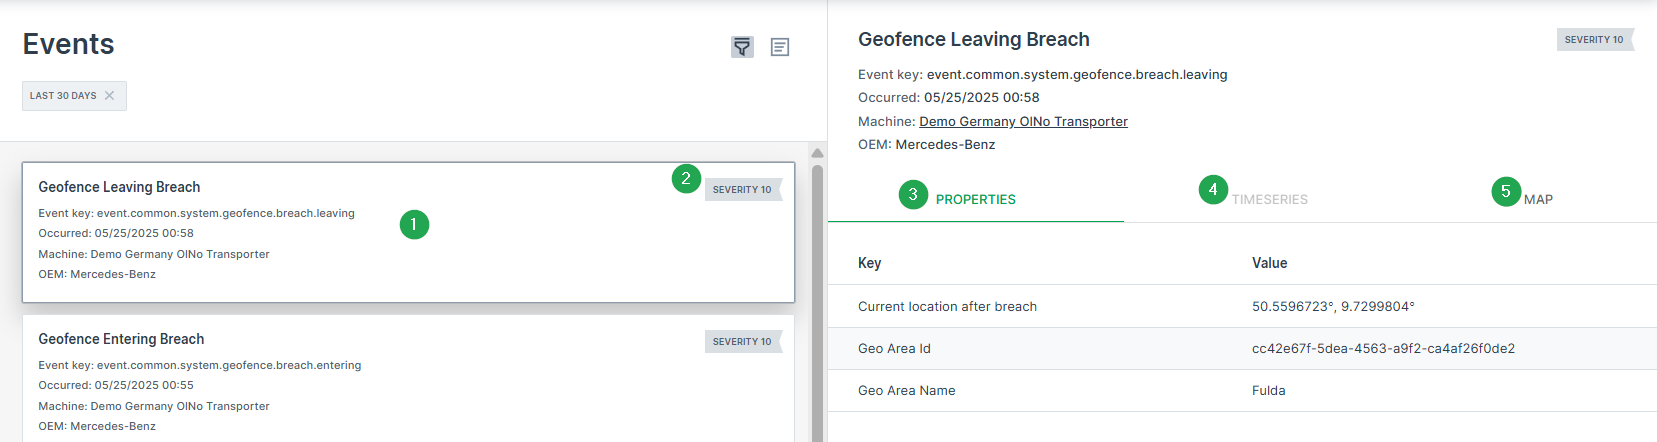
| # | Item /Description |
|---|---|
| 1 | Lists the Event data such as Key, name, status, timestamp, resource. |
| 2 | State Indicator: Events status are typically configured according to display severity in text or numerical form. |
| 3 | Properties show the Event attributes. |
| 4 | Show the time series |
| 5 | GeoFence events are also viewable on the map. 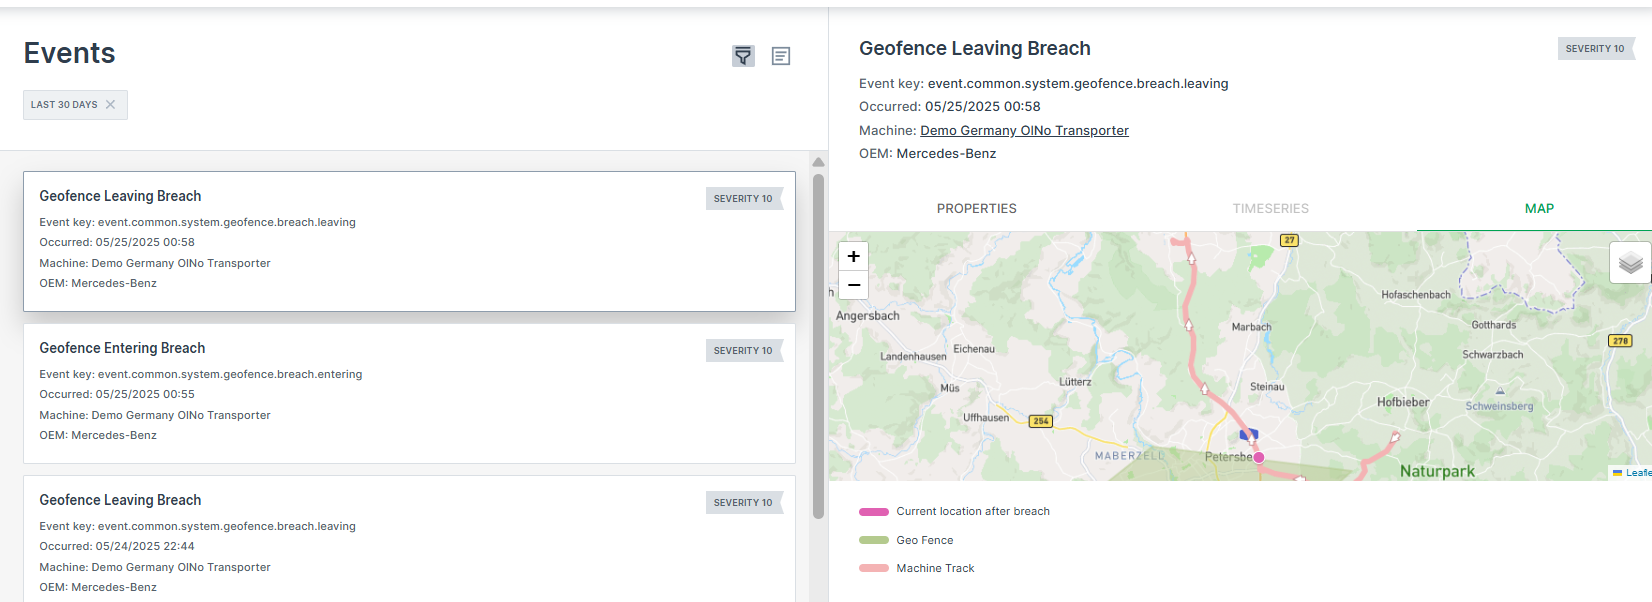 |
Filters
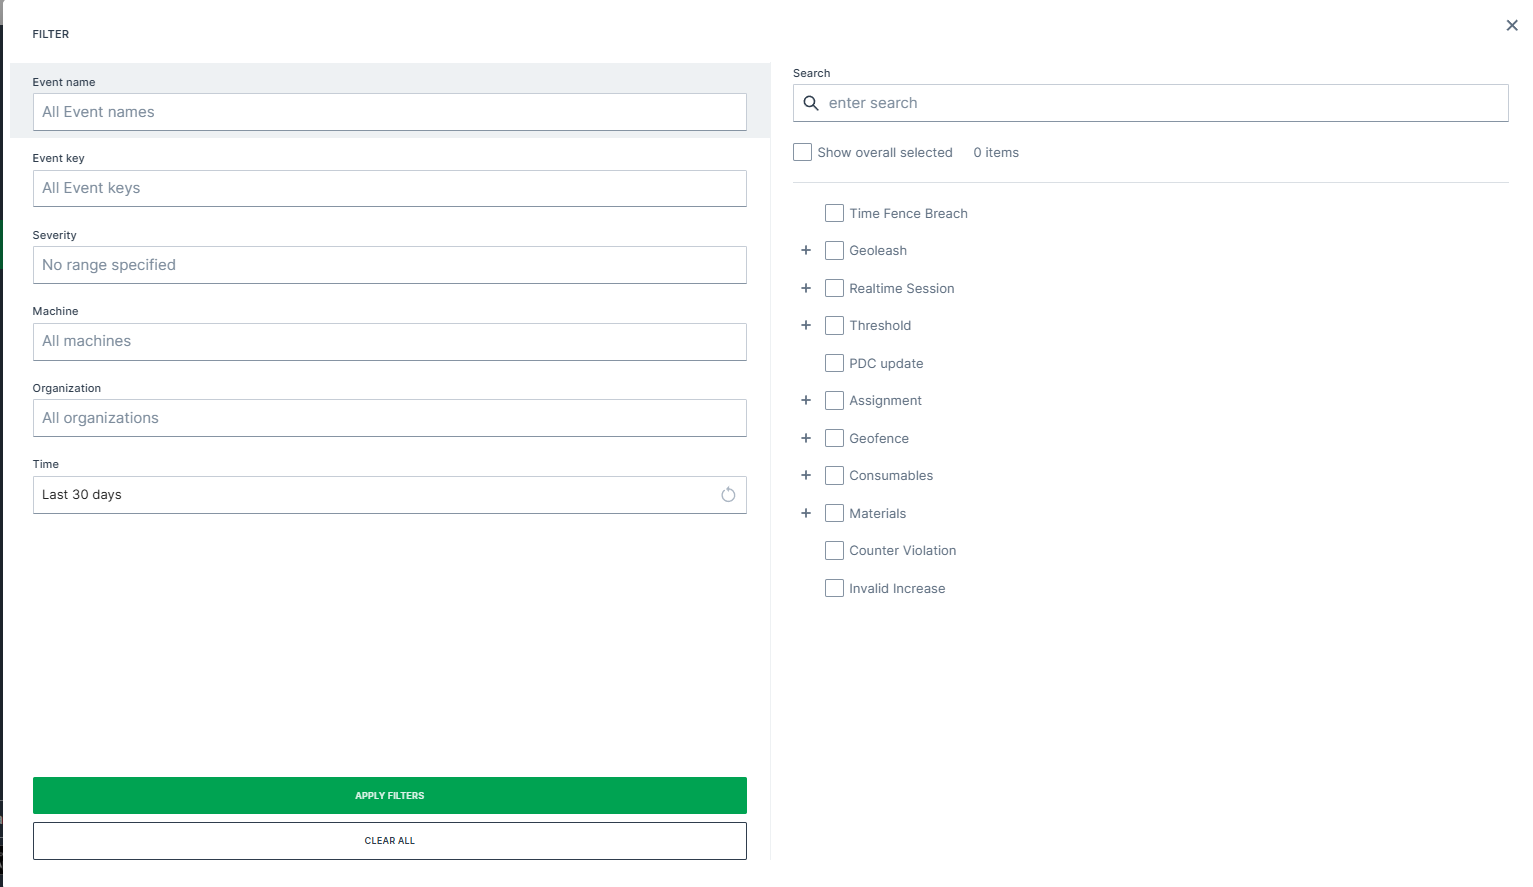
Filter events by:
- Name
- Key
- Severity
- Machine(s) - Select machine(s) to filter events .
- Organization
- Time range (filters by the selected time range during which the events occurred)
- or search a specific event
The right pane changes according to the selected filter.
Note
The filters are only available according to the available events, e.g. if there has no event occured for a specific key, it is not displayed.
Fuel Guard
Fuel Guard detects fuel refill and loss as well as DEF/AdBlue refill events. An alarm is sent to the DataPortal when one of these events occurs. This functionality differentiates between normal fuel consumption patterns and abnormalities (possibly labeled as tank leak or theft for example). An event essentially informs you about such events in the interest of further investigation.
The Fuel Guard default configuration includes the following event types:
| Event Type | Key |
|---|---|
| Fuel Refill | event.common.consumables.fuel.refill |
| DEF/AdBlue Refill | event.common.consumables.def.refill |
| Fuel Loss | event.common.consumables.fuel.loss |
Note
Fuel Guard can only be enabled if your organization uses Proemion Standard Metrics > "Fuel Guard Events".
Reports
Introduction
The DataPortal offers both preconfigured reports and the creation of manual reports to get an instant overview of different events, signals and data of a machine in opposite to the Event Functionality that triggers notifications for preconfigured events.
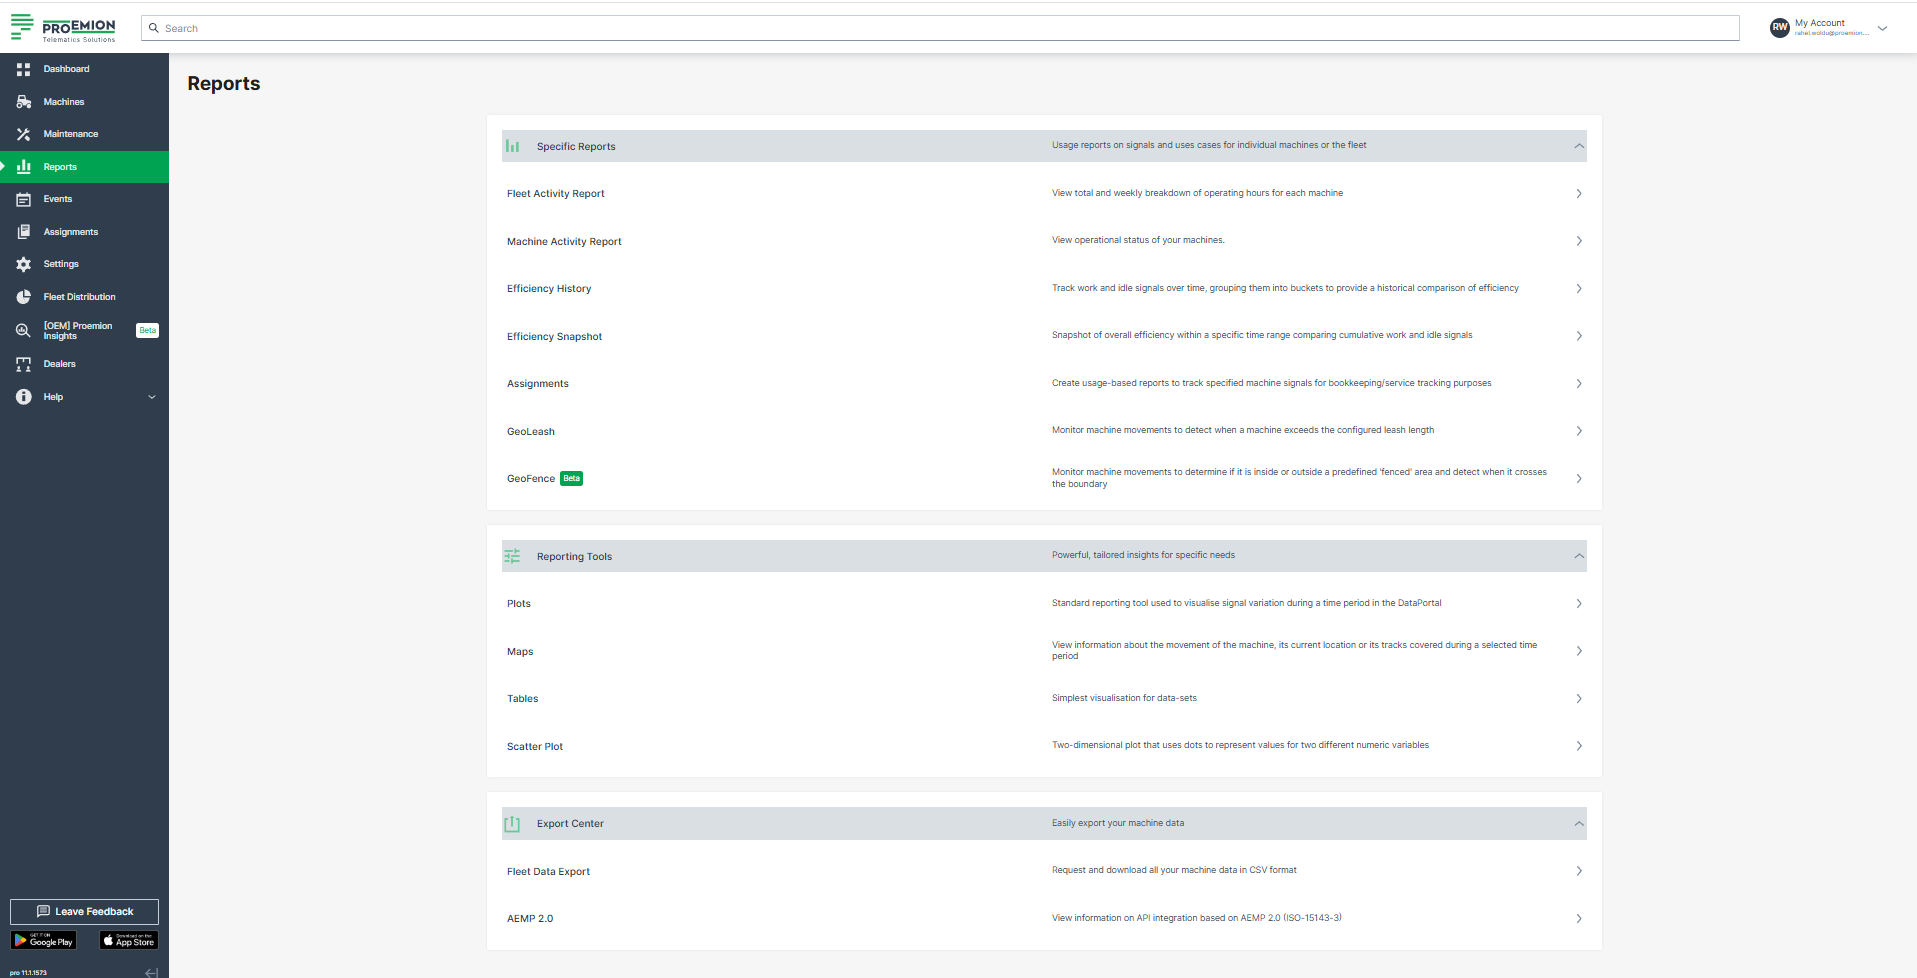
Note
Irrespective from machine location all machine data displayed in the DataPortal is shown in the time zone configured in the personal user settings via the Account Settings in the DataPortal. To view data in a different time zone, adjust your personal user settings accordingly.
The DataPortal offers the following Specific Reports on the machines:
-
For machines' operating hours reports, use Fleet Activity Report and/or Machine Activtiy Report.
Warning
Both reports are only available if the following signals are provided:
value.common.engine.state,value.common.machine.hours.operation.totalandvalue.common.cu.sensors.ignition.state.
If the requirements are not fulfilled, the reports are hidden. For users with Model:Admin permissions they are visible, but disabled.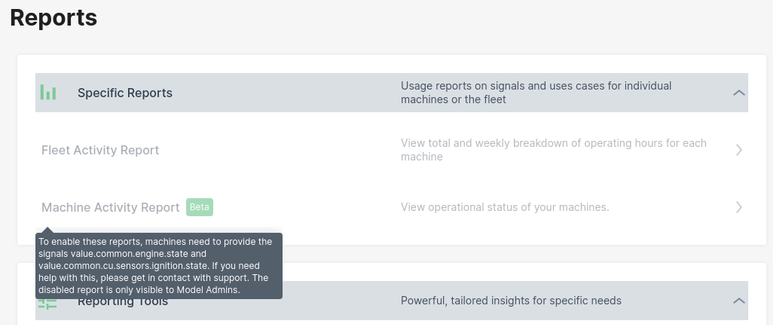
-
For tracking work- and idle signals over time, grouping them into buckets to provide a historical comparison of efficiency or to have a snapshot of overall efficiency within a specific time range comparing cumulative work and idle signals, use Machine Efficiency.
-
For usage-based reports to track specified machine signals for bookkeeping/service tracking purposes, use Assignments.
-
For tracking machine movements in predefined operational areas to detect breaches, use GeoLeash and GeoFence
For a manual configuration of reports, use the Reporting Tools like "Plots" that allow a CSV export of raw data, see Signal Plotting.
For a complete data export of all your machines, use Fleet Data Export provided in the Export Center.
Note
Note that due to rounding, the displayed values in tables and charts may differ slightly from the underlying data. Therefore, refer to the export of the raw data to CSV or Excel for exact figures of a report. For exporting data, read the chapters of the reports or refer to Table Options for general information.
Specific Reports
Fleet Activity Report
The Fleet Activity Report offers a report on the machine activity, specifically the machine's operating hours. The report shows a "heat map" per week for a maximum of 20 machines. The machine activity of the past 10 weeks can be checked.
You must have Reports permission to access the Fleet Activity Report.
The Fleet Activity Report is based on the value.common.machine.hours.operation.total signal. To view when a machine was ON/OFF, check Machine Activity Report.
Go to Reports > Specific Reports > Fleet Activity Report.
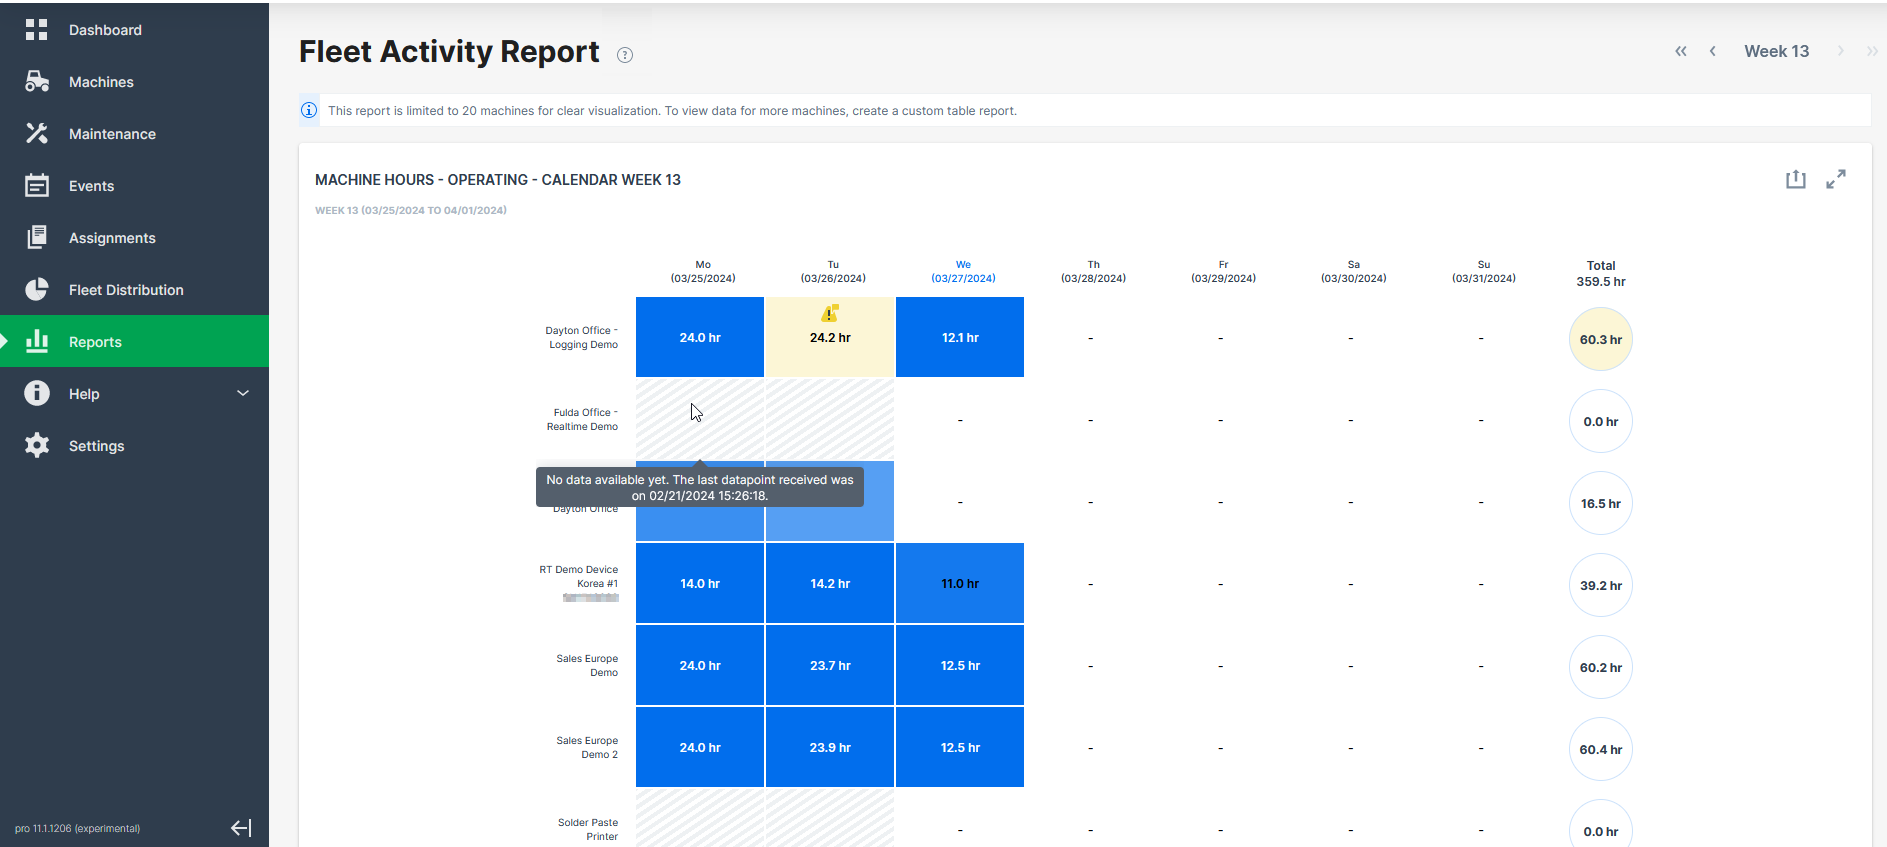
This layout gives a quick overview on what days of the week a machine was online or, when offline, to quickly analyze whether this happened by default or due to an error, for example:
-
The machine was online but sent invalid data on that day, i.e.
>24operating hours. A warning will be displayed. -
The machine was online but sent no data at all on that day. A warning will be displayed.
-
The machine was not online and sent no data on that day, i.e.
0operating hours. This is not an error and, therefore, no warning will be displayed, but the cell will be greyed out.
You can hover the single days/cells to view the last time online of the machine.
Export Fleet Activity Report
The report can be exported to an Excel file. The export can be used as a basis for invoicing.
Machine Activity Report
The Machine Activity Report offers a report on the operational status of a single machine.
This report provides Machine Owners information on the times in a day a machine was ON during a week.
You can switch between the weeks in the top-right corner.
Go to Reports > Specific Reports > Machine Activity Report and select the machine
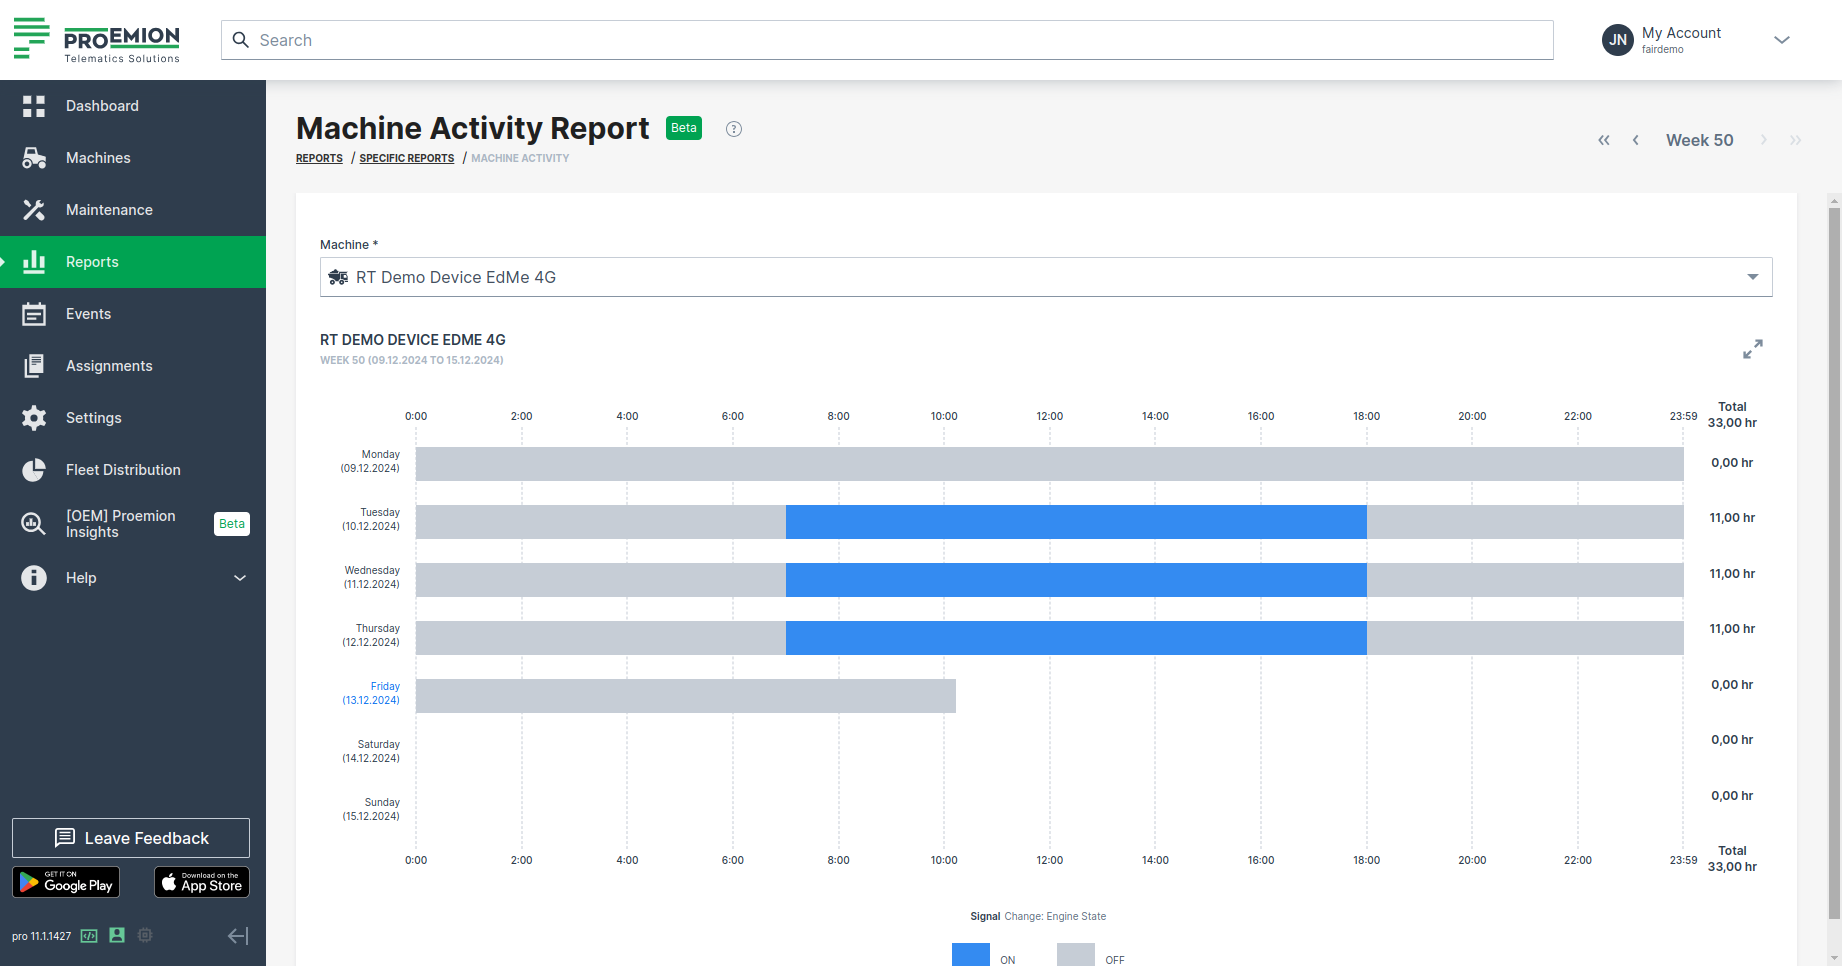
This layout gives a quick overview on what days of the week and for how long a machine was online or offline.
The Machine Activity Report is either based on the value.common.engine.state signal (0 is OFF) or value.common.cu.sensors.ignition.state - either one signal is used depending on the availability of the users.
To view the machines' operating hours, check Fleet Activity Report.
Showing Totals
The report shows daily and weekly total number of hours (hr).
The bars are color-coded:
-
Gray bars represent "OFF" time.
Hovering over a gray bar shows how long the machine was off. -
Blue bars represent "ON" time.
Hovering over a blue bar shows how long the machine was on.
When you hover over a bar, additional details like the start time, end time, and total duration, i.e. the exact duration the machine was either "ON" or "OFF", are displayed.
Daily Totals
For each day, the total daily "ON" time in hours is displayed to the right of the charts.
These daily totals are summed up at the end of the week to provide the total "on" time for that week, giving an overview of the machine's activity.
Weekly Totals
The weekly machine activity reports use bars to represent the machine's states and the duration spent in each state.
Weekly totals are displayed at the top- and bottom-right corners of the chart.
Machine Efficiency
Efficiency reporting enables machine owners to calculate and track efficiency for individual machines or for the fleet. In the DataPortal you can view the data as Efficiency History and Efficiency Snapshot reports or as a widget on the dashboard.
Machine Efficiency Requirements
The Machine Efficiency default configuration is done in the Efficiency Definitions.
Note
The Efficiency reports aren't accessible if no Efficiency definition exists.
Create Efficiency Report
Note
There are 2 report types to choose from:
- Efficiency Snapshot report: cumulative efficiency for the time range.
- Efficiency History report: efficiency broken down by bucket.
Configure an Efficiency report by following the steps below:
-
On the left-hand menu of the DataPortal dashboard select Reports.
-
Select Efficiency Snapshot or Efficiency History from the menu to open the configuration dialog.
-
Configure the Efficiency Report options as described below.
-
Once you have configured the report criteria, select the machines and click
 .
. -
The DataPortal then calculates the data and generates a report.
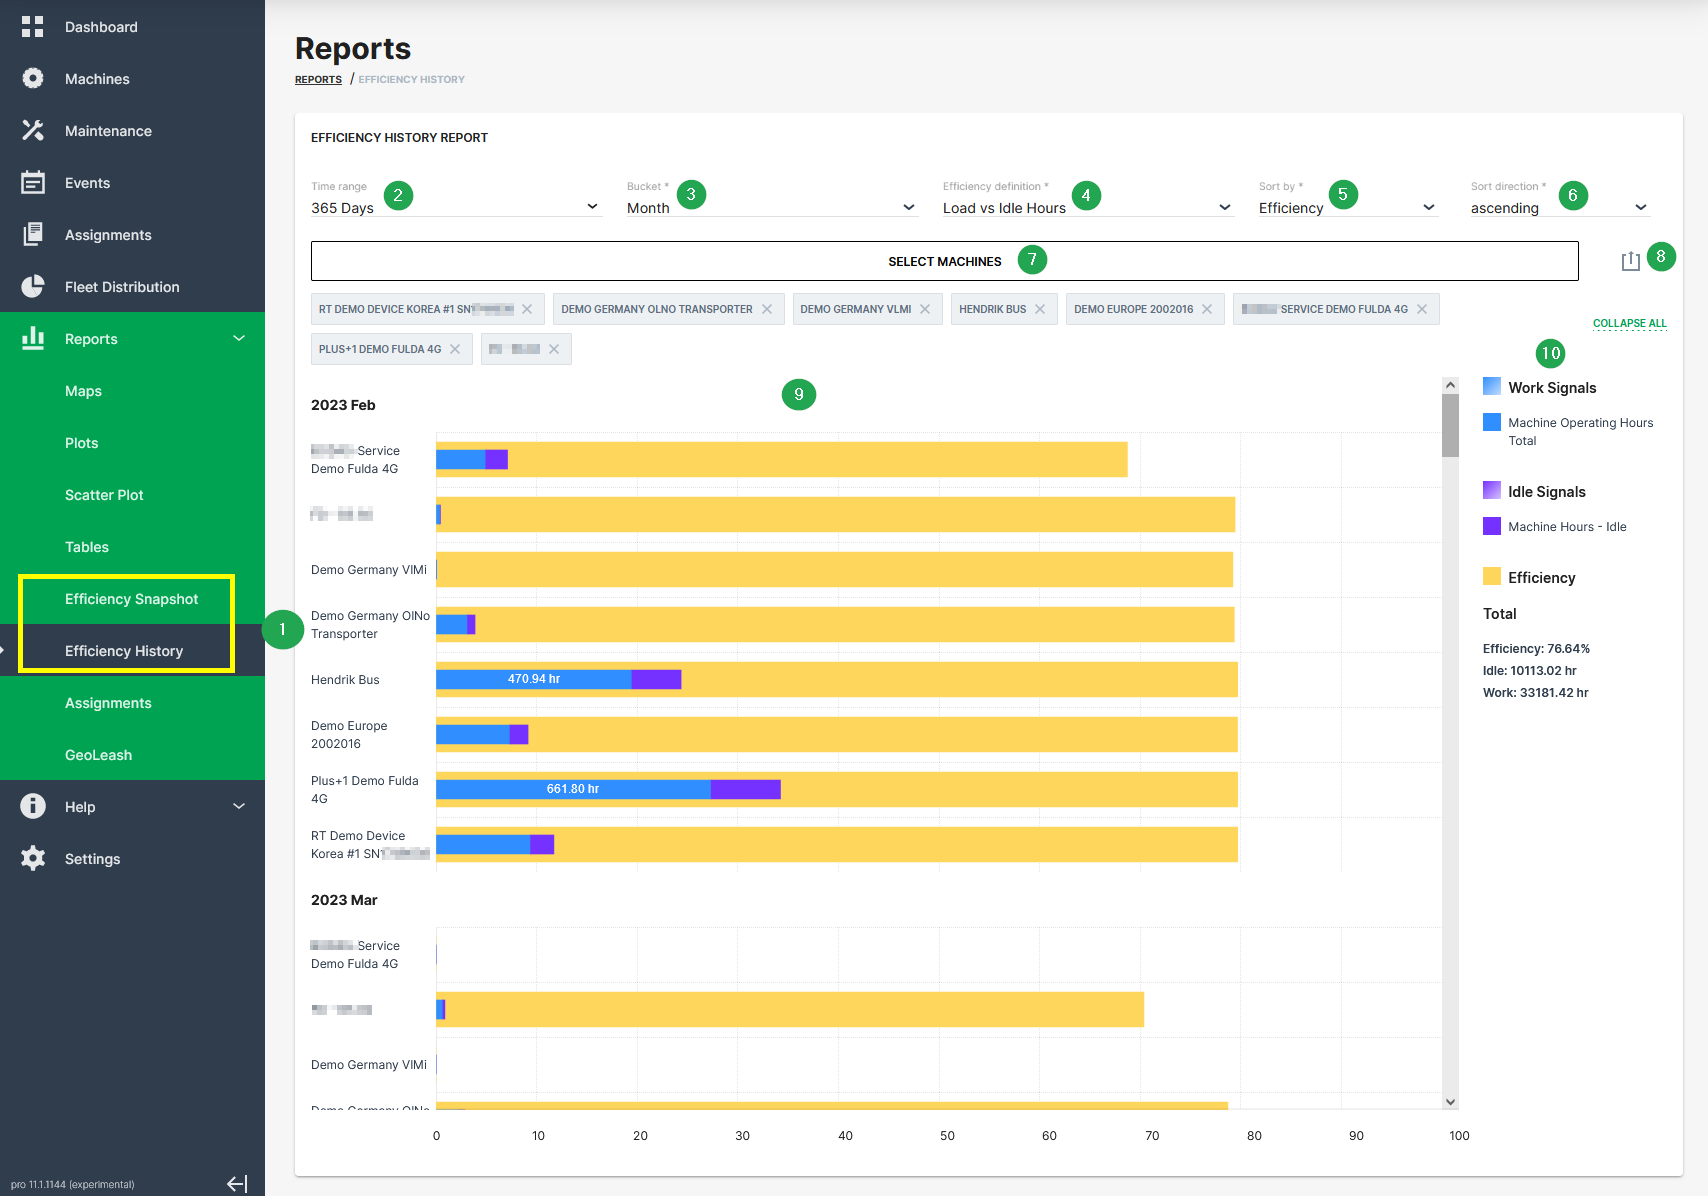
| # | Item | Description |
|---|---|---|
| 1 | Time range | Select the time period for the measurements up to the previous 2 years. |
| 2 | Bucket | Choose the time intervals between data points in the report. Please note that Bucket is only available if Efficiency History is selected. |
| 3 | Efficiency definition | Select a predefined efficiency definition. |
| 4 | Sort by | Choose between sorting by efficiency or by name. |
| 5 | Sort direction | Choose between ascending and descending. |
| 6 | Select Machines | Select machine(s) for which you want to display efficiency. |
| 7 | Export report | Allows you to export the report as CSV file or to share a link. |
| 8 | Bar chart | Graphical representation of the reporting. |
| 9 | Explanation of chart | Explains chart elements and displays summary. |
Geoleash
Geoleash tracks and enables automatic notification about machine relocation (defined as movement from one area to another). Notification is based on a set of criteria requiring minimal configuration.
Note
Geoleash functionality (configuring a boundary) can only be activated for devices (communication units - CU) where the installed firmware supports this feature. Contact your Proemion representative for more information.
Note
Location history access must be set by an organization admin and is necessary to use this feature.
Geoleash vs. Geofence
Geoleash functionality differs from Geofence in the amount of configuration effort required. Geoleash handles designating the area of operation and awareness automatically (based on the initial settings) eliminating the need for detailed configuration. This minimizes the effort for tracking a larger fleet. However, Geofence may still be necessary in some cases and both features can be enabled simultaneously.
Concept
A specific land area is defined by criteria that is set to active. Whenever the machine with active Geoleash criteria breaches (or exits) the boundary, a notification is sent.
Geoleash attributes are described in the following table:
| Attribute | Description |
|---|---|
| Center | The latitude and longitude coordinates applied as the center of the Geoleash circle. Sometimes called a centroid. |
| Length | The Geoleash boundary defined as the radius of the Geoleash circle. |
| Circle | The Geoleash area around the Geoleash center. |
The CU also informs the platform whenever the following events occur:
| Event | Description |
|---|---|
| Passive Breach | The criteria are active and when the communication unit is switched on, a breach is detected based on the current location and a new center is set. |
| Active Breach | The criteria are active and while the communication unit is running the machine breaches the constraint. |
Primary Use Cases
Common Geoleash operation scenarios are shown in the following table:
| Use Case | Function | Description |
|---|---|---|
| Tracking < 5 machines | Passive breach | A machine is relocated outside the Geoleash circle while offline; upon relocation a notification with the new center and circle is sent automatically. |
| Moving from one location to another | Active breach | While in operation, a machine moves from one location to another outside of the set Geoleash, a notification is sent. |
| Machine relocates frequently | Active breach | A machine relocates between multiple work sites while online. Each relocation outside the set Geoleash generates an event notification automatically. |
| Machine activity | View | View the past 10 actions of the machine. |
Setup and Configuration
Note
Geoleash is not enabled for every Proemion CU. If you have questions about this feature, contact your Proemion representative or create a ticket at the Support.
To configure the Geoleash length the Machine:View Permission Set is required.
To do so, proceed as follows:
On the Machine Page, select the machine you want to manage and click the Manage Machine vehicle button in the top-right corner.
This opens the Manage Machine window.
-
In the Manage Machine window, open the Machine advanced functions and select Geoleash.
-
Select Set Geoleash Length from the Active state drop-down menu and set the leash length in meters from the current position.
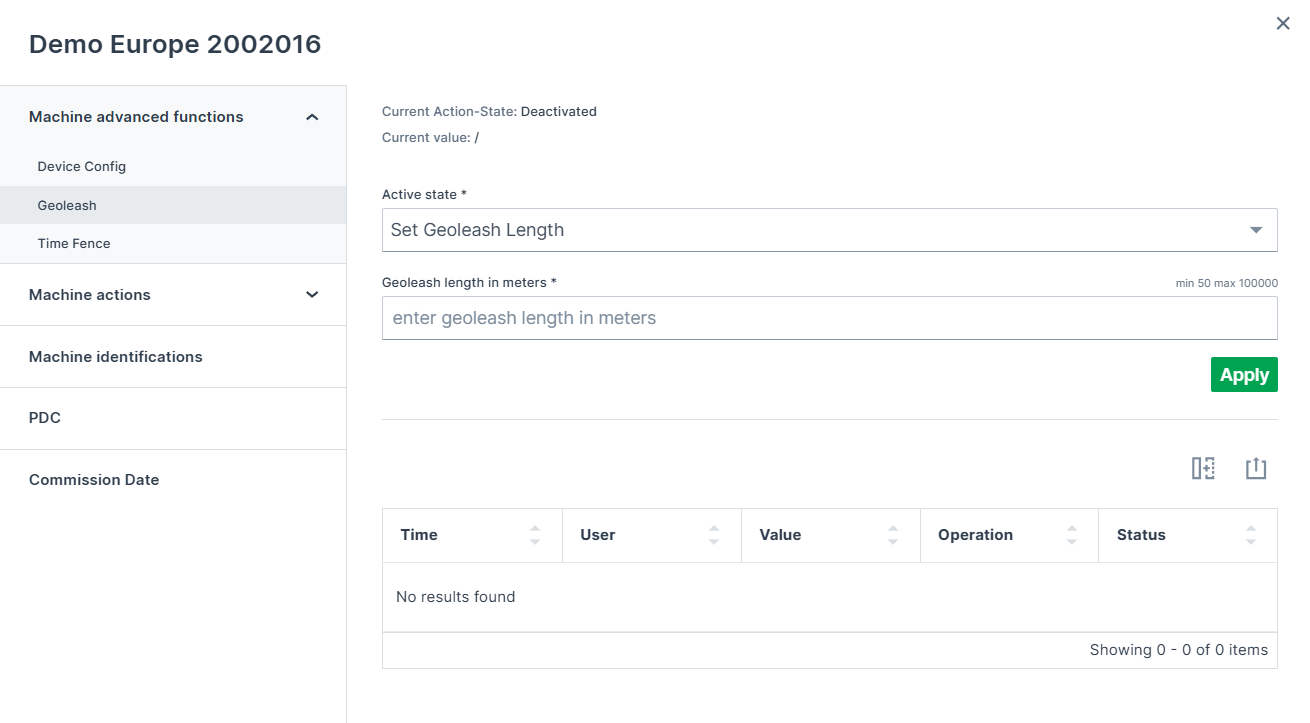
Figure 1: Set Geoleash length -
Click Apply.
Notifications
To enable Geoleash notifications you must first activate the event notifications in your user profile, and then configure Geoleash for the CU. To activate the notifications, go to Notifications settings.
Once a breach has occurred, a notification is sent containing the information found in the following table:
| Info | Description |
|---|---|
| Name | Name of the machine including a link to the machine page. |
| Time | Time the breach occurred. |
| Type | Active or Passive breach. |
| Leash Length | Currently set Geoleash circle length. |
| Previous centroid | Original center location. |
| New centroid | Current center location. |
View Breach Events
To view Geoleash breach events follow the steps below:
-
On the left-hand menu of the DataPortal Dashboard, select Reports.
-
Select the Geoleash module to open the Reports / Geoleash page.
-
Select the time range, the machine and the type of events you want to view.
-
The filtered events appear in the following table.
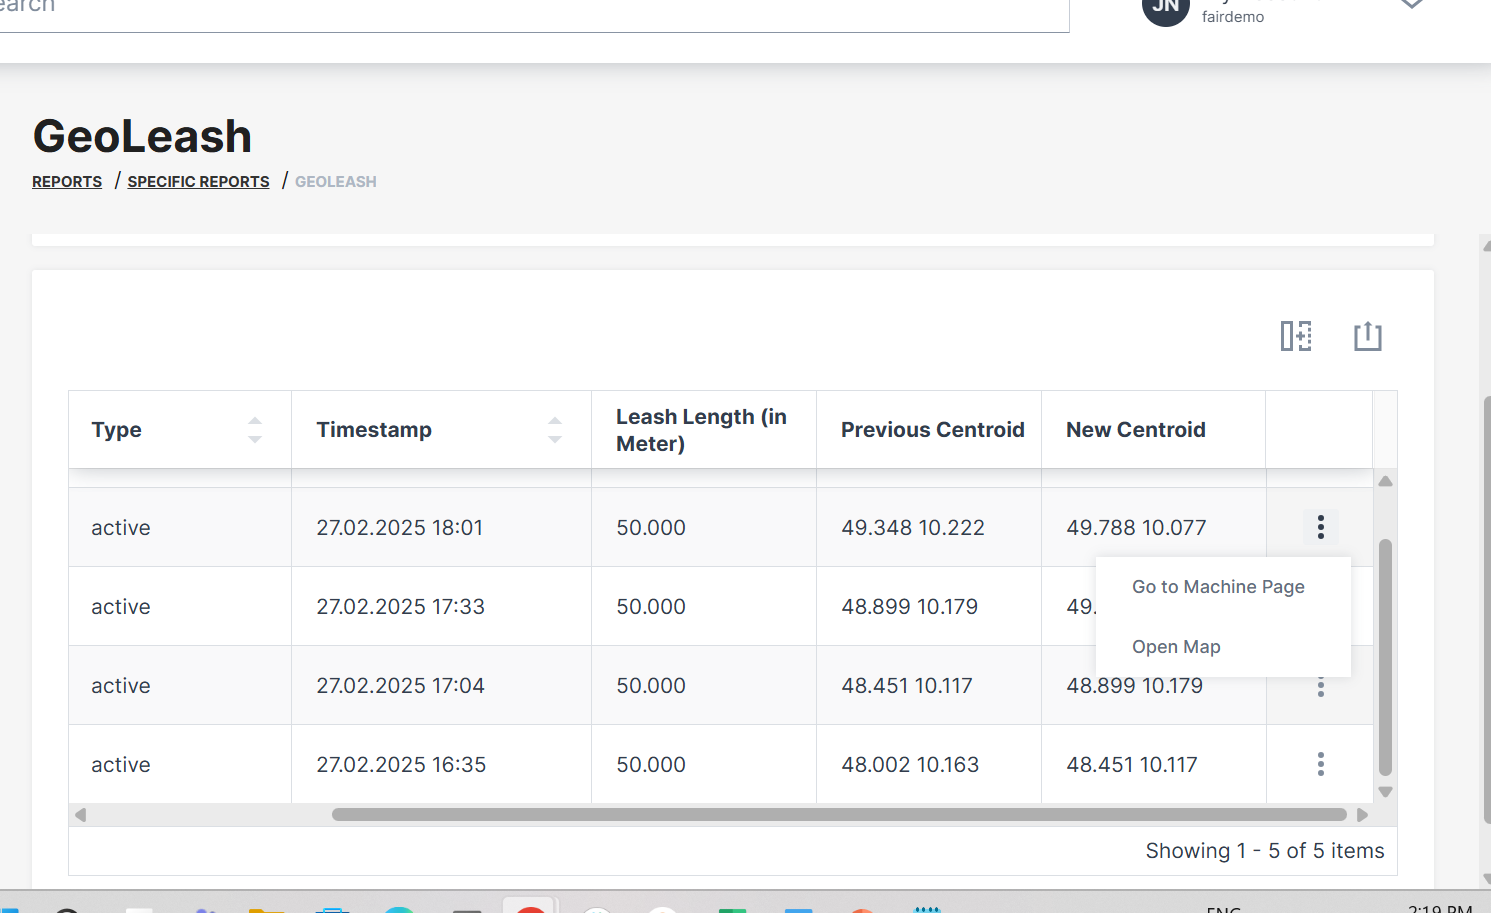
Figure 2: Geoleash View
Note
Geoleash events are automatically deleted after 120 days.
Map View
You can also view the location of Geoleash events listed in the table by selecting the Open Map option at the end of each line of the table entry.
Breach events are visualized by three markers listed on the map:
-
(P) stands for previous centroid or position.
-
(N) stands for the new position.
-
The current position marker has no label.
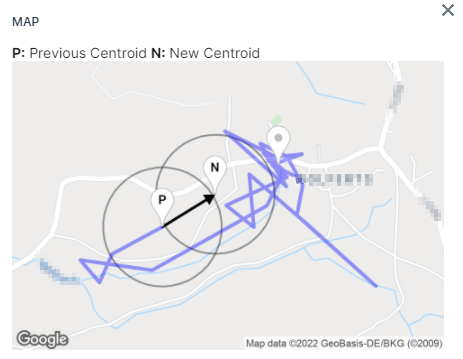
GeoFence
The GeoFence report is used to view machine GeoFence breaches.
A GeoFence is based on GeoAreas created in the DataPortal to monitor machine movements. Thereby, you can determine if the machine is inside or outside a pre-defined GeoArea and detect when it crosses the boundary.
Users in child organizations can not see GeoFence events based on GeoAreas from parent business units, even if they can see the machine generating them. Also, the visibility of GeoFence events is restricted to users having Location:Location History Permission Set.
Users subscribed to GeoFence notifications will receive notifications for all machines and can see all GeoFences assigned to their business unit; but not from the parent and child business unit.
-
To view the GeoFences and the breaches, go to Reports > Specific Reports > GeoFence:
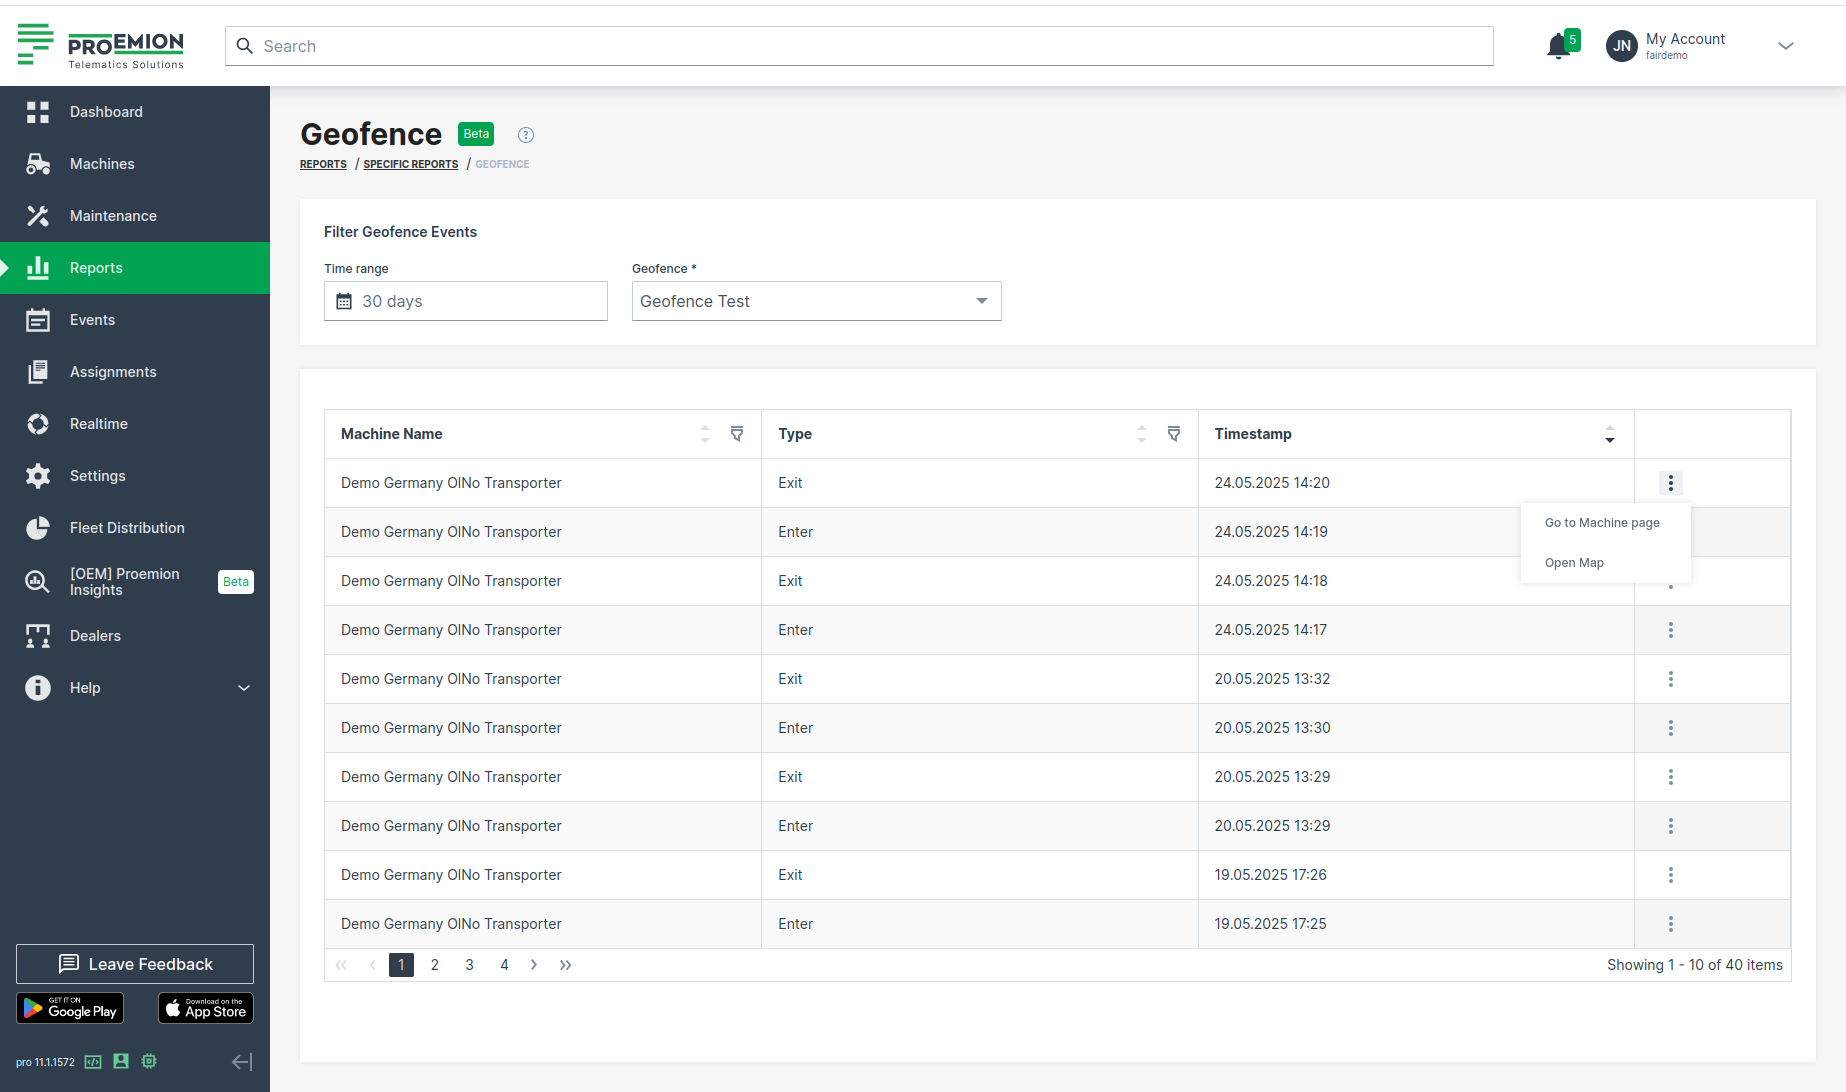
Figure 1: GeoFence report -
There, you can select the GeoFence and filter it by a time range.
The table lists all breach event types for the selected GeoFence. -
Select Open Map via the 3-dots.
There, you can view the different breach events that have different colors on the map.
Hovering over the circles will also show what is the type of the event, see the following example: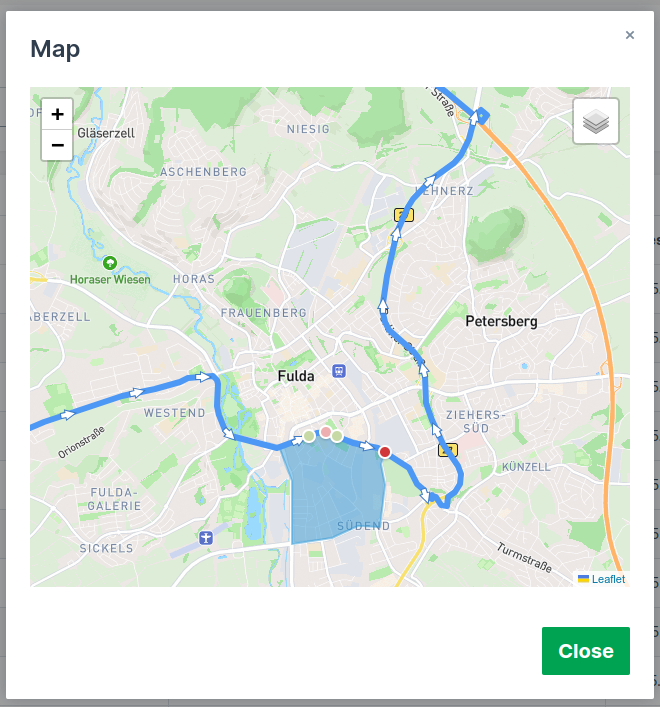
Figure 2: GeoFence in map - The selected breach event type is an "Exit" event.
- There have been 4 different breach events that are shown with different colors.
- The bright red one is the selected event, the pink one is another Exit event that happened 15 minutes before and 15 minutes after the selected event.
- The light green circles are "Enter" events that happened in the same time range. This gives you more context on the machine whereabouts during that short period of time.
- The track is a representation of the machine’s logged locations in the same 30-minute time period. Track directions are automatically enabled to show you where the machine was going.
One can view GeoFence breaches in other pages, too:
Requirements
- You must have Business Units activated, i.e. your organization must be in a business unit.
- You must create Geo Areas for the business unit and activate the option "Enable geofence" during creation.
- To read how to create and edit Geo Areas, go to Settings > Organization Structure > Geo Areas tab, see Geo Areas.
- You need Location:Location History Permission Set.
Subscription
Subscribe to GeoFence events of the business unit. Go to Subscribe to DataPortal Notifications.
Users subscribed to GeoFence events, get an email when a machine from the business unit enters or leaves a GeoFence.
Assignments
The Assignments functionality provides machine owners with the capability to create usage-based reports that track specified machine signals/counts according to the machine's jobs and tasks for bookkeeping/service tracking purposes
An Assignment can be created for an individual or a group of machines, for an individual or group of organization units
For a signal, such as fuel consumption or operating hours, to be available as an Assignment the signal must be configured as Counter in every PDC that is assigned to a Model or a Machine in the Organization, including Sub-organizations
You can also track these signals for your machines by creating a widget.
Note
In order to use the Assignments, it is essential to use standardized and harmonized metrics in the PDC files. For further details, refer to the Signal Catalog, the Proemion Standard Metrics and the PDC Manual.
Assignments Control Panel
You can view Assignments for your organization by selecting Assignments from the left-side menu to open the control panel. Here you can perform further actions:
-
Create
-
Clone
-
Export
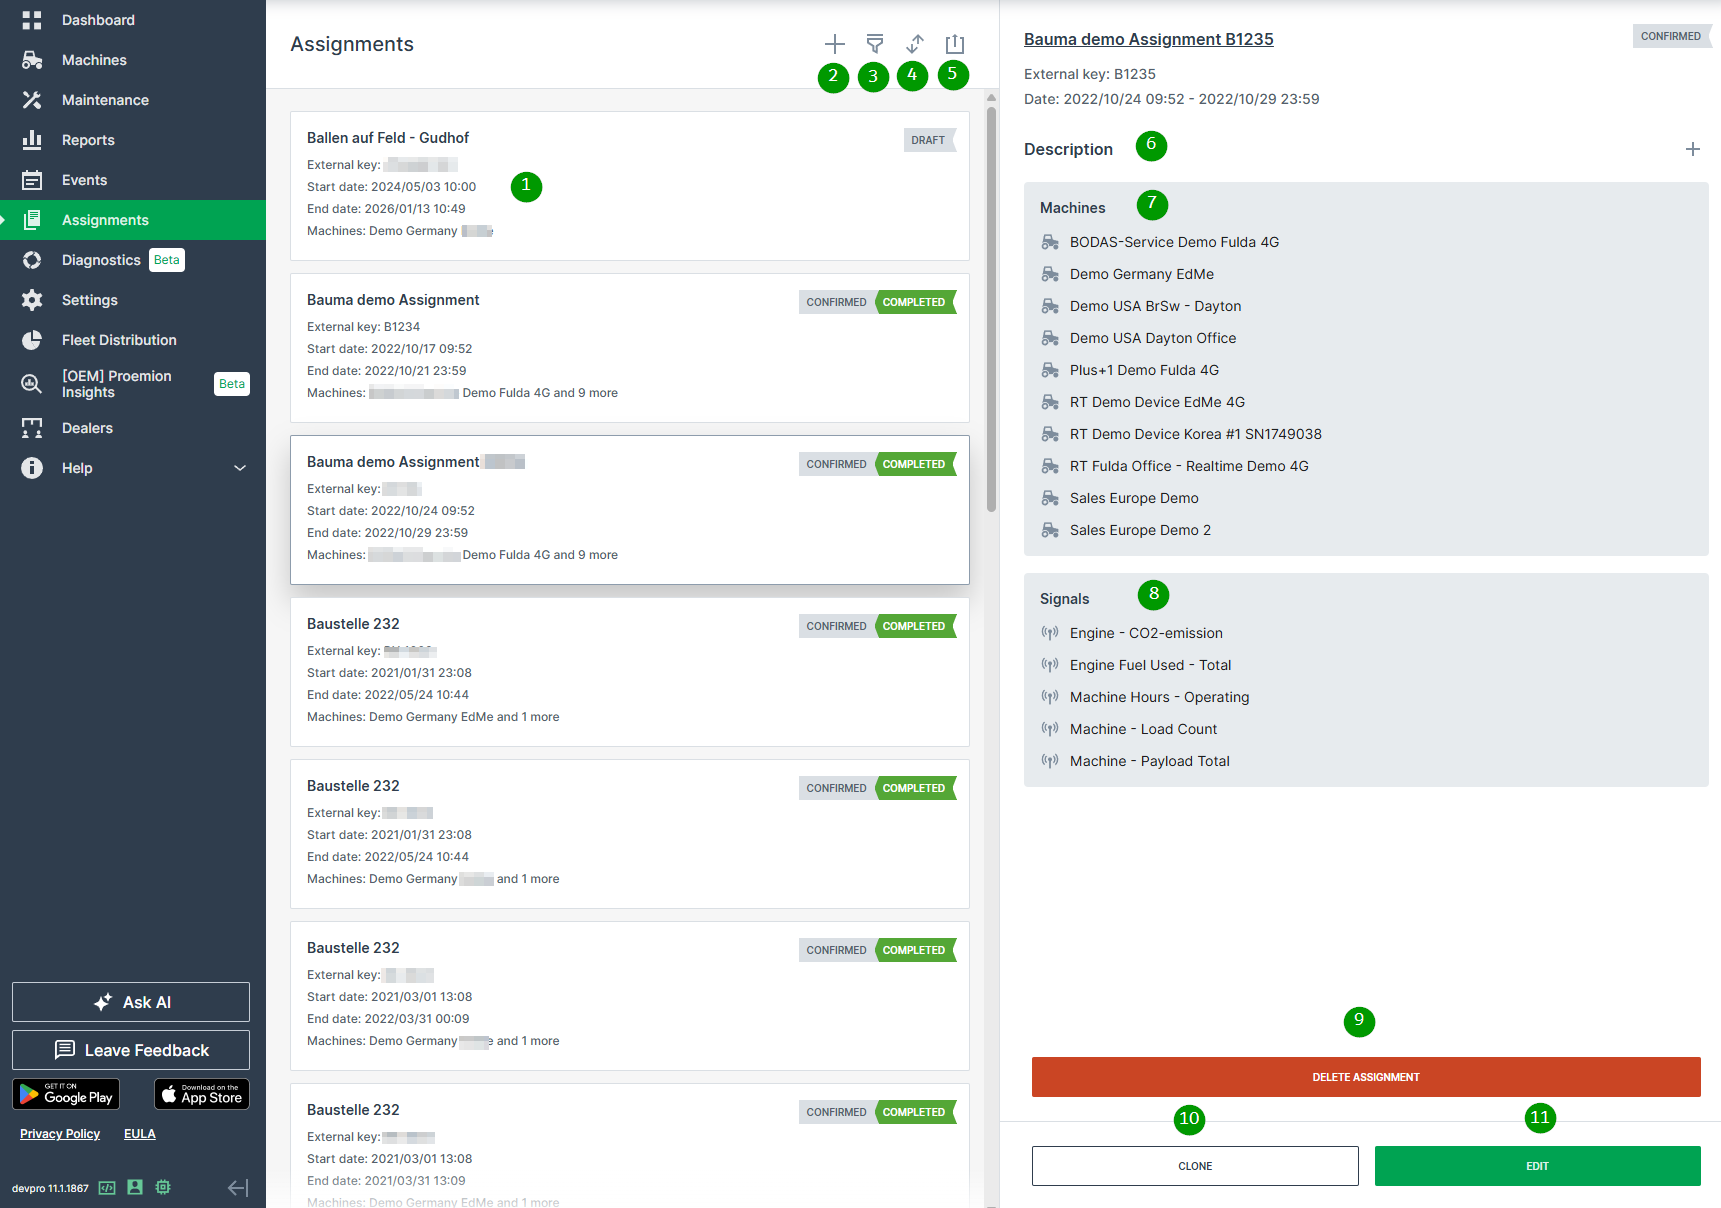
| # | Item | Description |
|---|---|---|
| 1 | Short Description | The title, key, dates and status of the assignment. |
| 2 | Create | Create a new Assignment. |
| 3 | Filter | Select and apply filters to the Assignments list shown. |
| 4 | Sort | Set the filter criteria for the order of the Assignments in the list. |
| 5 | Export | Export all assignments with any kind of filter set or without filters as CSV and XLSX. The export file also includes additional information like the serial number of the machine. |
| 6 | Description | Text explaining the Assignment objective. |
| 7 | Machines | Machines included in the Assignment. |
| 8 | Signals | Signals included in the Assignment. |
| 9 | Delete | Remove the Assignment from the system. |
| 10 | Clone | Open the Clone Assignment dialog with options already populated. |
| 11 | Edit | Open the Edit Assignment dialog with options already populated. |
If you already have Assignments in place, you can generate a report.
Create New Assignment
Note
Clone and Edit Assignment dialogs are identical to the Create Assignment dialog explained in the next section.
-
Click Assignments from the left-side menu.
-
Click the Create icon
to open the dialog and enter the configuration options shown in the screenshot below.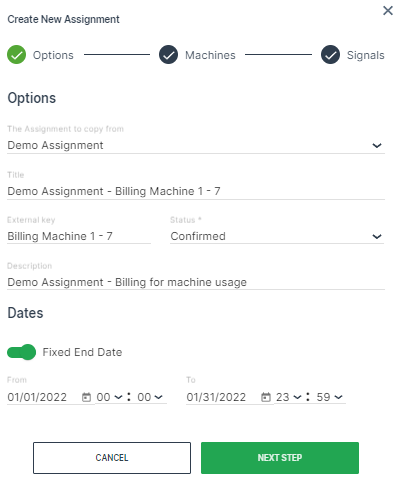
Figure 2: Assignments Dialog
| Option | Description |
|---|---|
| The Assignment to copy from | Select an Assignment to use as a template. |
| Title | Assignment identification |
| External Key | Free text (i.e. contract or invoice ID, etc.) provided by the machine owner. |
| Status | Draft: The Assignment is created but the start date is still in the future. |
| Confirmed: The contract is signed and the Assignment is confirmed. | |
| Archived: Deactivated Assignment. | |
| Description | Text explaining the Assignment objective. |
| Dates | Fixed End Date*: Toggle an end date for the Assignment. Otherwise, it wil generate reports indefinitely. |
| From: Assignment start date and time. | |
| To: Assignment end date. |
!!!tip *An Assignment intended to run indefinitely can be defined without an end-date so that a manual completion must be executed. Once the end date has been reached, the Assignment is concluded.
- Once you have entered the data in the Options tab, click Next Step to select the Machines.
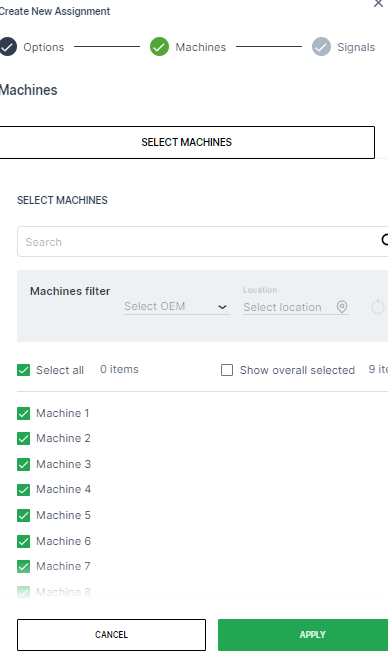
- Once you have selected the machines for the Assignment, click Next Step to select the Signals.
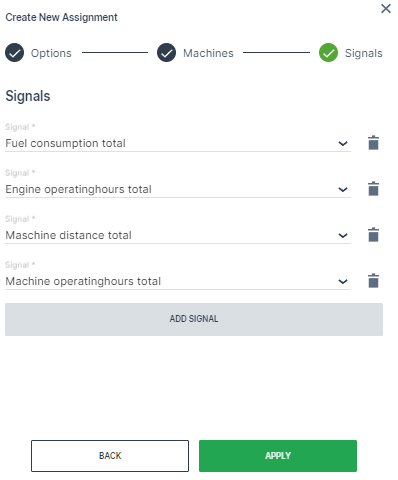
| Item | Description |
|---|---|
| Signal | Drop-down list of available signals. |
| Add Signal | Add additional signals to include in the Assignment. |
| Apply | Create the new Assignment. |
- Click Apply to create the Assignment.
When the Assignment has been successfully created, a message appears stating A new Assignment has been created. It may not be visible due to your current filters.
Generate Reports
To generate a report from an existing Assignment:
-
Open Reports > Assignments.
-
Select the Assignment you want to generate a report for from the drop-down list.
-
Optionally, change the
FromandTodates if you need to view another time period.
An aggregated report is generated as well as a report for each machine that you can open in the format of Tracking page, Map report and Plot report.
In the top menu of the Assignments Reports page, the following options are available:
-
Map report: Open the Location Reporting configuration.
-
Plot report: Open the plot configuration.
-
Export: Generate a CSV or PDF file that contains the Assignment report data.
-
Clone: Duplicate the Assignment configuration.
-
Edit: Edit the Assignment configuration.
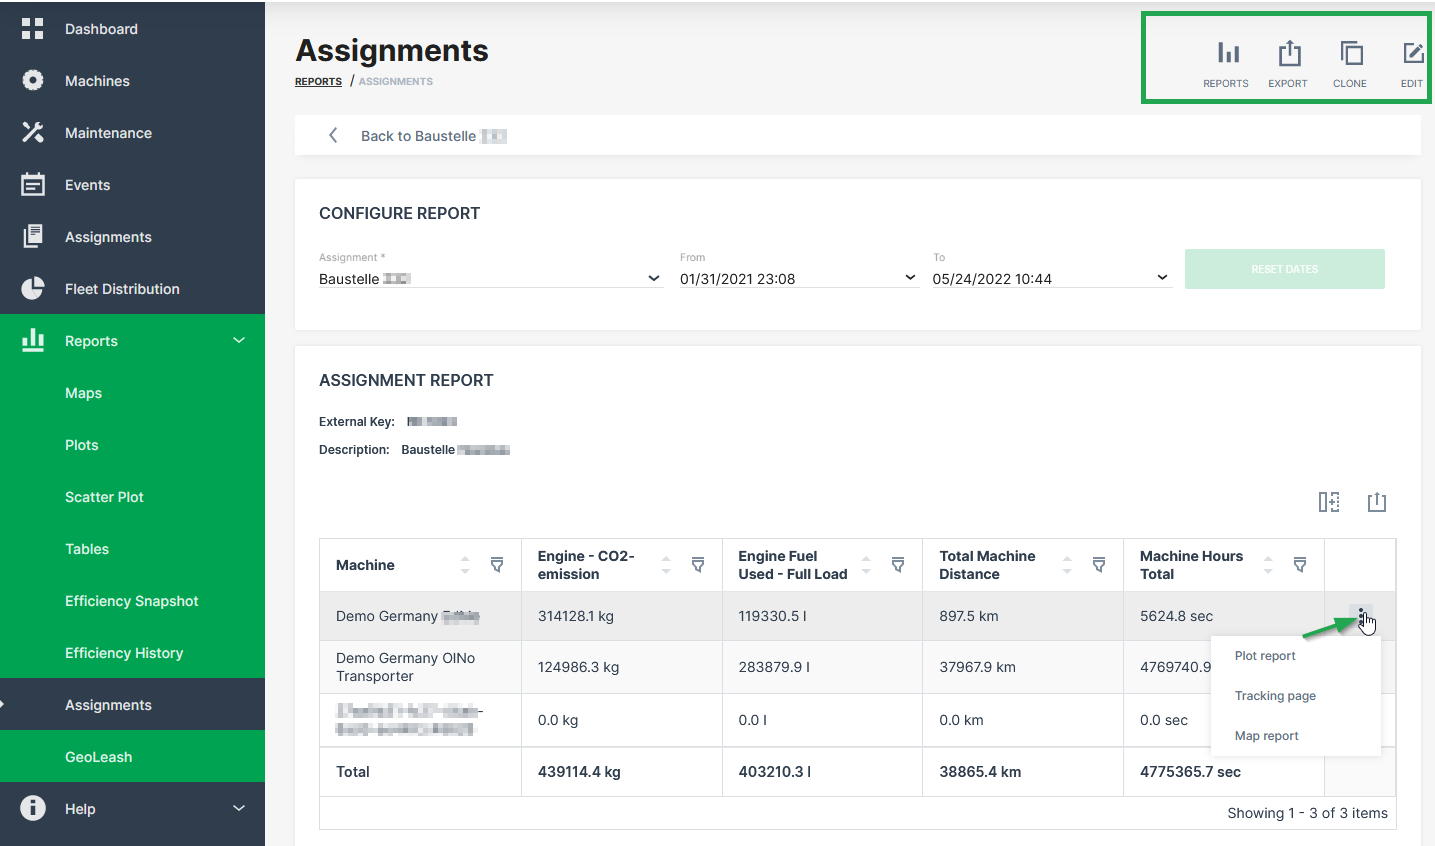
Generate Email Notification
To get informed when the assignment is at status completed, it is possible to subscribe for an email notification within the user account settings.
The status of the assignments can be verified at the Assignments Control Panel
The notification gets triggered when the right status indicator is at COMPLETED:
formalpara-title Assignment Status
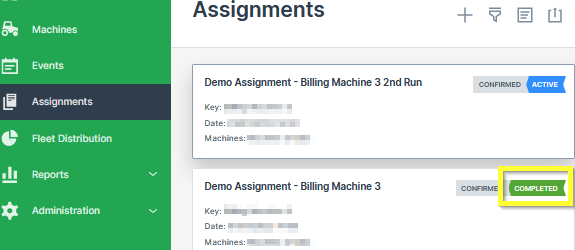
-
Click on My Account > Notifications.
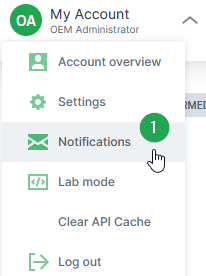
Figure 6: Subscribe for Assignment Notification -
Enable the toggle switch for Assignment Completion.
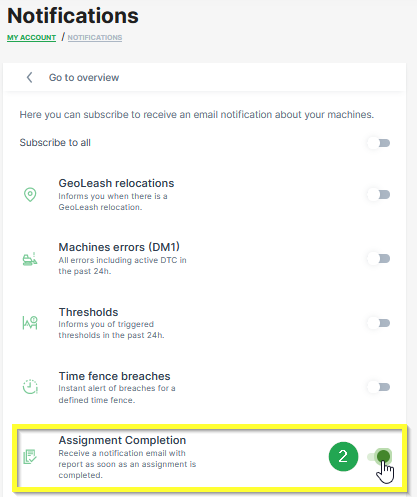
Figure 7: Enable Assignment Completion An email with a summary and a link to the corresponding assignment is sent to the configured email address of your user account:
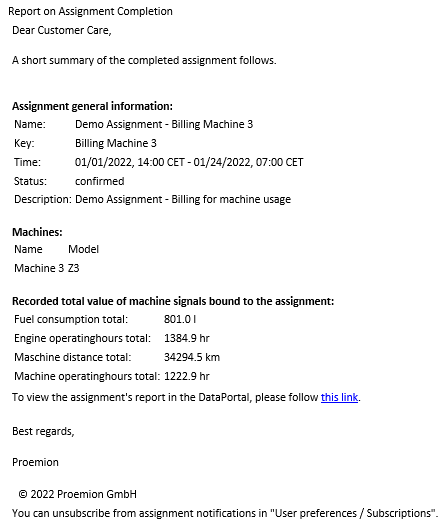
Figure 8: Assignment Completion Notification
Note
The interval of the cyclic assignment completion check for notifications is 30 minutes. After the assignment has been recognized as completed, there may be a maximum delay of 30 minutes in sending the email.
Generate Event
When an assignment is marked as completed, it will also appear in the DataPortal Events list.
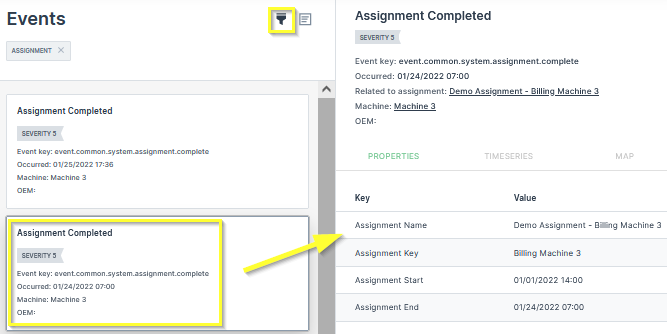
Reporting Tools
Report Parameters
This page provides an overview of the general report parameters shared between the different Reporting Tools.
The report parameters in all reporting tools are largely similar. The available reporting tools are:
Depending on the assigned Permission Set, users can view, generate, or create reports.
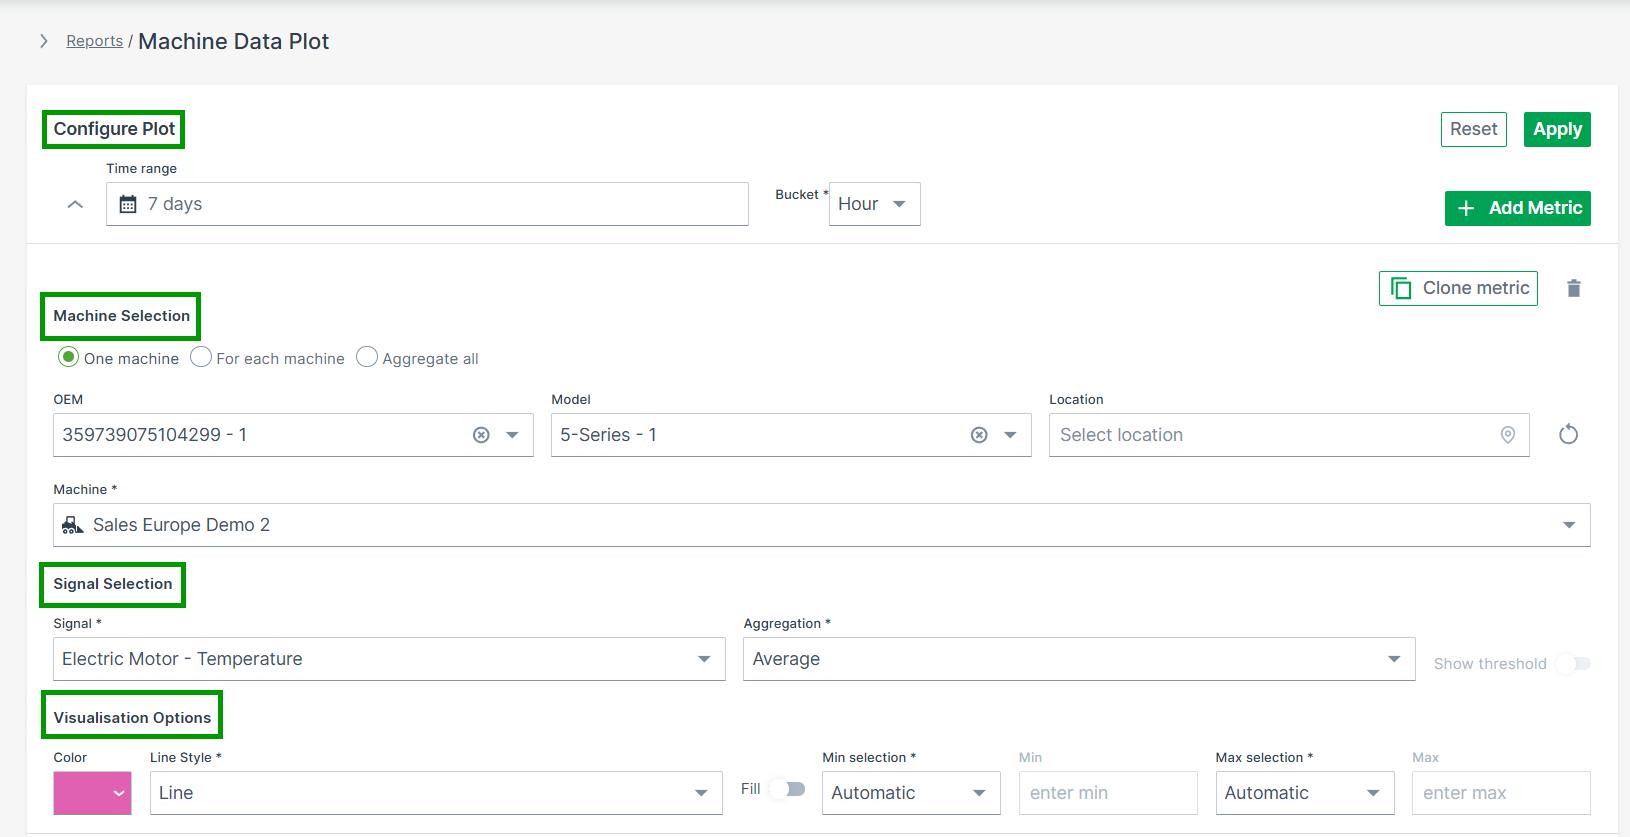
All reporting tools share common UI behavior:
- Collapsible sections: Configuration sections are collapsible, allowing users to minimize completed metrics for a cleaner overview. The number of configured metrics remains visible when collapsed.
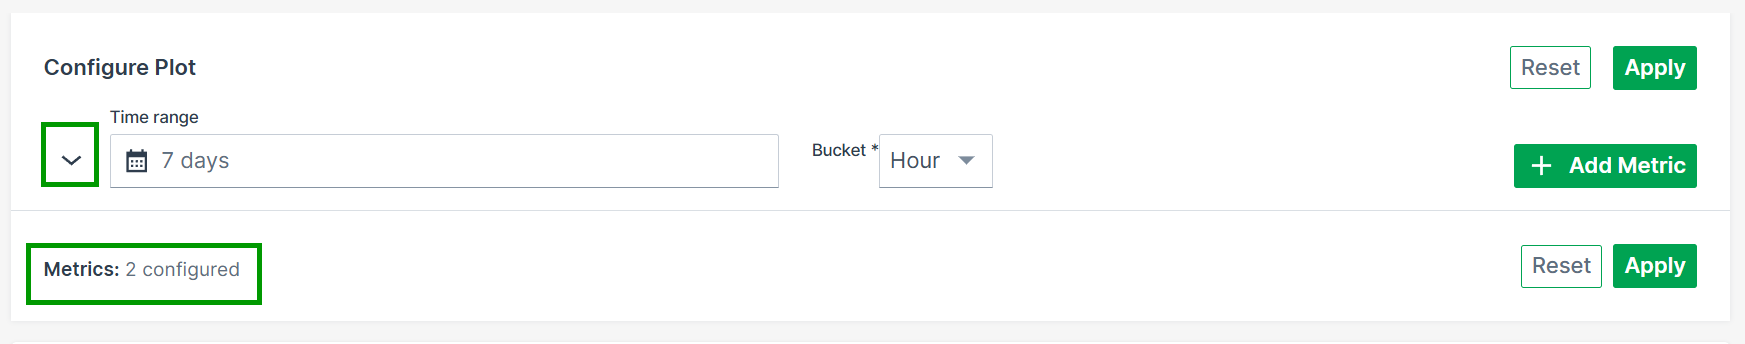
Metric limit: Each report can include up to 20 metric configurations.
The general parameters are summarized below.
Configure Report
Defines the time range and aggregation settings.
- Time Range – Select a Relative or Absolute period for the data to be displayed
- Bucket – Defines the time unit used to aggregate data points (e.g. Second, Minute, Hour or Day)1.
- Apply / Reset – Apply the selected configuration or reset all parameters
Machine Selection
Defines which machines are included in the report and how results are aggregated.
Choose how machines are handled in the report:
- One machine – Select a single machine
- For each machine – Display results per machine
- Aggregate all – Summarize data across all selected machines
The Machine Selector is only available when One machine is selected.
Machine Selector
The Machine Selector allows you to search, filter, and select machines within a single panel.
- Opens when clicking on the input field
- Displays all available machines if no search term is entered
-
Supports search by:
- Name
- Serial number
- VIN
- PIN
-
Filters – Narrow down machines directly in the selector:
- Location (e.g. Continent, Country)
- Model
- OEM
- Organization
-
Show Selected – Filters the list to display only the currently selected machines
-
Machine counts update dynamically based on the applied filters
- Selecting a machine automatically closes the panel
- Selected machines and filters persist when reopening the selector
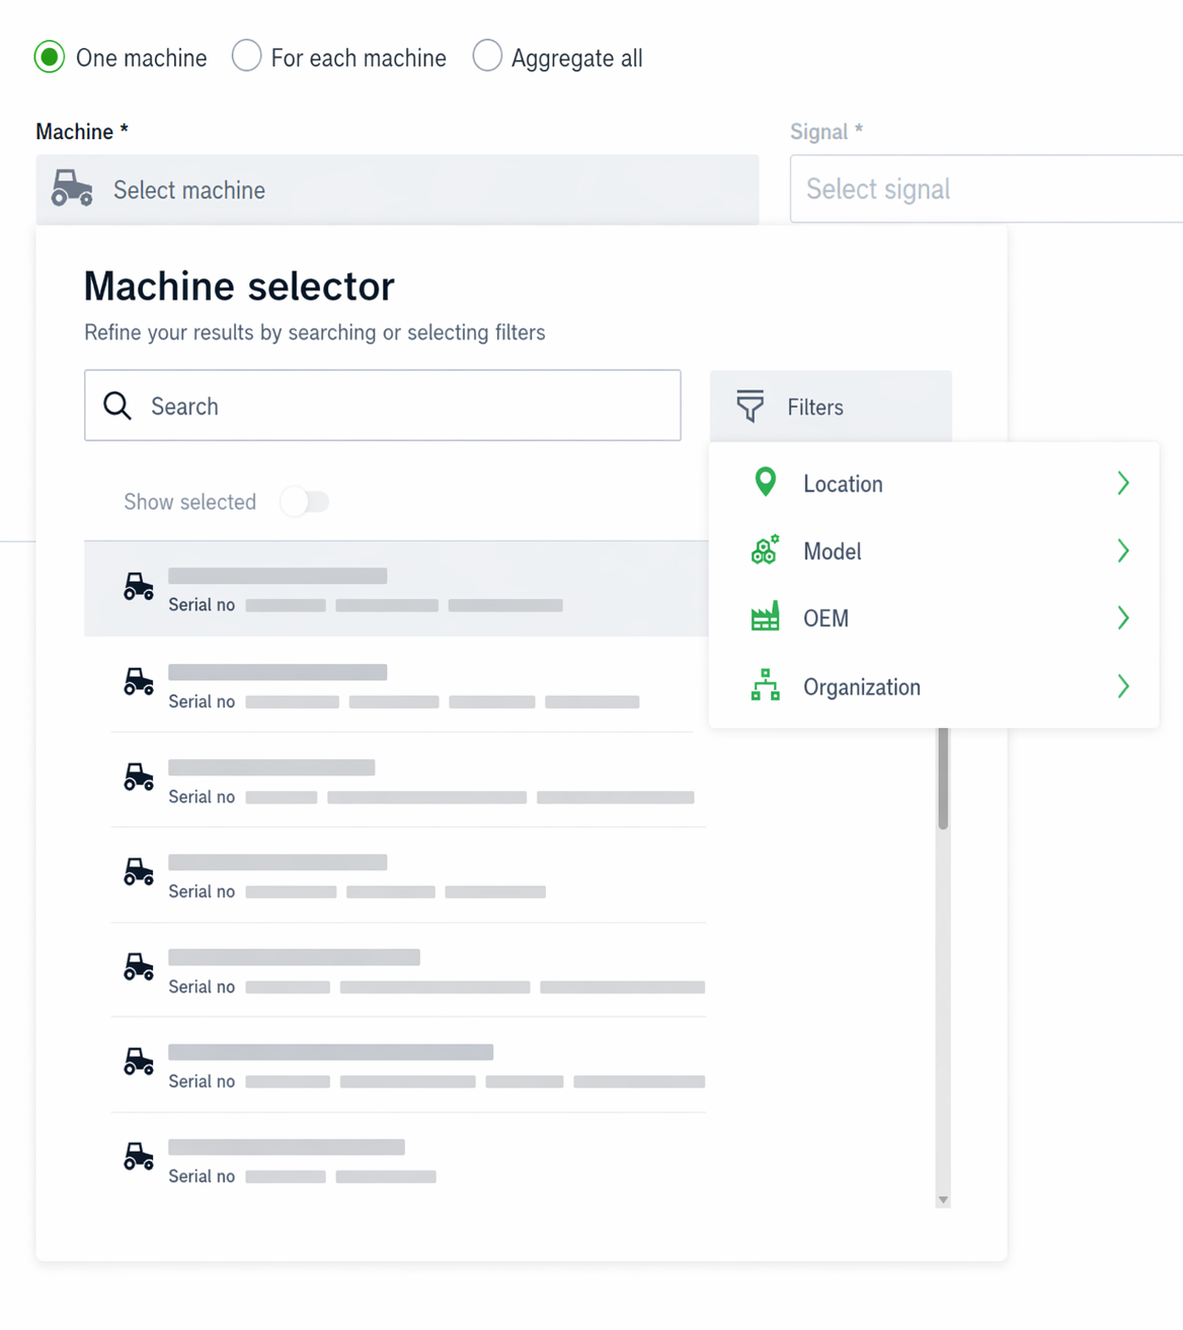
Signal Selection
Defines which signal(s) are visualized in the report.
- Signal – Choose the signal to be analyzed
- Aggregation – Defines how signal values are calculated (e.g. Minimum, Maximum, Average)
- Show Threshold – Displays the defined threshold, if available
Visualization
Controls how the data is displayed.
- Color – Select the display color for the configured metric
- Advanced Options – Additional visualization settings (e.g. line style, fill, thresholds, min/max configuration)
Add / Clone Metric
Enables adding or duplicating metrics within the same report.
- + ADD METRIC – Add another signal or machine
- Clone Metric – Duplicate an existing configuration
Apply / Reset
Executes or clears the current configuration.
- Apply – Updates the report using the selected parameters
- Reset – Removes all configured selections
-
The Second bucket can be selected only if the time range is less than 3 hours (i.e. 2h 59 minutes or less) and the time range type is set to Absolute. ↩
Plots
Plots are the standard reporting tool used to visualize signal variation during a time period in the DataPortal.
You can design a report to visualize data for multiple signals for the same time period, and/or compare an identical signal from multiple machines.
Configure a Plot by following the steps below:
-
Select Reports from the left-hand menu to expand the DataPortal reporting menu.
-
Go to Reporting Tools > Plots.
-
Set up the general parameters and the Plot specific parameters (described in the section below) to configure your Plot.
Example
The following example shows data for an identical signal (Electric Motor - Temperature) from 2 different machines within a time range of 1 week. For each measurement, the unit is displayed on the axis and in the tool tip.
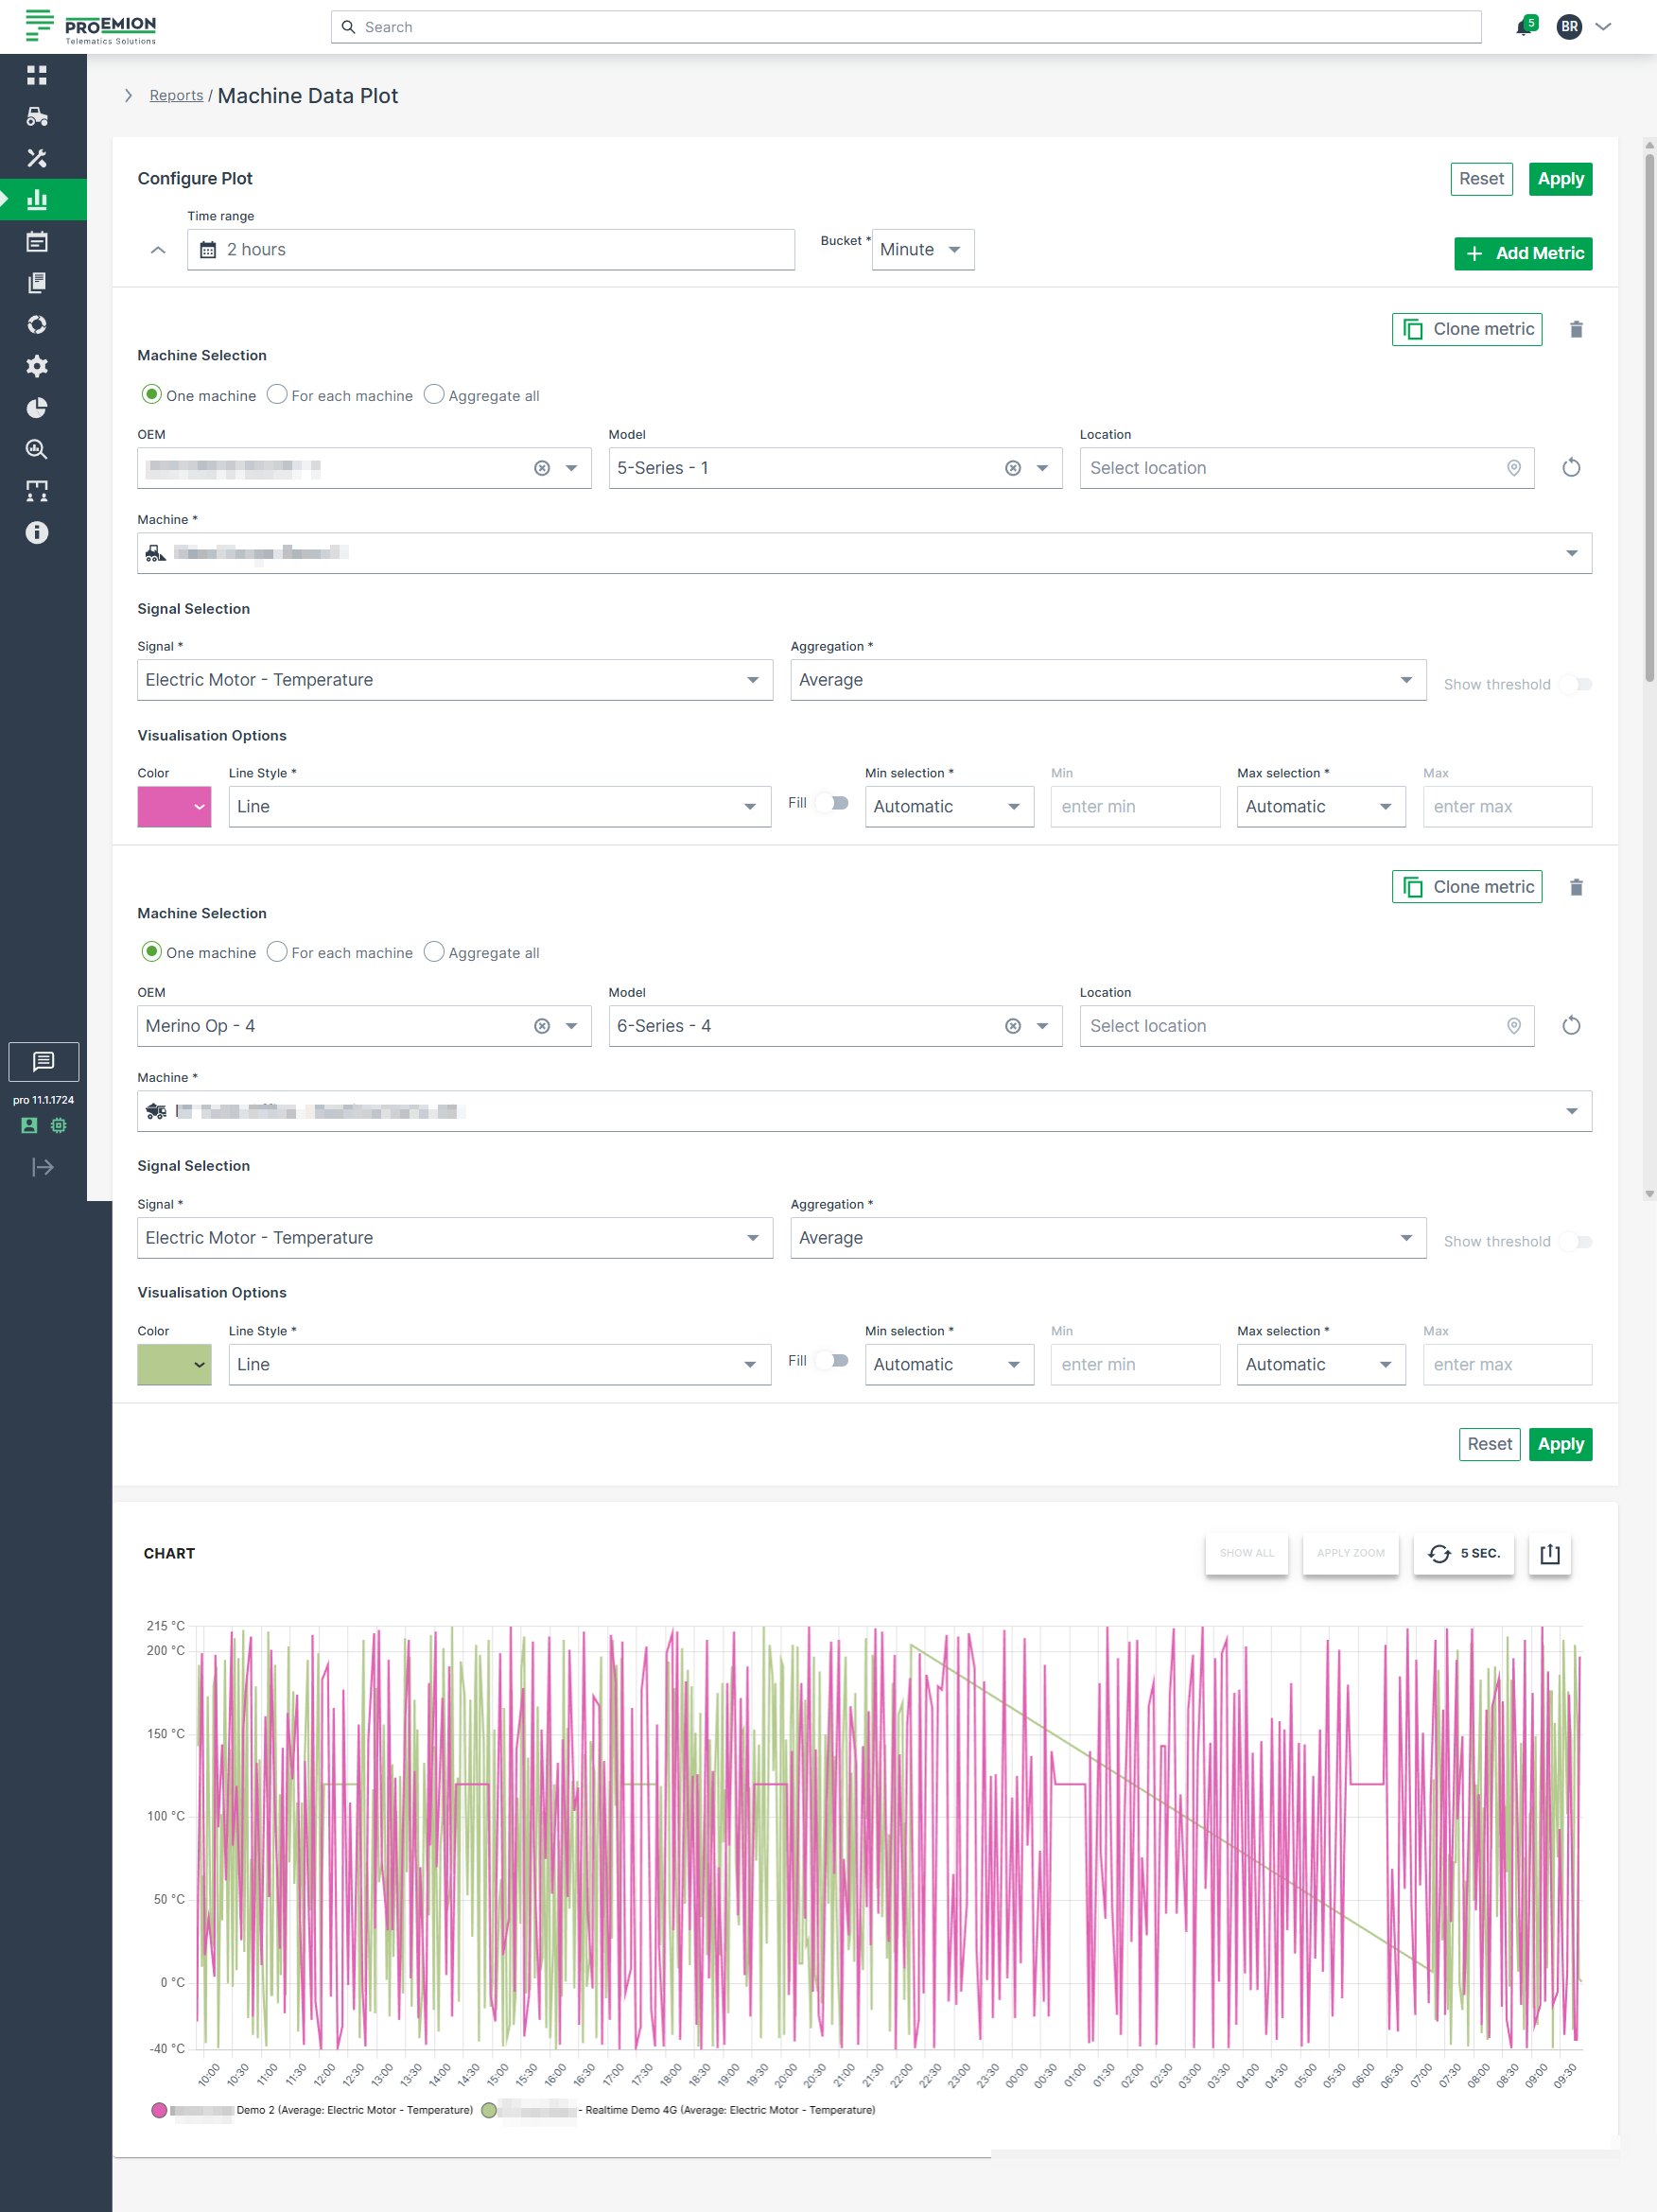
Plot Specific Parameters
The following settings are specific to Plots and extend the general configuration options.
| Configuration Section | Description |
|---|---|
| Advanced Options | Choose from various line styles to define how data is displayed: - Line (default) - Dashed Line - Dotted Line - Heavy Line - Step - Column |
Multi-Graph Layout
Plots support a multi-graph layout that allows data to be displayed in multiple synchronized charts.
After applying a Plot report, users can choose between different grouping modes to restructure the visualization.
When printing or downloading grouped Plots, each chart is exported separately to preserve a readable layout. Charts are automatically scaled to fit the available page or file size.
The following grouping modes are available:
| Grouping Mode | Description |
|---|---|
| None | Displays all configured datasets within a single chart without applying grouping. |
| Metric | Groups datasets by the configured metric. A separate chart is created for each metric. |
| Machine | Groups datasets by machine. A separate chart is created for each machine. |
| Unit | Groups datasets by measurement unit. A separate chart is created for each unique unit. |
Examples
Grouped by Metric
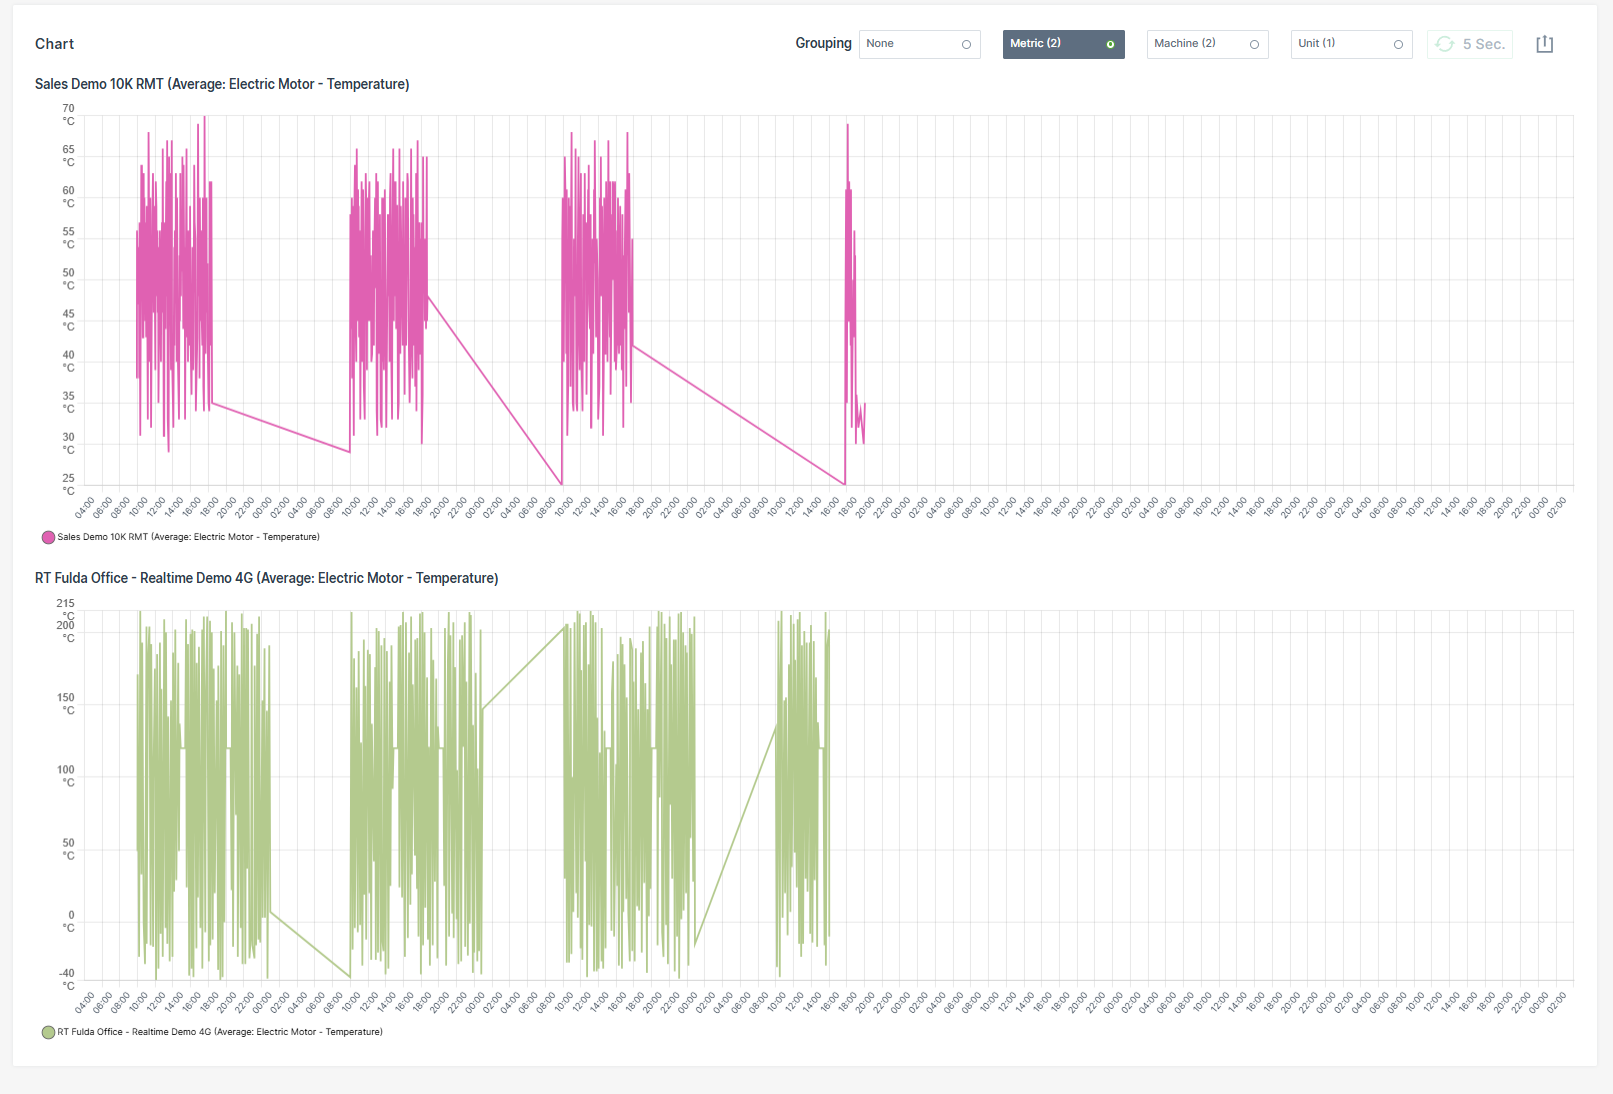
Grouped by Machine
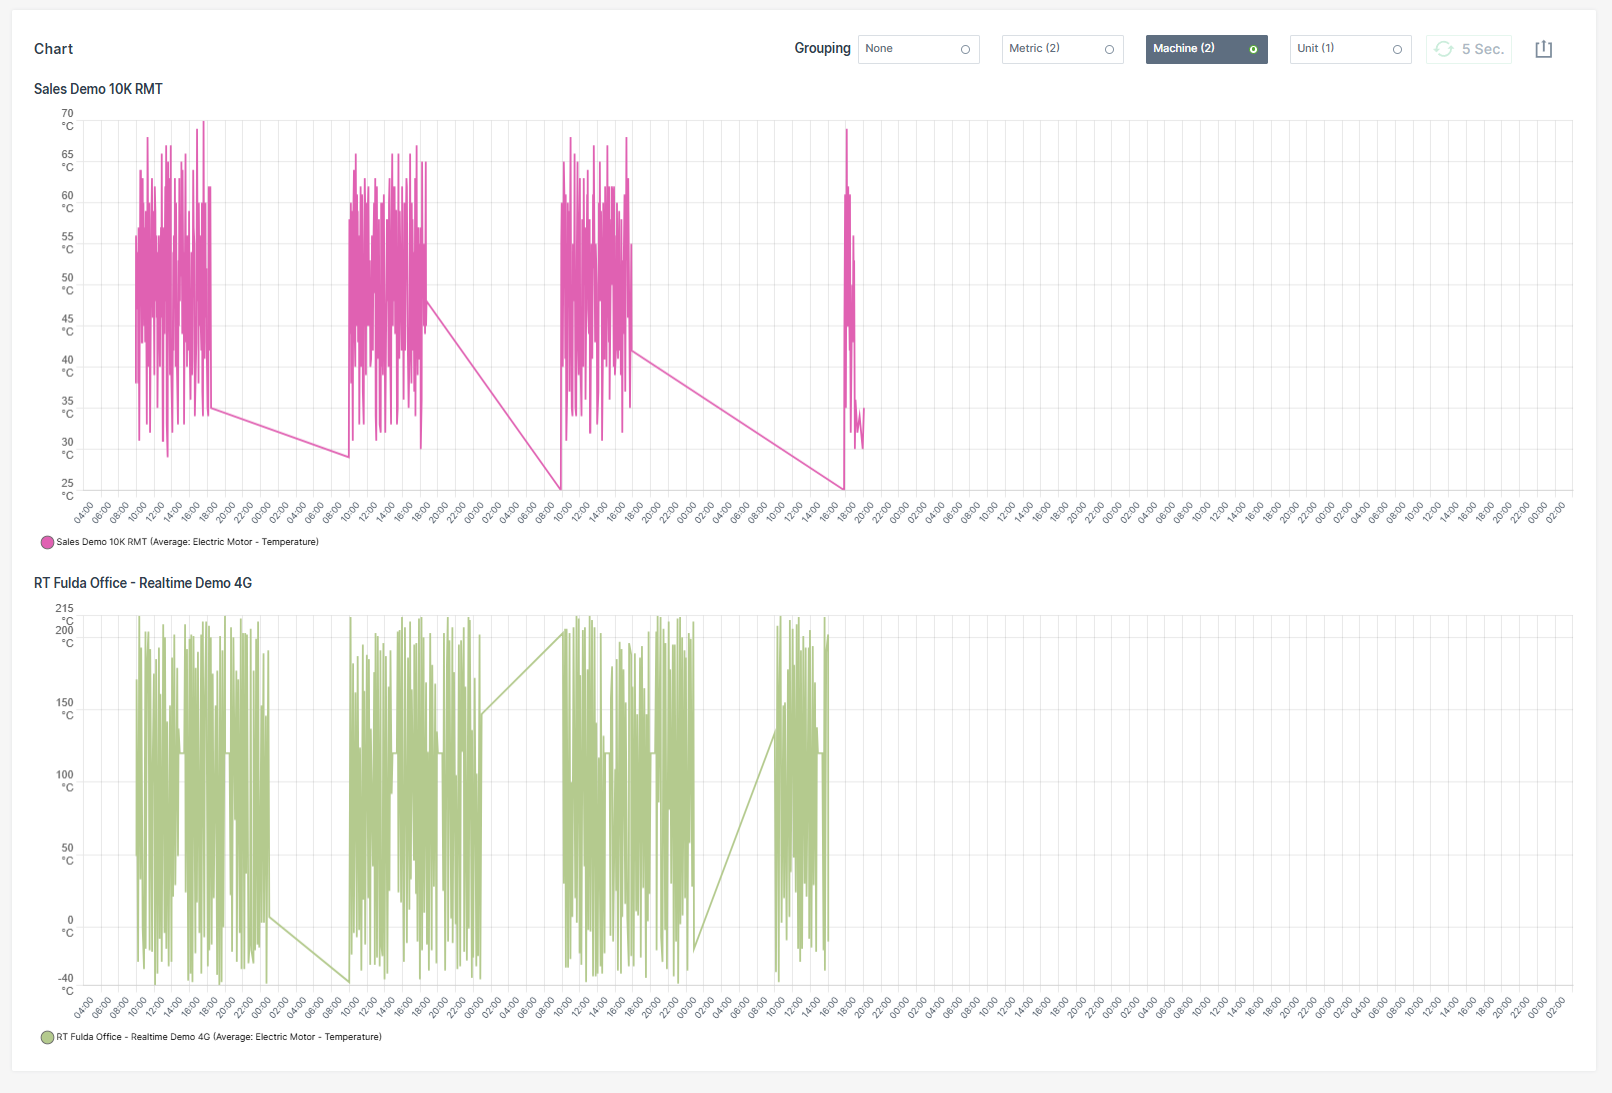
Grouped by Unit
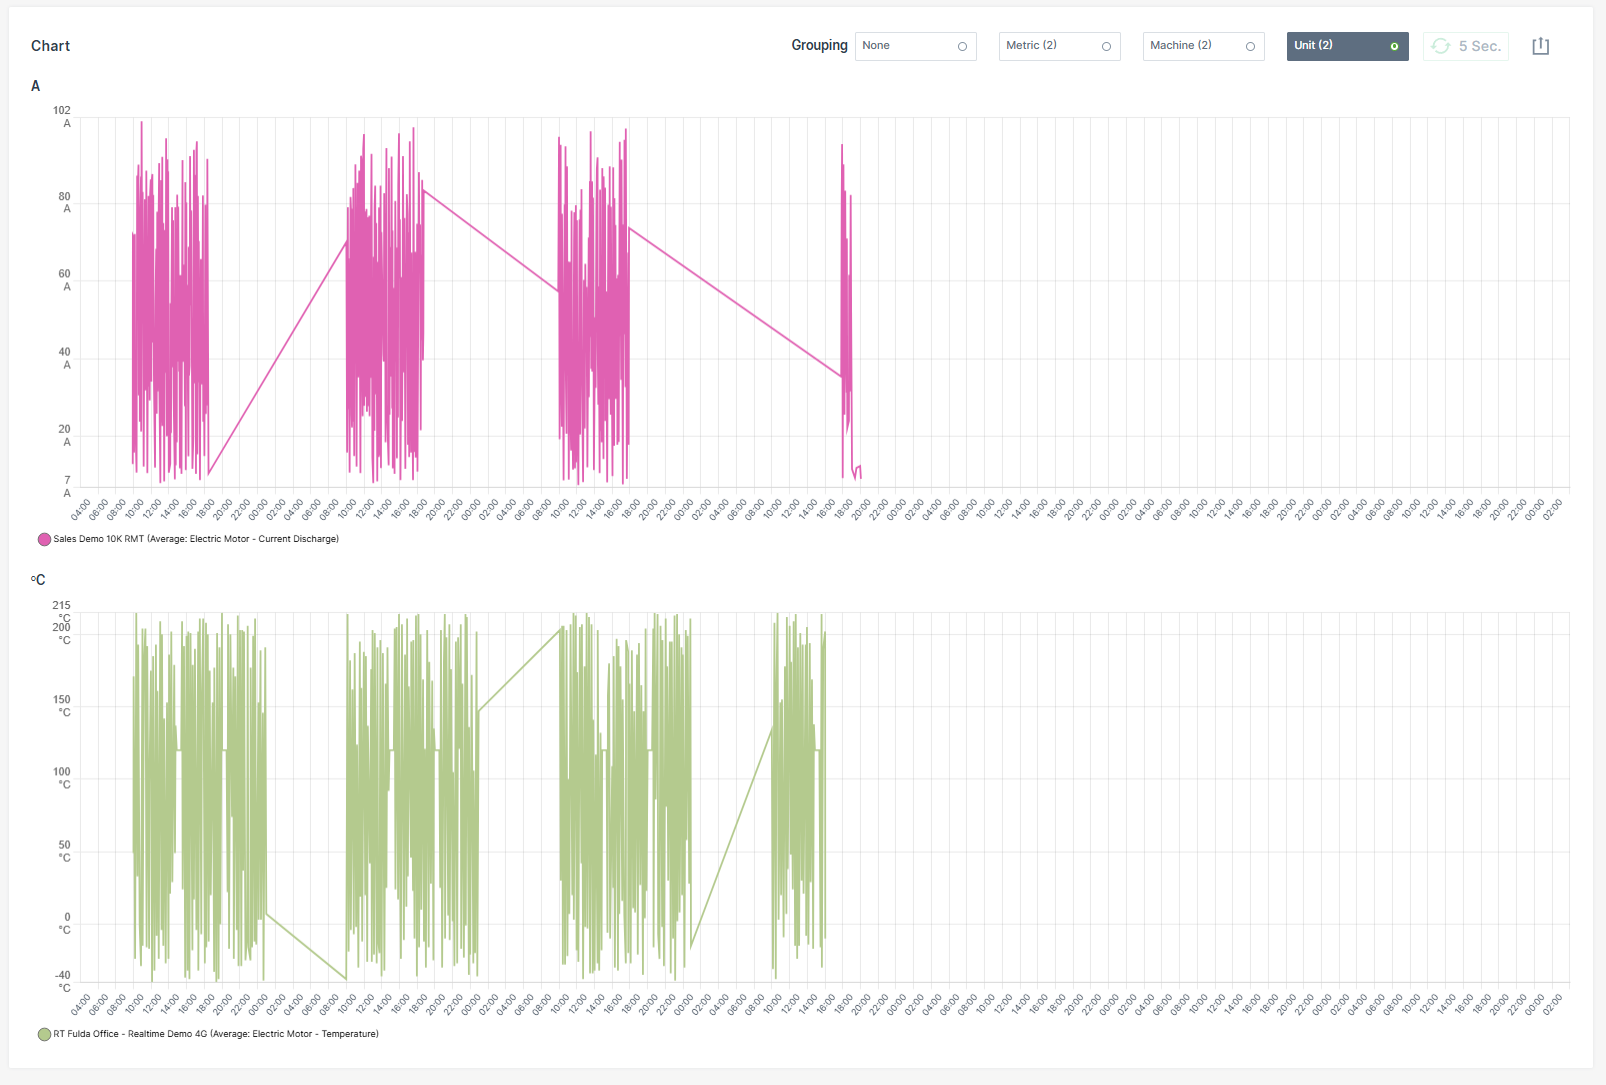
Synchronized Chart Interaction
Hovering over a chart synchronizes the cursor position and tooltip across all grouped charts.
Zooming into a time range in one chart automatically applies the same zoom level to all grouped charts.
| Chart Option | Description |
|---|---|
| Show all | Resets the Plot to the default zoom level, displaying the entire selected time range. |
| Apply Zoom | Drag a frame with the mouse pointer over a desired time interval to zoom into that period. If the Plot is already zoomed in, clicking Apply Zoom refines the resolution of data points by automatically switching the bucket size to the highest available resolution for that zoomed interval. |
| Grouping | Reorganizes the Plot into multiple synchronized charts based on the selected grouping mode: - None - Metric - Machine - Unit |
| 5 Sec. | Enables real-time monitoring by refreshing the data every 5 seconds. |
| Export Menu | Provides multiple options to share or save the report: - Request raw dataset - Download image formats: PNG, JPEG, PDF - Export data as CSV or XLSX - Print chart - Share link: Copy to clipboard or Input into address bar to save the report URL as a browser favorite. See note 1. |
Plot Export of Raw Data
The Request raw dataset option from the Export Menu allows to export the raw data of a configured Plot.
Note
When the configuration of the machine data Plot exceeds the maximum of 10 machines and 10 signals for a time range of up to 7 days, the Request raw dataset option is greyed out and a mouseover message with the allowed configuration settings will appear.
Once the export is completed, an email containing a download link for the corresponding *.csv file will be sent to the user.
The download link is valid for 24 hours only.
Visualization grouping does not affect CSV or XLSX raw data exports. Exported raw datasets always contain the original ungrouped data.
To export the raw data for a configured Plot, proceed as follows:
- Configure the Plot with a time range of max. 7 days, 10 machines and 10 signals.
- Click Apply.
- Click the Export icon.
-
Select Request raw dataset option.
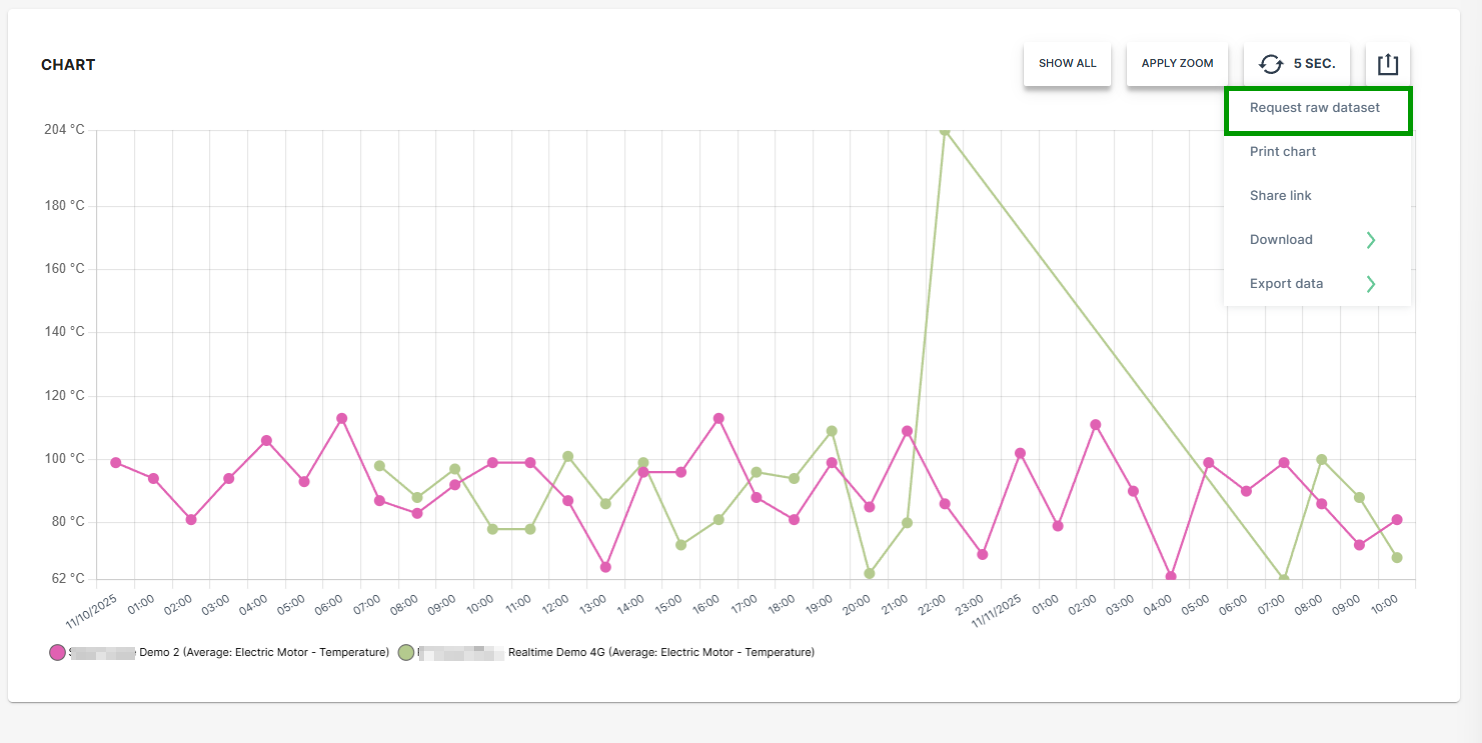
Figure 4: Request Raw Dataset -
Select the desired option for the time stamp settings.
-
Click SEND REQUEST.
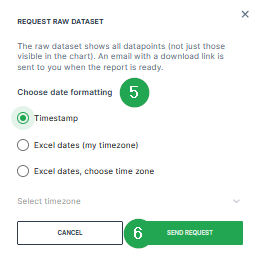
Figure 5: Request Raw Dataset - Send Request A confirmation that the request has been processed will be displayed.

Figure 6: Request Raw Dataset - Confirmation -
Check the inbox of your user email address.
-
Once the export has finished, an email with the download link for the .csv file is received.
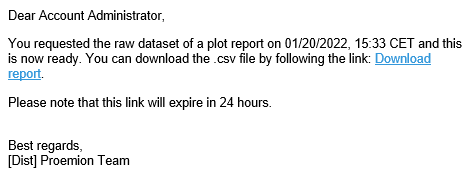
Figure 7: Request Raw Dataset - Email -
Download the provided
*.csvfile.
The raw data within the *.csv file can be used for further processing and analysis.
Visualization grouping does not affect CSV or XLSX raw data exports. Exported raw datasets always contain the original ungrouped data.
Accessing Reports Through Widgets
Widgets that display Time Series Data have a graph icon  in the upper right-hand corner. Click on the icon to open the Report Parameters for the signals displayed in the widget.
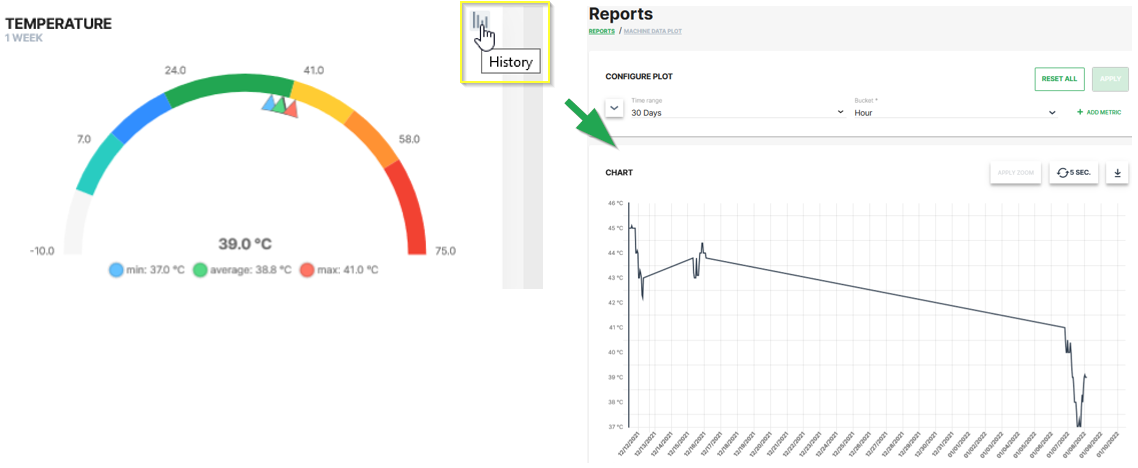
The report allows you to view the historical variations of the selected signal for a given time period.
-
This procedure allows you to reopen a preconfigured report at a later point of time. ↩
Maps Report
The Maps report allows the user to view information about the movement of the machine, its current location or its tracks covered during a selected time period.
Several machines can be added on the same map and information will be displayed for the same time period.
The different tracks can then be viewed and compared for the different machines or time period selected.
Note
The Map report can only display data for a maximum time range of 7 days. Limiting the time range can also improve map performance and resolution of the tracks.
To use this feature, the Location:Location history Permission Set is required.
To configure a Map report, proceed as follows:
-
Select Reports from the left-hand menu to expand the DataPortal reporting menu.
-
Go to Reporting Tools > Maps.
-
Set up the general parameters and the Map specific parameters (described in the section below) to configure your Map.
Example
The example shows a single machine track covered for the last 24 hours.
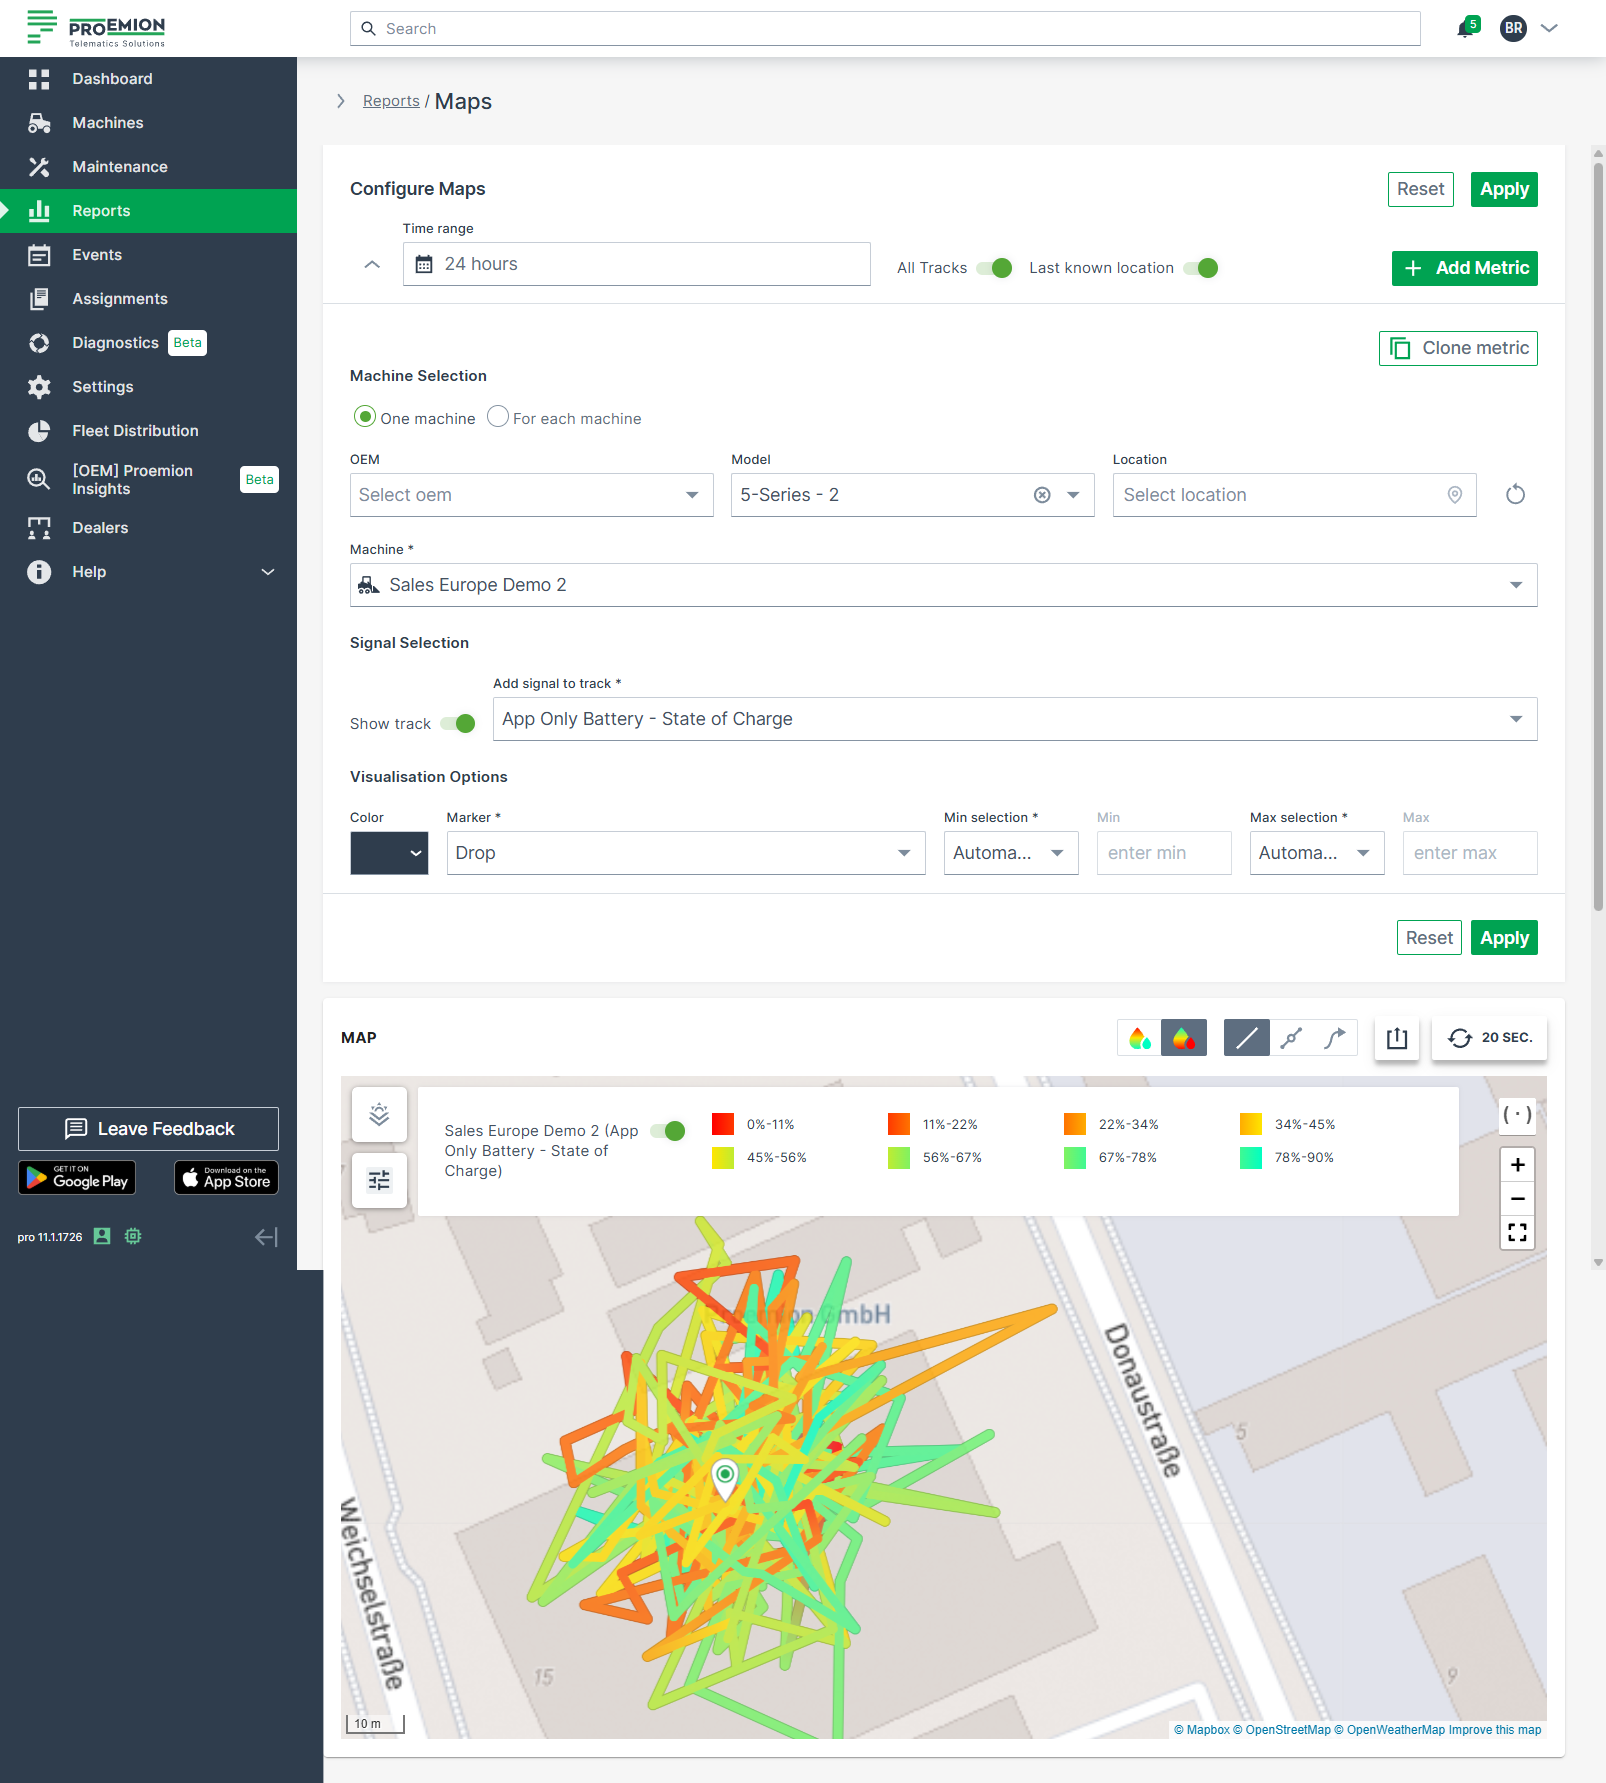
Note
The number of allowed waypoints may be limited on the map. A higher resolution view of the path is possible by limiting the displayed time range.
Map Specific Parameters
| Configuration Section | Description |
|---|---|
| Signal Selection | Show track: To display a track with metric for a given time range and machine, this option must be enabled. Add signal to track: Select the signal which needs to be displayed along the track. |
| Visualization Options | Definition of Minimum and Maximum value: This is the option to define the minimum and maximum value of the selected signal which needs to be displayed with a color gradient. It is recommended to leave the Minimum and Maximum at Automatic mode. If required, it is also possible to manually define own thresholds. Values which are outside the min/max range will be marked in grey then |
| Map Visualization | Description |
|---|---|
| Track option | Adapt the displayed tracks on the map: - All Tracks: Show tracks on the map for all machines. You may toggle the track for single machines. - 20 sec: Enable real-time monitoring by clicking this button and the position of each machine is updated every 20 seconds. Clicking again disables real-time monitoring. Note that you must activate the realtime mode toggle in Behavior Options beforehand. |
| Legend | Display the legend for a signal. |
| Export Menu | Provides multiple options to share, save, or export the displayed data: - Share: Page URL is copied to your clipboard. - Download Map: Save the current map view as an image (PNG, JPG, PDF). - Export data: Export both the reported GNSS (track) data and the signal data of a machine displayed on the map. Signal data (CSV, XLSX): Contain raw signal values per timestamp. GNSS (track) data (KML, GPX): Contain the machine’s movement (track) over time; the current machine position is not included. |
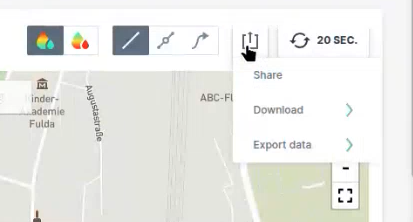
Add Signal to Track
Note
The Add Signal to Track function is only available for a maximum number of 5 data sets.
This feature allows users to display numeric signal values or machine states directly along a machine’s track on the map. This enables the visualization of how a signal changes across different geographic positions, as well as the driving direction of the machine.
Variations of numeric signals are displayed as a continuous gradient, while variations of machine states are shown in discrete colors.
Data points are based on raw signal data and are linked to the closest GNSS position according to their timestamp. For performance and clarity, data points are grouped into invisible clusters — zooming in and out dynamically reveals additional data points and direction arrows along the track.
You can further customize the track appearance using the following Display Options:

-
View track gradient increasing
-
View track gradient decreasing
-
View track only
-
View points on the track (zoom in to reveal more data points)
-
View driving direction on the track (zoom in for detailed direction arrows)
When a machine state is displayed along the track, the legend and corresponding color coding are generated automatically.
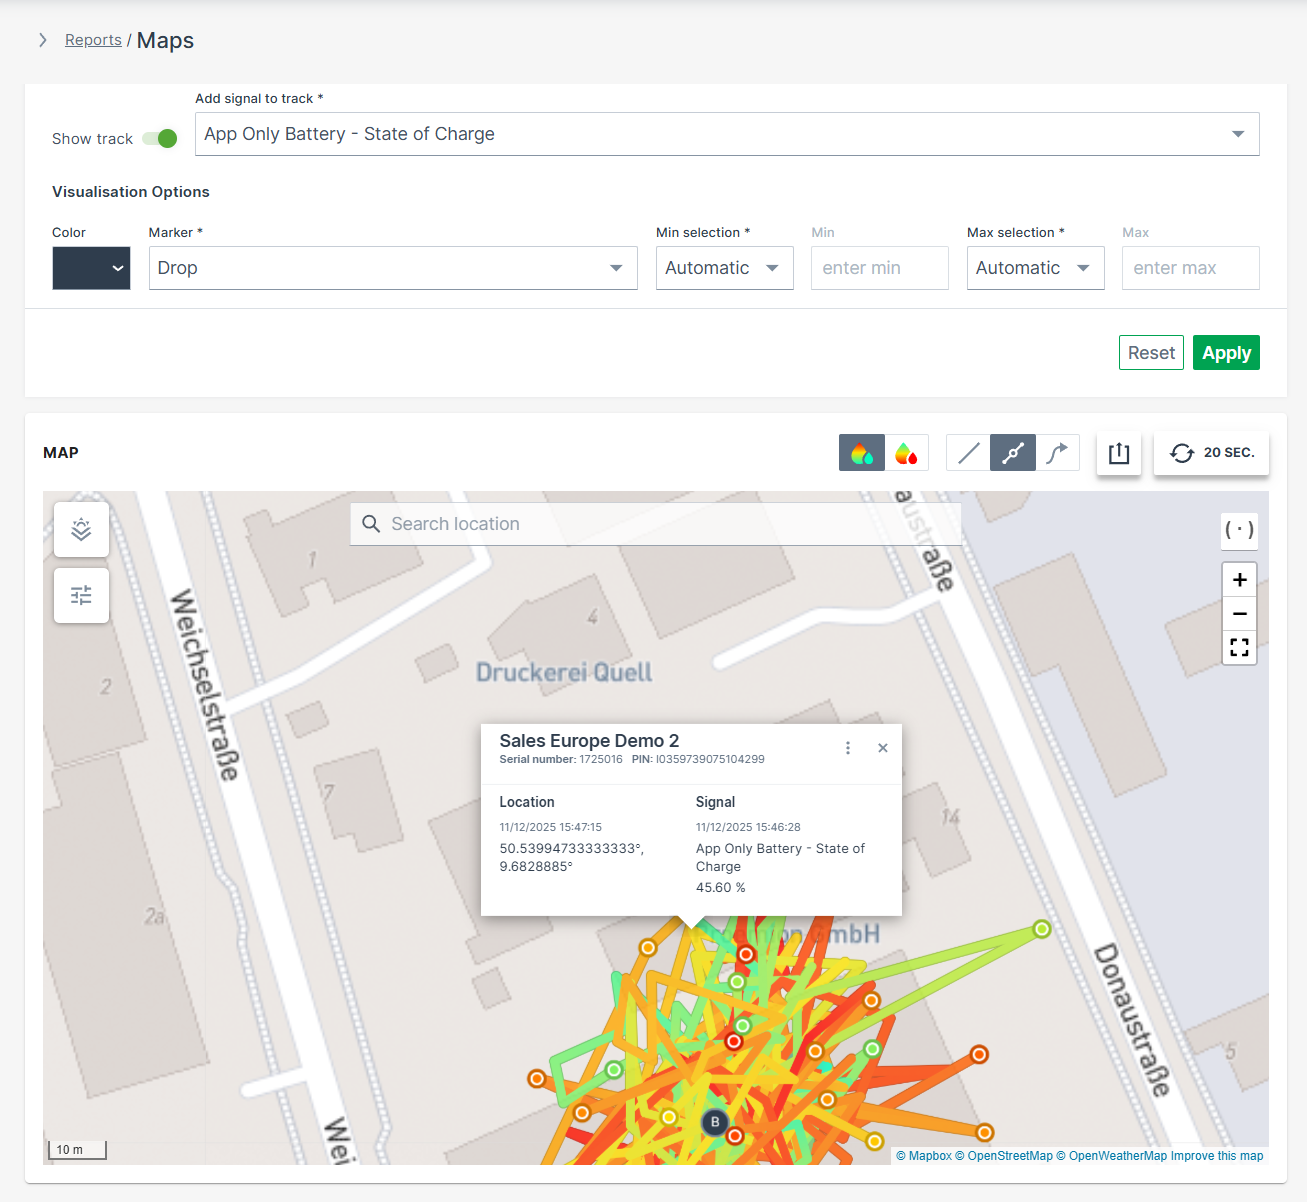
A mouse-click on a specific data point along the track shows the transmitted GNSS position, the signal value/state and its corresponding time stamp. Note that warnings regarding the status of the location are displayed automatically, see Status and Update.
Tables
The Tables report is the simplest visualisation for data sets.
To configure a Tables report, proceed as follows:
-
Select Reports from the left-hand menu to expand the DataPortal reporting menu.
-
Go to Reporting Tools > Tables.
-
Set up the general parameters to configure your Table.
Example
The following example shows the output results of the data sets from different machines of a specific model on a single table.
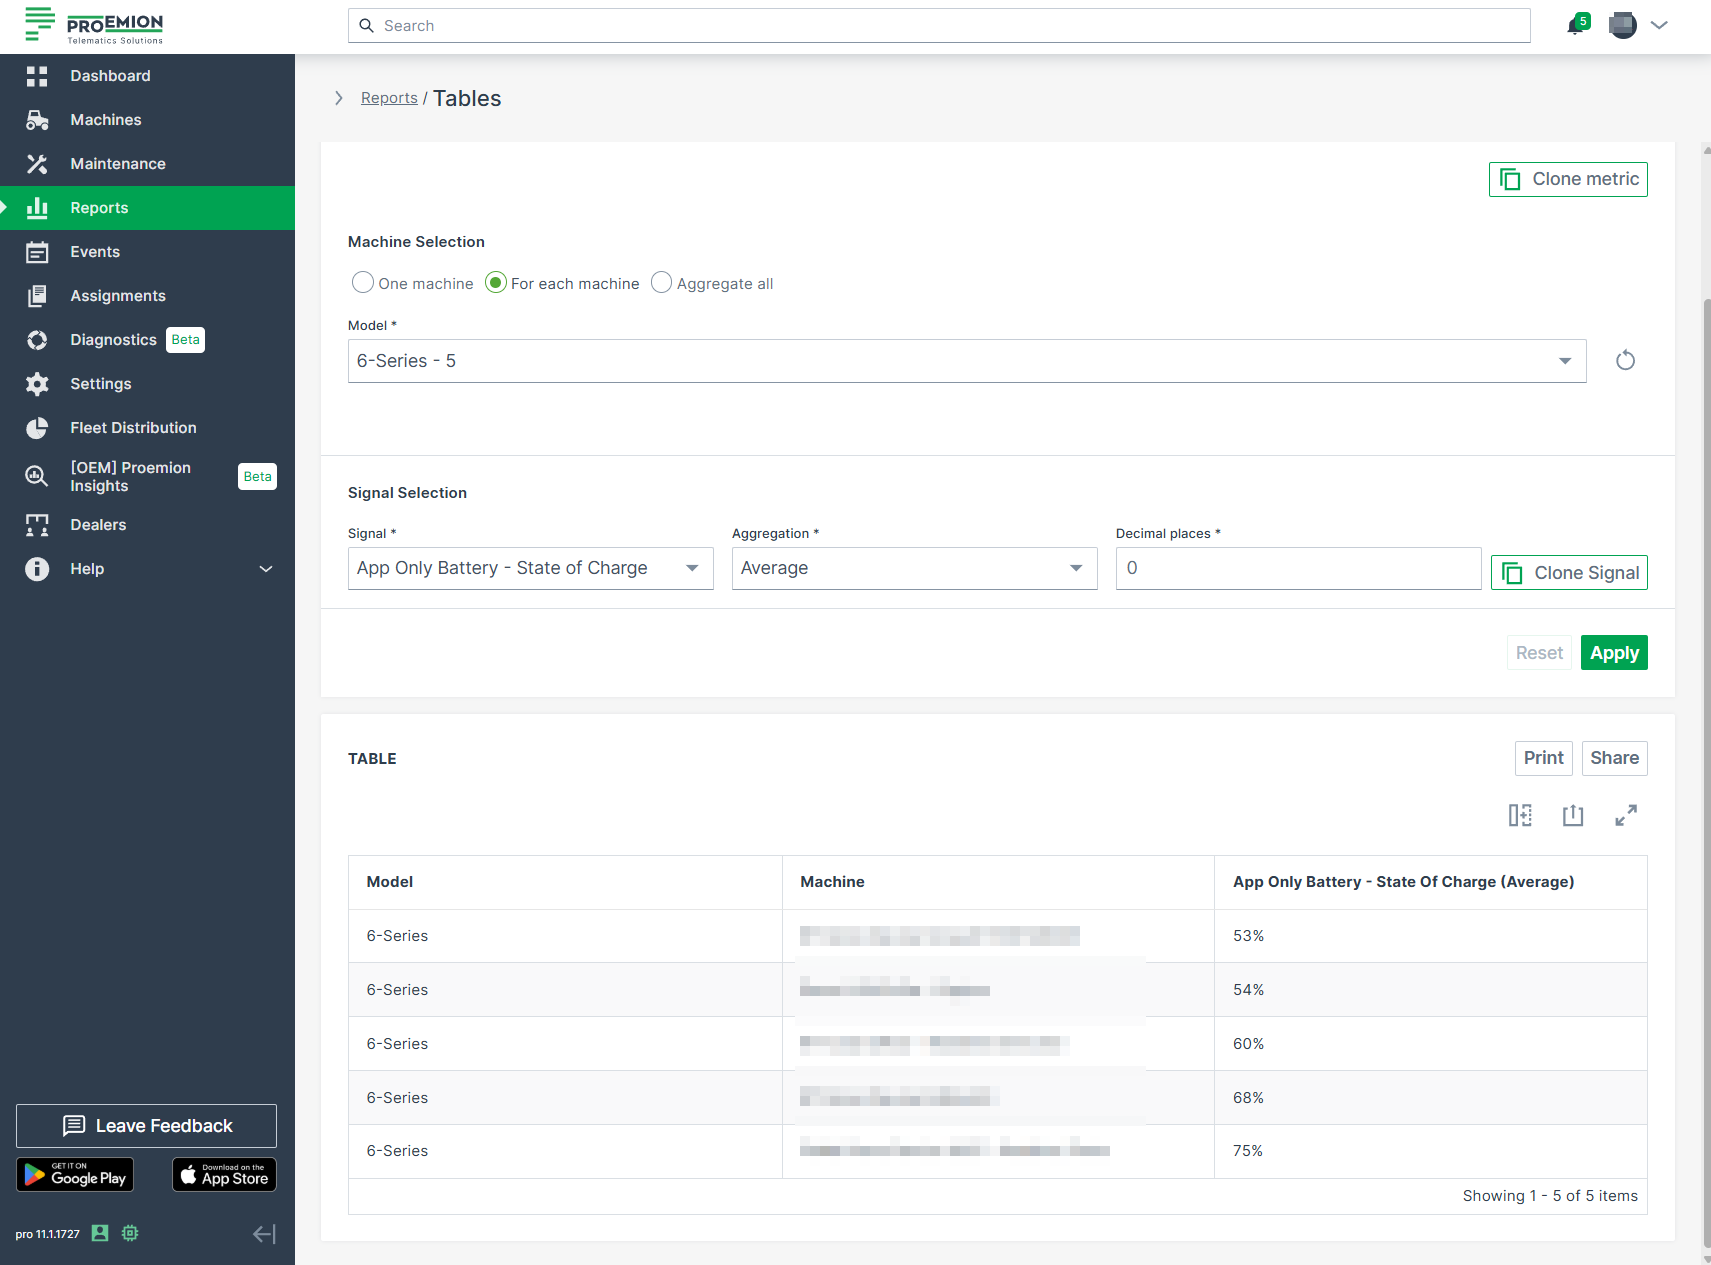
Scatter/Bubble Plots
A Scatter Plot is a two-dimensional plot that uses dots to represent values for two different numeric variables. The position of each dot on the horizontal and vertical axis indicates values for an individual data point. Scatter plots are used to observe relationships between variables.
Scatter Plot
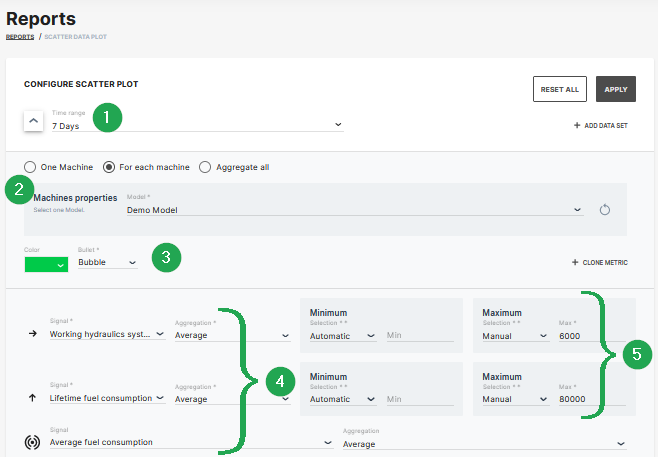
The example shows data sets from machines which belong to a demo model. The plot can be used for visual comparison.
| # | Signal | Description |
|---|---|---|
| 1 | Time Range | Select the time period for the measurements up to the previous 2 years. |
| 2 | Indicator/Color | Choose from bubble, diamond, triangle up, triangle down symbols and the color. |
| 3 | Model/Machine | Select the model and machine to display the comparison. |
| 4 | Signal/Aggregation | Select the signal to be the displayed and the Time Series Data. |
| 5 | Scaling | Scale automatically, manually or use predefined min/max values from PDC. |
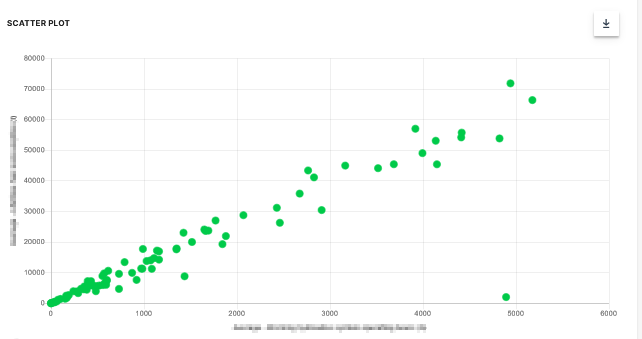
Bubble Plot
The scatter plot can be extended to a bubble plot that is used to look at relationships between three numeric variables instead of two. Each dot in the bubble chart corresponds with a single data point, and the variables’ values for each point are indicated by horizontal position, vertical position, and dot size.
This example shows configuration of a bubble chart:
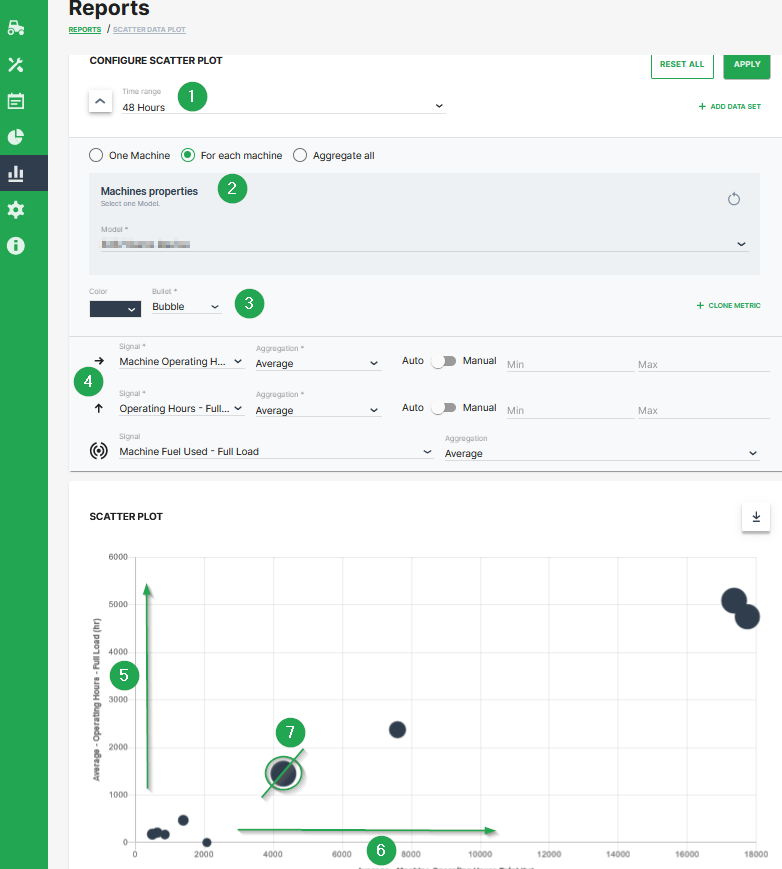
| # | Description |
|---|---|
| 1 | Time range selection. |
| 2 | Selection of a specific machine(s), machines of a certain model and optional aggregation of entire data set. |
| 3 | Color and shape of the marker |
| 4 | Signal selection |
| 5 | Machine Operating Hours - Full Load. Represented by the location of the dot on the vertical axis. |
| 6 | Machine Operating Hours Total. Represented by the location of the dot on the horizontal axis. |
| 7 | Machine Fuel Used - Full Load. Represented by the dot size. |
Additional Functionality
- The chart can be downloaded in various image formats or exported to raw data as shown.
- A slider bar allows the user to zoom in and out of the Scatter Plot or select a specific segment of the data-set to visualise.
Export Center
Export Center Introduction
The Export Center provides exports of (raw) data of your machines.
Available exports/reports:
Fleet Data Export
The Fleet Data Export provides a raw export of machine data as a ZIP file for a maximum of 20 machines for a selected time range.
The export can be used by Machine Owners to download the complete raw data logged within the selected time range of their machines.
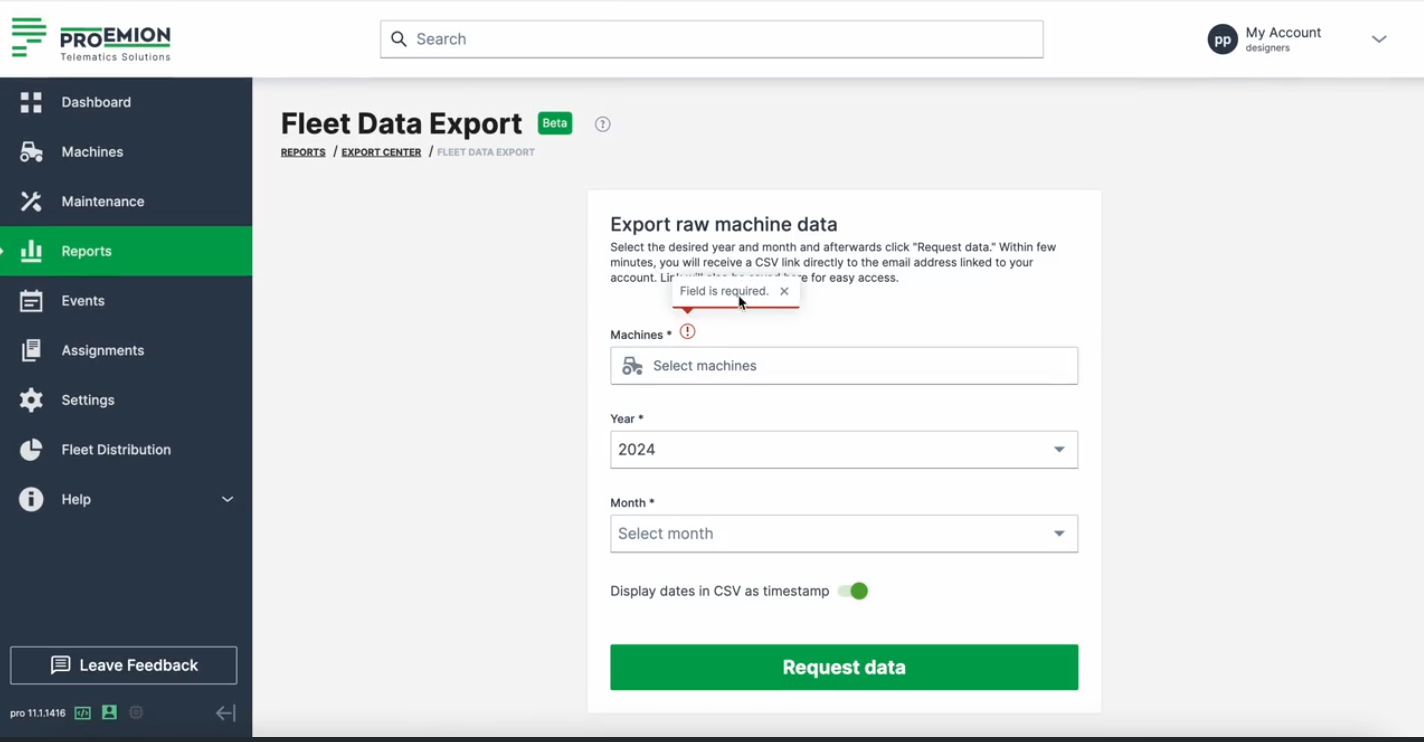
The menu is to be found at Reports > Export Center > Fleet Data Export.
Select Machines
You may select up to a maximum of 20 machines.
You can filter and search machines using the available selection options.
For details on machine selection, filtering, and selector behavior, see Machine Selector.
For the selected machines, you can then proceed to Request Data for their export.
Request Data
To request the export(s), select the desired year and month and select Request data. The start of the export will be indicated in a pop-up:

Each request/export is then added to the Recently requested section where you can directly download it as a ZIP file.
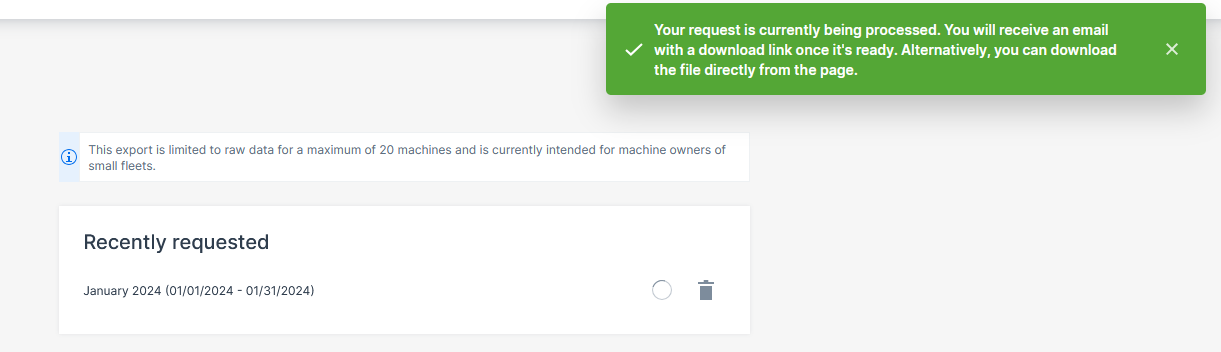
In the Recently Requested section, you can view the status of the export:
-
successful: ZIP file is downloadable.
-
pending: the pending icon shows the files are being generated.
-
failed: the X icon shows the export has failed.
The exports expire after 7 days.
Note
A maximum of 7 exports can be requested and maintained in the DataPortal. If additional reports are needed, it is always possible to delete the available ones in the Recently Requested section so the export possibility will be enabled again.
The links to the exports are also provided in an email sent to the user.
Exported Data
In the exported ZIP file, each machine is included in a dedicated .csv file. The Machines included in export section shows you which machines are considered for the export.
Each CSV file includes data in the following columns:
-
machine_id
-
machine_name
-
machine_serial
-
date_time Optional: To change the default timestamp to a Custom date formatting, remove the Display dates in CSV as timestamp option and select:
-
Excel dates (my timezone) - change to your time zone
-
Excel dates (select timezone) - change to another time zone by selecting the country/city
-
-
signal_key - standard and custom signals, for example "value.common.cu.sim.traffic.month" or "value.custom.machine.battery.stateofcharge"
-
value
Note
Note that the export is targeted to be machine-readable and might not be easily used in common programs like Excel as the files might become very big in size.
Geo-based CO₂ Footprint
The Geo-based CO₂ Footprint report (short CO₂ Report) is a DataPortal feature that automatically generates emissions documentation based on machine telemetry data. It provides standardized, contract-ready emissions information for any selected geographic area (jobsite) and time range — eliminating the need for manual data collection from fuel logs or spreadsheets.
The report consolidates raw telematics data into a unified and verified CO₂ statement suitable for:
- regulatory compliance
- public tender submissions
- internal fleet analysis
- customer reporting
Creating a CO₂ Report
To create a customized report, proceed as follows:
- Navigate to Reports > Export Center > Geo Based CO₂ Footprint to open the overview page.
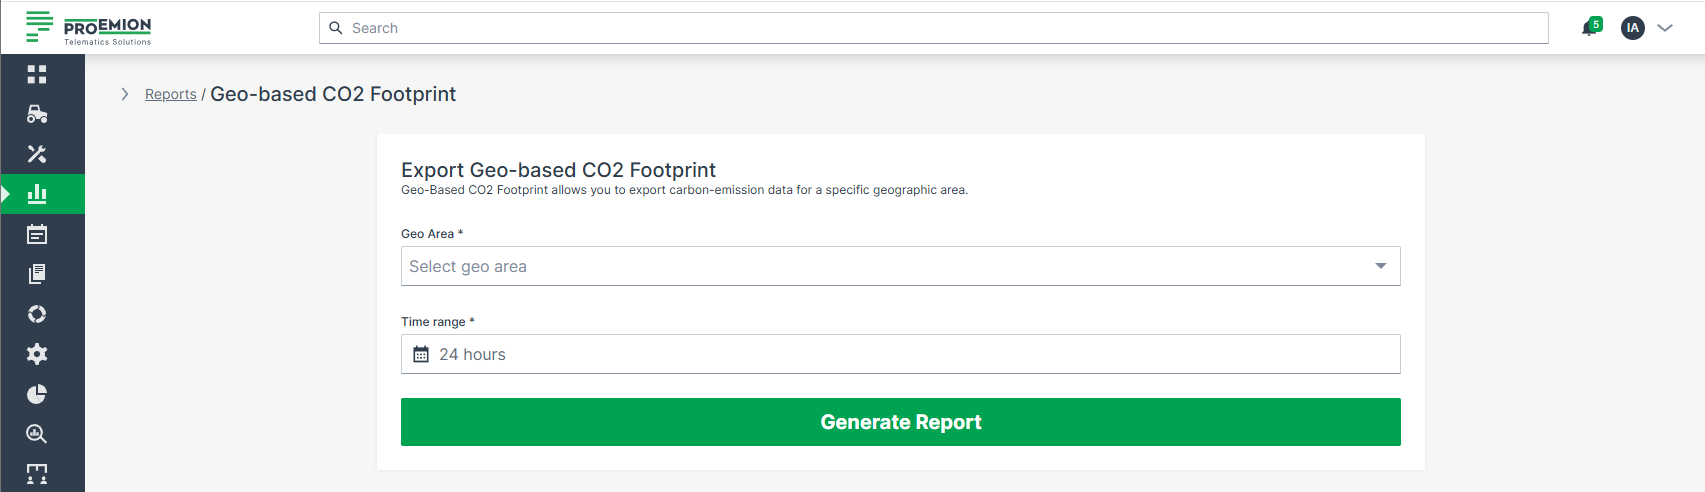
- Select a Geo Area and a Time range. The report includes all machines that enter the selected area during the chosen time range.
- Click Generate Report. A confirmation message appears: Your request is currently processed. You will receive an email with a download link once it´s ready. Alternatively, you can download the file directly from the page.
To define Geo Areas refer to the documentation on how to create Geo Areas.
After submitting the request, the Recently Requested table on the overview page displays your report with the selected Geo Area and Time Range. The report is available in the table for 7 days. From the Status column, you can download or delete the report.
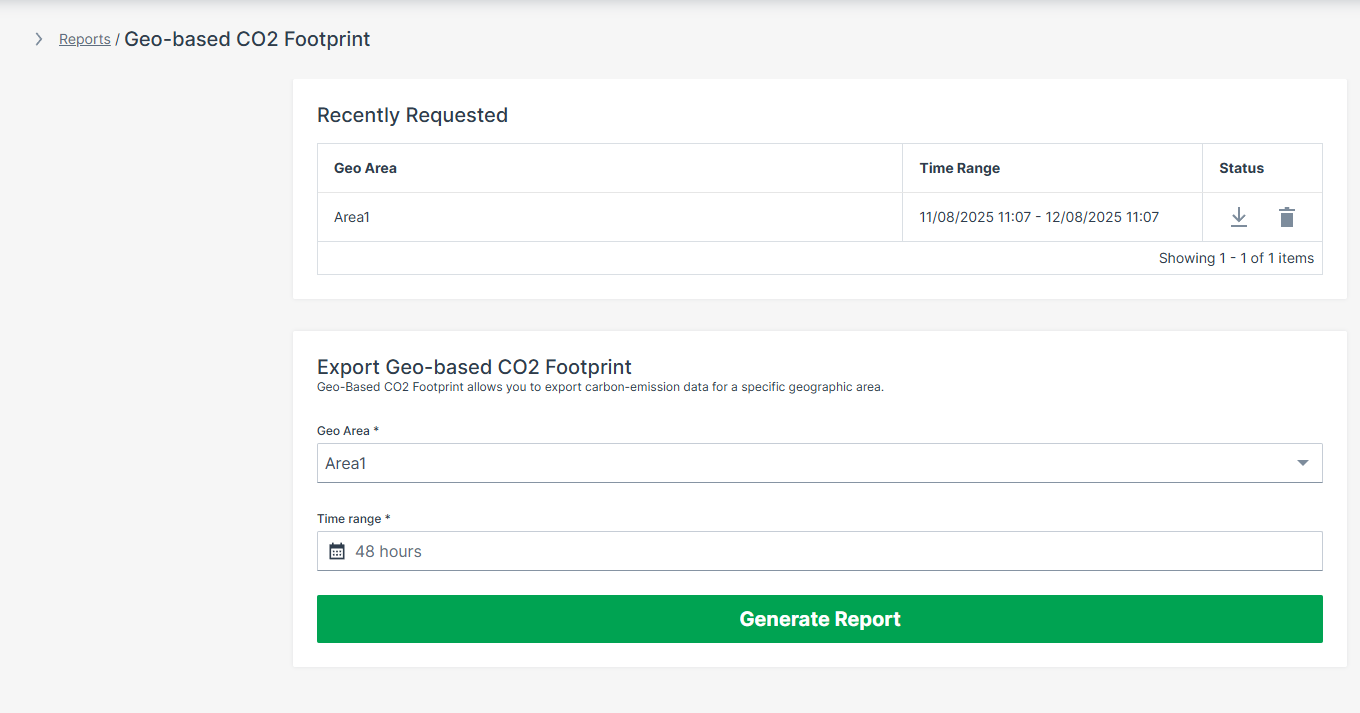
You will also receive an email notification at the address stored in your Personal User Settings, containing a link to download the .csv report file.
This link is valid for 7 days.
CSV File Contents
The exported .csv file contains a fixed set of columns in a predefined order:
- Machine Name – Name of the machine.
- Machine Serial – Unique serial number of the machine.
- Time in Area (hours) – Total time the machine was located within the selected Geo Area during the reporting period.
- Operating Hours – Total operating hours recorded for the machine within the selected time range.
- Fuel (Litres) – Total fuel consumption of the machine during the reporting period.
- Energy (kWh) – Calculated energy output based on fuel consumption.
- CO₂ (kg) – Calculated carbon dioxide emissions based on standardized conversion factors.
Measurement units are based on the unit system configured in the Personal User Settings within the DataPortal.
Users can choose between:
- Metric (SI) units (e.g. liters, kilometers, hours)
- Imperial units (e.g. gallons, miles, hours)
Data Sources and Calculation Basis
The CO₂ Report is derived from machine data transmitted via Proemion telematics. The following input parameters are used for the calculation:
- Operating hours: Total hours each machine was active on site.
- Fuel consumption: Recorded fuel used per machine.
- Energy output: Calculated or measured energy delivered by the equipment.
- Machine identifiers: Machine name and serial number.
- Time stamps: Start and end of operations for each period.
CO₂ Calculation Factors
The CO₂ Report uses fixed, hardcoded conversion factors based on a standardized diesel model:
-
Fuel to Energy:
38 MJ/L × 0.278 kWh/MJ × 35% efficiency = 3.6974 kWh/L -
Fuel to CO₂:
2.6817 kg CO₂ per liter of fuel
These factors are applied consistently across all reports.
Fuel Type Assumptions
The calculation does not differentiate between fuel or powertrain types.
All machines are evaluated using a standardized diesel assumption, regardless of whether they are diesel, HVO, electric, hybrid, or alternative-fuel machines.
Time Zone Handling
All timestamps in the report are processed and exported using the Personal User Settings within the DataPortal.
Settings
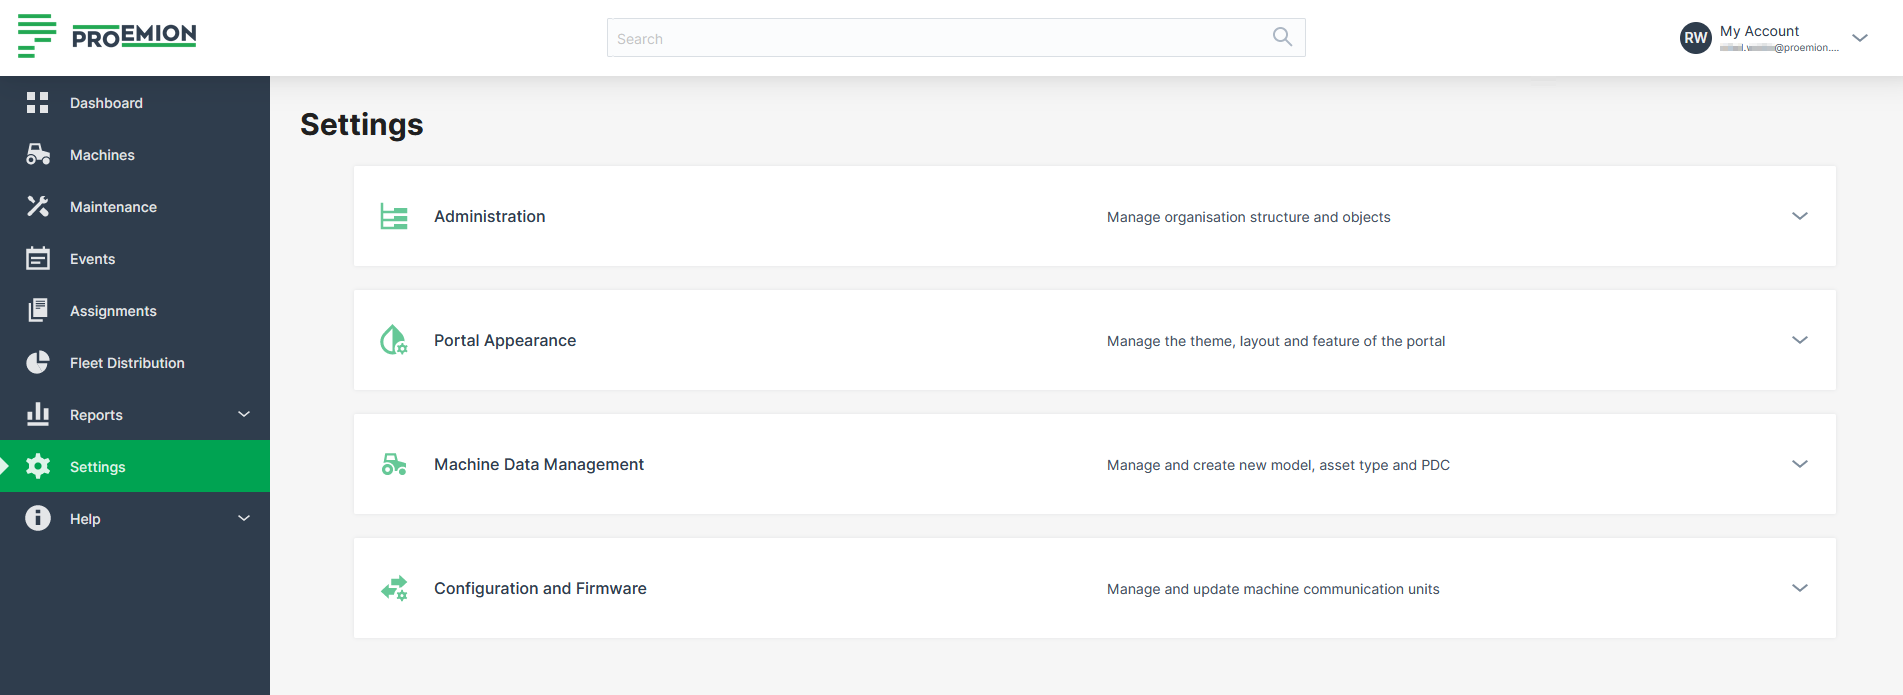
Administration
Organization Structure
Organization Structure Overview
An Organization Structure is represented in an organization tree and is based on the Business Units (BU) concept.
To open the Organization Structure page go to Settings > Administration > Organization Structure.
This page consists of:
- Organization tree on the left (selection drives the content)
- Top menu bar with different tabs (Machines, Models, Details, Users, etc.)
- Optional controls like Show all sub-organizations and Export
For creating, editing, removing, or moving organization units and for required Permission Sets, refer to Organization Unit Management.
Overview page elements
| UI element | Description |
|---|---|
| Organization tree | Hierarchical navigation (org tree). Selecting an organization updates all tabs. |
| Three-dots icon | Context actions for the selected org unit (create/edit/remove etc.). |
| COLLAPSE / SHOW ALL LEVELS button | Collapses or expands the tree. |
| Show all sub-organizations | Includes sub-org content in tables where supported. |
| Search | Search by IDs and entries (users, machines, OUs). See Search. |
| Export | Exports the current table (where available). See Export. |
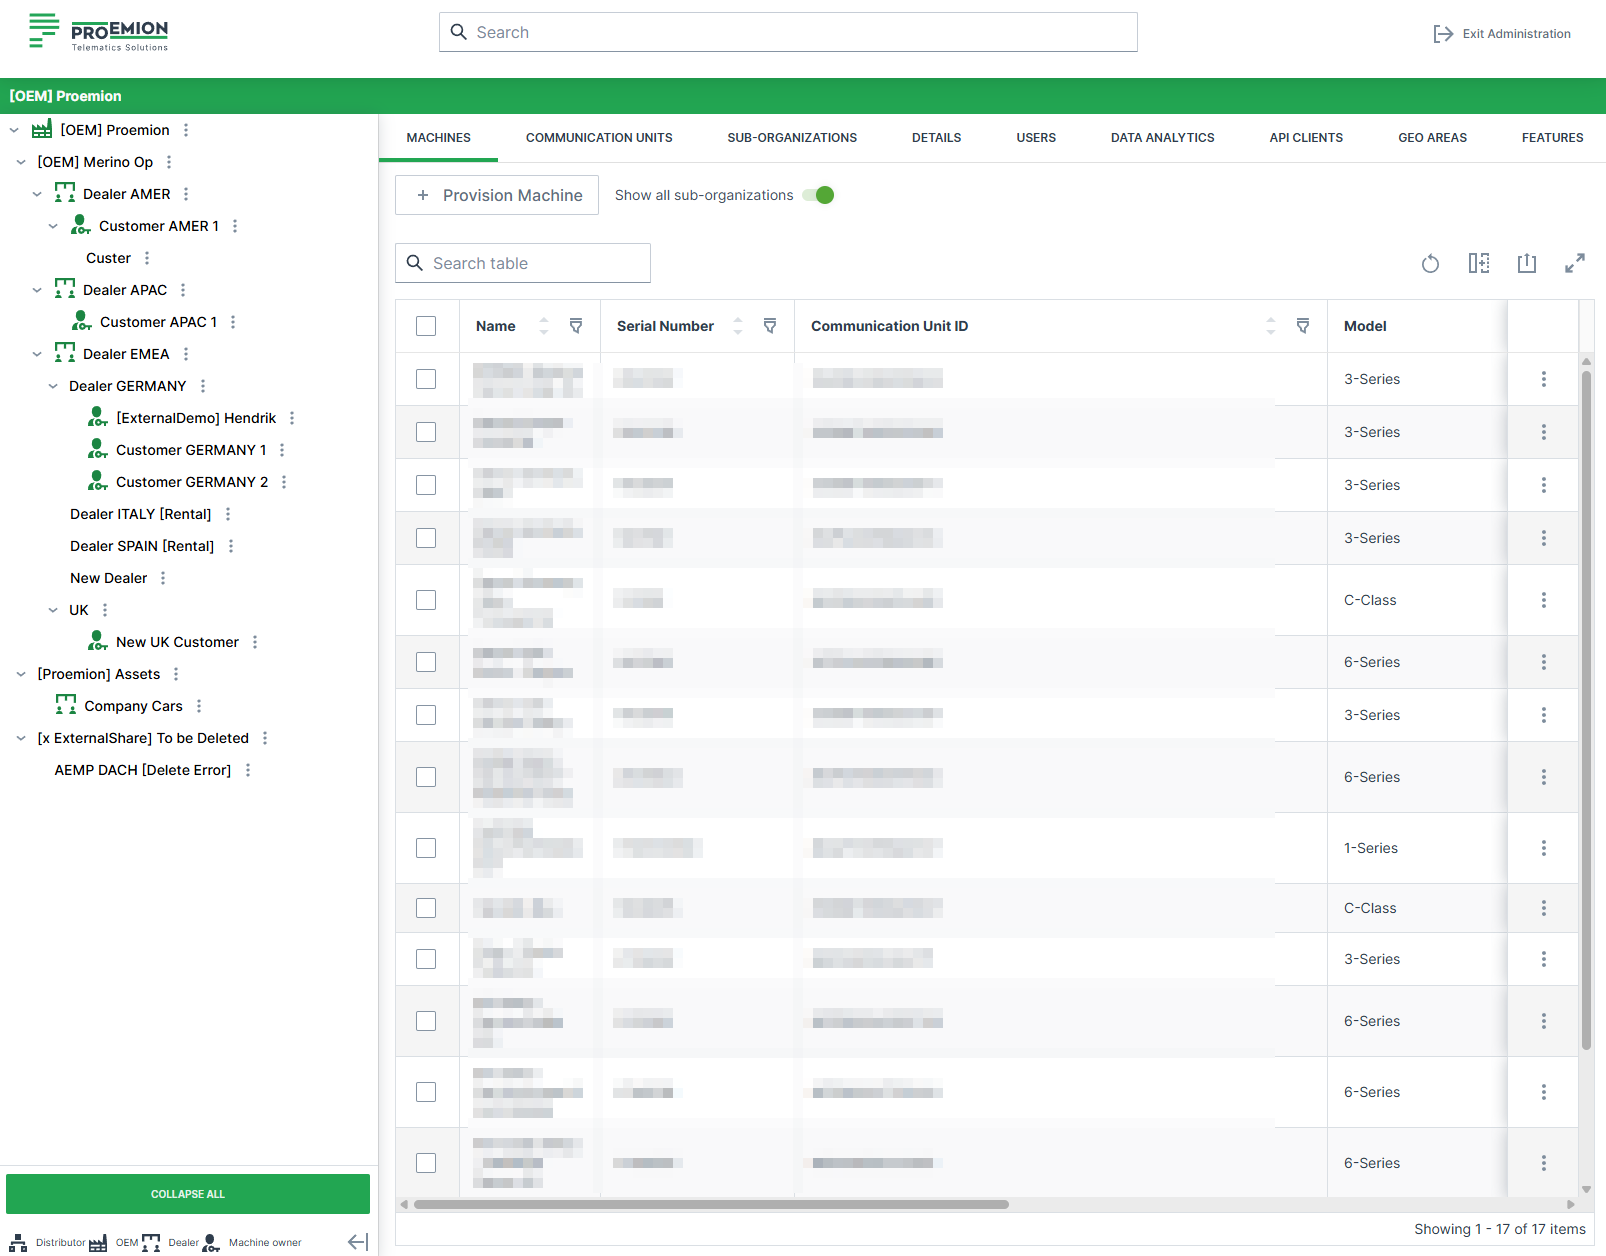
Top Menu Bar
The Top Menu Bar works in conjunction with the organization tree and updates its content based on the selected organization unit. The table below lists all available tabs. Each tab links to the documentation describing its purpose and functionality.
| Tab | What it shows |
|---|---|
| Machines | Machines in the selected org (ID, VIN, PIN, Serial, Model). |
| Models | Models available for the selected organization. |
| Users | Users assigned to the selected organization. |
| Sub-Organizations | Organization units controlled by the selected organization. |
| Details | Organization metadata, tenant and domain configuration, statistics, contacts. |
| Firmware | Firmware management and assignments. |
| MFA Configurations | MFA requirement overview (only if MFA is enabled for the org). |
| Data Analytics | Data analytics instances. |
| Features | Feature/language switch management (if implemented for the org). |
| API Clients | Create/manage API clients for REST API and AEMP API. |
| PDCs | PDC management. See PDC Management. |
| Communication Units | CU details and status. |
Details tab
The Details tab displays further information about the selected organization: organization and tenant metadata, domain configuration, statistics, and contact information.
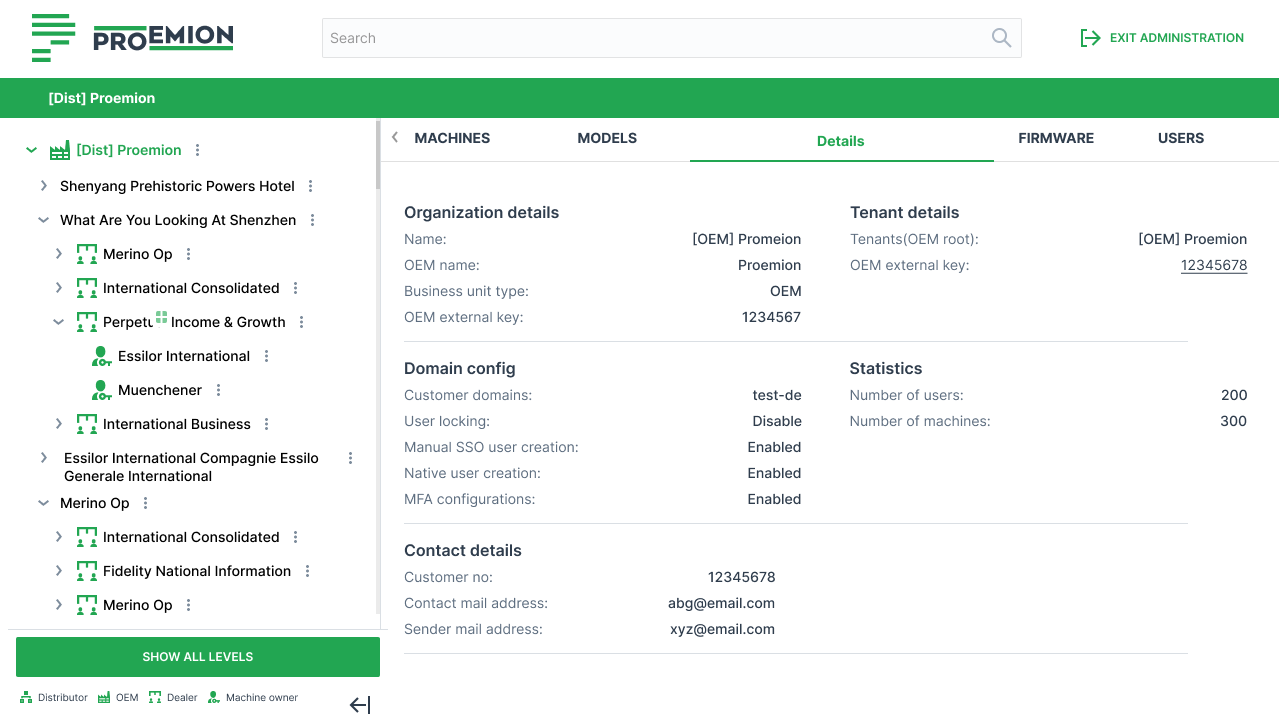
| Section | Field | Description |
|---|---|---|
| Organization details | Name | Display name of the organization |
| OEM name* | Associated OEM identifier | |
| Business unit type | Organization type (e.g. OEM) | |
| OEM external key | External system reference ID | |
| Tenant details | Tenants (OEM root) | Root tenant owning the organization |
| OEM external key | Tenant-specific external identifier | |
| Domain config | Customer domains | Allowed email domains for users |
| User locking | Enables or disables user lock enforcement | |
| Manual SSO user creation | Allows manual creation of SSO users | |
| Native user creation | Allows non-SSO (local) users | |
| MFA configurations | Multi-factor authentication status | |
| Statistics | Number of users | Total users assigned |
| Number of machines | Total machines assigned | |
| Contact details | Customer no | Internal or external customer reference |
| Contact mail address | Primary contact email | |
| Sender mail address | Email used for outgoing system notifications |
Note
* The OEM name is defined for tenant organizations and is used as the default name for machines when provisioning or activating machines, if no model-specific name is defined.
Requirements
- OEM name is supported only for tenant organizations, not for child organization units.
- Changes to the OEM name are performed via the REST API by Proemion.
- Users with Organization:Maintain Permission Set can view the OEM name.
Export CSV/XLSX
Administrators can export tables to .xlsx or .csv (export icon on the right side of the page).
Requirements
- Export icon is available on tables that support export.
- Export reflects:
- applied table filters
- Show all sub-organizations selection
- Required Permission Sets:
- Machines:Admin, Models:Admin and Organization:Admin
Export Tables
- Open Settings > Administration > Organization Structure
- Open the desired tab/table (e.g. Machines, Models, Users, Sub-Organizations, etc.)
- Click the export icon and select format
Supported exports (depending on configuration): - Machines - Models - Communication Units - Users - Sub-Organizations - PDCs - API Clients - Transfers - Machine Share Definitions
Business Units Concept
The Organization Structure is based on the Business Units (BU) concept.
Business Units group all organization units of the same type within the organization structure. The root is a special organization unit to identify the start of a BU, reflecting all the organization units that belong to it.
Each BU has one root organization and may include several sub-organizations. When creating a sub-organization, the organization type is automatically inherited from its parent. As a result, sub-organizations share the same type and belong to the same BU. A BU continues until another organization becomes a BU root.
The next root organization reflects a different BU with its own sub-organizations. A sketch of BU's can look as follows:
OEM 1 (BU root/tenant)           > Dealer A (BU root)
          |  |-> Dealer B (sub-org) > Machine Owner a (BU root)
          |  |-> Dealer C (sub-org) > Machine Owner b (BU root)
          |  |-> Dealer D (sub-org) > Machine Owner c (BU root)
          |  |        |-> Machine Owner d (sub-org)
          |  |        |-> Machine Owner e (sub-org)
          |  |-> Dealer E (sub-org) > Machine Owner f (BU root)
          |
          |-> OEM 2 (sub-org) > Dealer F (BU root)   > Machine Owner g (BU root)
          |
          |-> OEM 3 (sub-org)    > Machine Owner h (BU root)
                        |-> Machine Owner i (sub-org)
                        |-> Machine Owner j (sub-org)
BUs and Tenant
When a new OEM is created (e.g., by a Distributor) and this is the first OEM organization unit, it is automatically created as a tenant and becomes the BU root of a new BU.
Requirement: Ensure the first OEM organization is the first organization in the tree that is of type OEM.
Terminology
| Term | Definition |
|---|---|
| Business Unit (BU) | A collection of organization units of the same type within the organization structure. |
| BU Root | An organization that has no parent or whose parent has a different organization type. It defines the start of a BU. |
| BU Sub-Organization | An organization within the organization tree of a BU root that has the same type as the BU root. |
| Organization Type | The classification of an organization (e.g., OEM, Dealer, Machine Owner). |
Convert to <organization type> |
The action of changing an organization's type. This may change the BU assignment of the organization and its child organizations. |
Advantages
BU's give OEMs an overview of the Dealers and Machine Owners/machines belonging together.
This concept also enables users to view and maintain features only for their organization or below. It also enables sharing data with organizations belonging to the same Business Unit, but not outside the Business Unit, for example: dealership locations, assignments, geoareas, geofence alerts.
-
BU's allow OEMs to directly connect with Dealers or Machine Owners.
-
Dealers can only connect with Machine Owners.
-
All users are provided access of the organization assets depending on the organization root and its sub-organizations the users belong to within the Business Unit.
Requirements and Validation
The BU concept is active by default when creating a new account, e.g. when a Distributor creates an account for an OEM.
It requires an accurate grouping and nesting of organizations (even before and during the migration process):
-
Validate the children organizations of the same type.
-
Make sure that organizations which should not share resources are separated. Especially, take care of Dealers that are nested under other Dealers.
-
Review the users associated with each organization.
Organization Type Changes
You can change an organization's type within the DataPortal using the option Convert to <organization type>.
If a type change is not permitted by the system, the option will not be available.
To change the organization type, proceed as follows:
-
Navigate to Settings > Organization Structure
-
Search for the organization in the organization tree.
-
Open the organization menu via the three dots and select Convert to
<organization type>.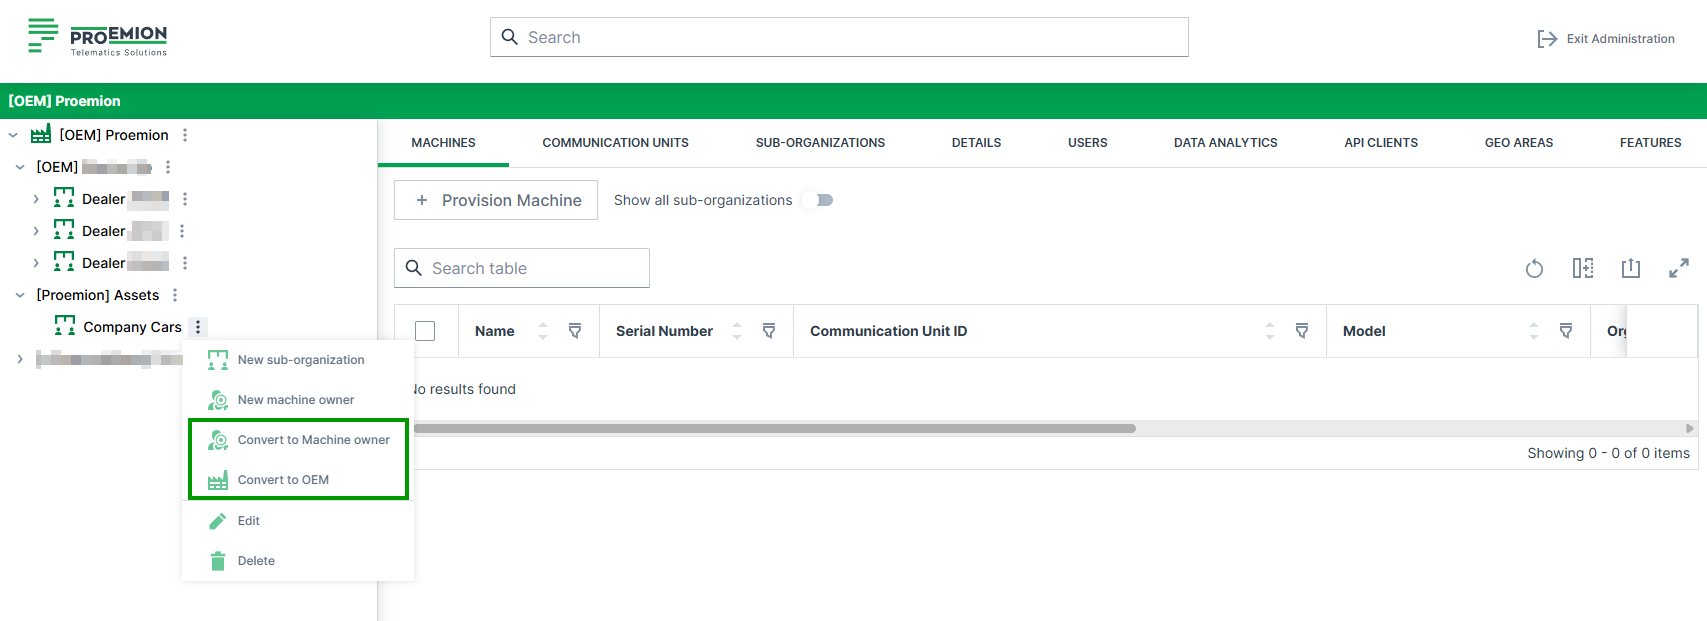
Figure 1: Change Organization Type -
Review the confirmation dialog carefully. Click Convert to confirm the organization type change.

Figure 2: Confirm Organization Type Change
How an organization change affects your organization
When you change an organization type, the system automatically recalculates the BU structure.
Although many structural constellations are possible, the type change results in one of the following structural effects, depending on the organization’s position in the structure:
The organization becomes a new BU root
If the new type differs from the parent's type:
- The organization leaves its current BU.
- It becomes a new BU root and forms its own BU.
- Its sub-organizations remain assigned to it.
The organization joins the parent's BU
If the new type matches the parent organization’s type:
- The organization joins the parent's BU.
- It is no longer a BU root.
- Depending on their type, its direct sub-organizations might become new BU roots.
The BU structure remains unchanged
If the organization is already a BU root and the organization change does not require it to join or leave a BU:
- The organization type is updated.
- The BU assignment remains the same.
- The overall hierarchy structure stays unchanged.
Note
Review the organization structure before making changes. Changing an organization type can affect data visibility and access to shared resources within the BU.
Organization Unit Management
Organization Units (OU/org units or sub-organization) are groups of users with a name and type (category) and are subordinate to the user's organization. Organization Units may have their own sub-organizations and users, and machines can be assigned to org units separately. Users can only see DataPortal objects in their own organization unit and the sub-organizations (subsidiaries).
Permissions
The DataPortal allows users with Organization:Maintain Permission Set to:
-
query or retrieve a list of organization units that share type with or are sub-organization units.
-
add organization units.
-
update organization units details.
-
assign or change the category.
-
move an organization unit.
-
view the OEM external key.
The DataPortal allows users with Organization:Admin Permission Set additionally to:
-
define and change the OEM external key.
-
search by organization type.
Management Permission by Organization Type
For a detailed overview of the user capabilities for creating Business Units/sub-organizations from each level, see section the table below.
| Organization Type | Permissions |
|---|---|
| OEMs | - Create new Dealer and Machine Owner Business Unit with each Dealer/Machine Owner root. |
| - Create, edit or delete all (sub-)organizations within the Business Units. | |
| Dealers | - Create new Machine Owner Business Unit with Machine Owner root. |
| - Create, edit or delete sub-organizations of organization type Dealer or Machine Owner within an existing Business Units. The Organization:Maintain permissions is needed. | |
| Machine Owners | - Create, edit or delete sub-organizations of organization type Machine Owner. |
Organization Type
Organization units are assigned to organization types based on the tasks performed. The organization types have the following hierarchical order:
-
Distributor
-
OEM (manufacturer)
-
Dealer
-
Machine Owner
-
None
With the Feature Switch "Machine Pages by Organization Type" it is mandatory to assign the organization type to all organization units. A warning will be displayed next to the organization when it has no organization type (None). You can then click the link Show all organizations with the type "None" that will expand the organization tree to the relevant organization units:

Note
If the parent organization unit has no organization type defined, only then "None" can be assigned; the warning will be displayed nevertheless. Otherwise, it is mandatory to select the organization type.
System Organizations
Proemion automatically creates special organizations for technical purposes based on shipment information. These organizations are system-managed and act as technical inboxes for shipped CUs before they are assigned to a machine and activated.
System-managed organizations are identified by the prefix [System] in the organization name.
They are required for correct shipment mapping and activation logic and are not intended to be deleted by users but can be renamed.
For further information refer to installed and pending CU's.
Create Business Units and Sub-Organizations
The creation of Business Units and sub-organizations is done in the menu Settings > Administration > Organization Structure. They can be created either directly in the Organization Tree, see Organization Structure Overview, or in the SUB-ORGANIZATIONs tab.
Proceed as follows to create a Business Unit (root) or sub-organization.
-
In the Organization Tree or in SUB-ORGANIZATIONS where the new Business Unit or sub-organization needs to be added, click the three-dots icon
. -
Select the New sub-organization or select New Dealer/New Machine Owner to create a new Business Units with the root organization.
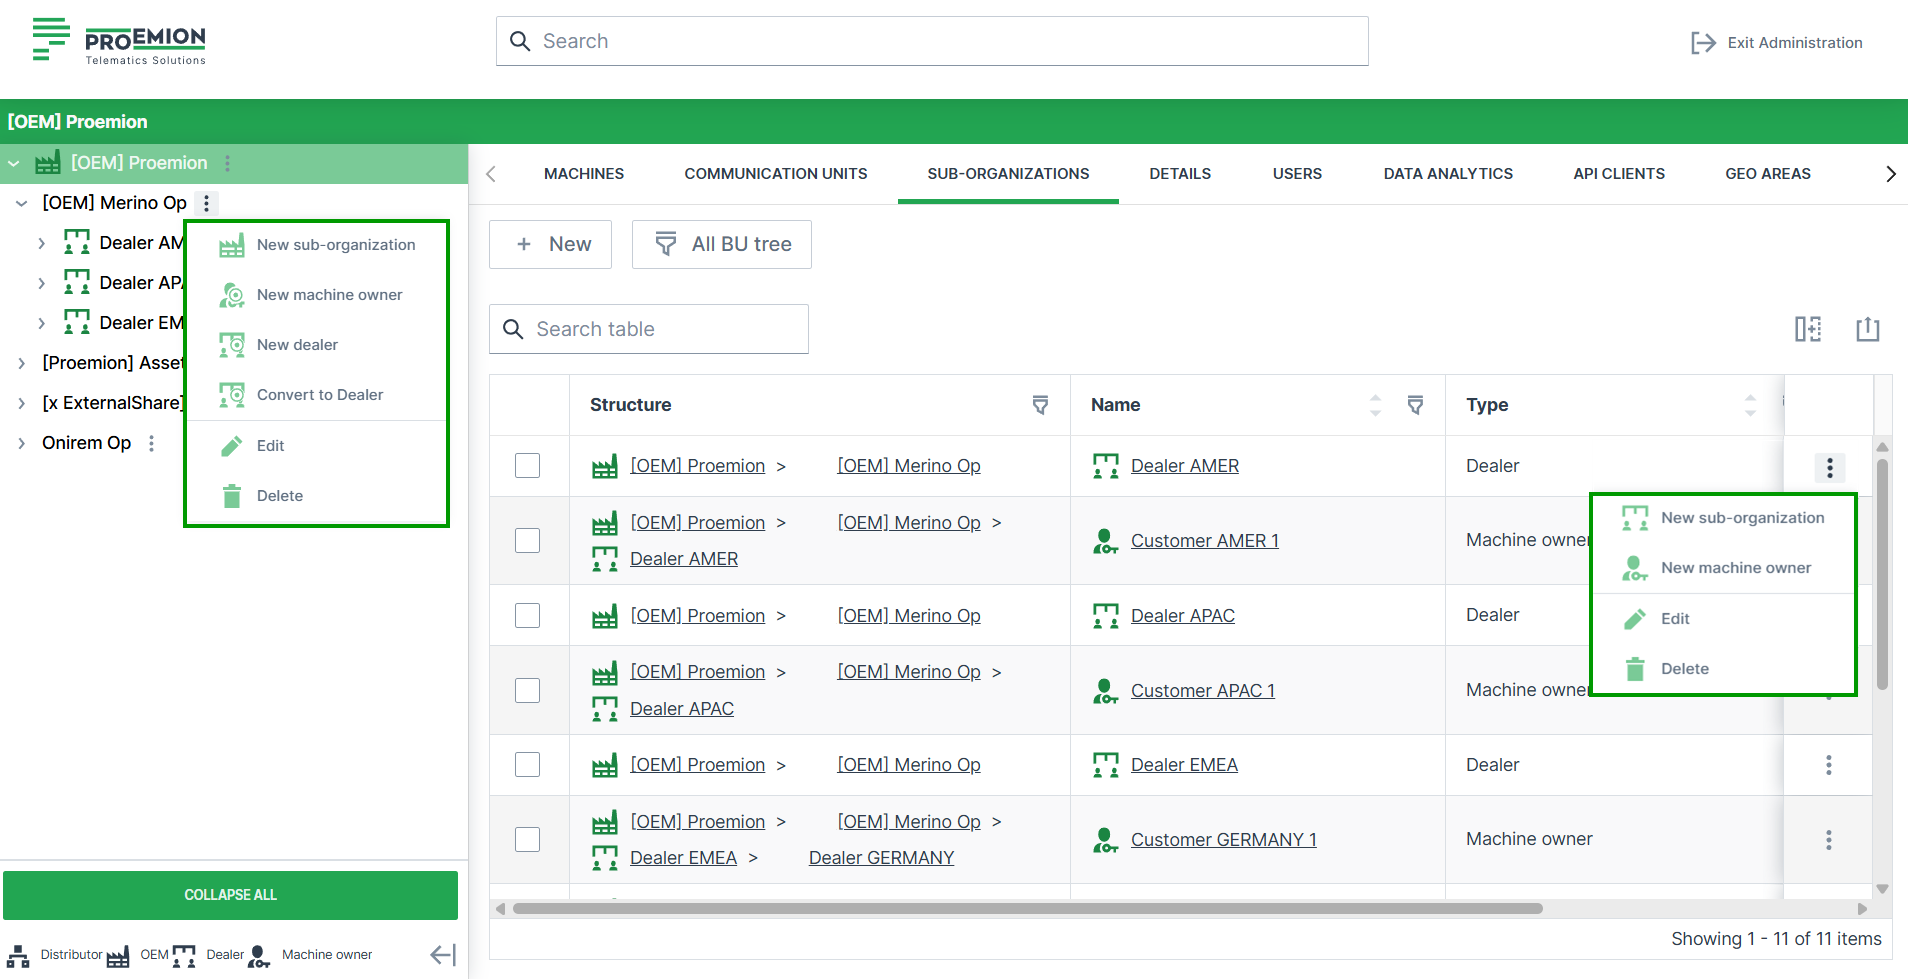
-
Add the name of the Business Unit root/sub-organization and optionally add an OEM external key.
-
Submit to save the changes.
Business Unit of type OEM can be created at the top of the Organization tree by the OEM. Below, an arbitrary number of Dealer- and Machine Owner Business Units as needed with each including one Business Unit root and an arbitrary number of sub-organizations for each Business Unit. Consider that the following relation is also possible: 1 OEM (root) > 1 Dealer (root) > 1 Machine Owner (root).
Sub-organizations are created related to their parent organization, i.e. are of the same type as their parent organization.
Note
Selecting an organization in the Organization Tree changes the structure under SUB-ORGANIZATION!
Edit Organization Unit
To change the details for an organization unit:
-
Open Settings > Administration > Organization Structure.
-
Select the (sub-)organization unit that you want to change.
-
Click on the 3-dots icon
. -
Click on Edit to edit the properties of this organization.
-
Optionally change the Name for the sub-organization.
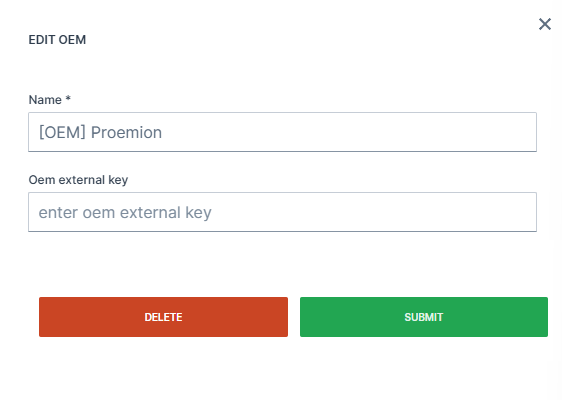
Figure 2: Edit Sub-Organization Details -
Click the SUBMIT button to save your changes.
Remove Organization Unit
Note
DELETE (Remove) only works when there are no entities assigned to this organization anymore. Otherwise, this message will appear: The organization is still in use by having PDCs, users, devices, machines, models, assignments or sub-organizations associated with it.
To remove an organization unit:
-
Open Settings > Administration > Organization Structure.
-
Select the organization unit that you want to remove.
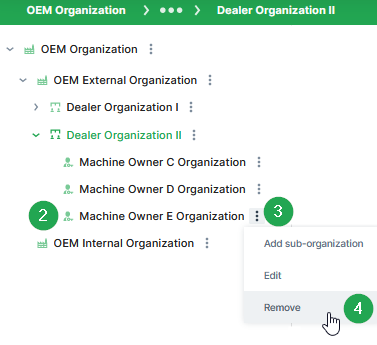
-
Click on the three-dots icon
. -
Click on Remove to remove this organization. ✓ The Delete organization dialog opens.
-
Read the summary. For example: Are you sure you want to delete the organization "Machine Owner E Organization"?
-
Click on Delete to remove the organization.
✓ The success message Organization deleted successfully appears in the upper right corner.
OEM external key
The external key can be used to assign machines or users to the organization based on it.
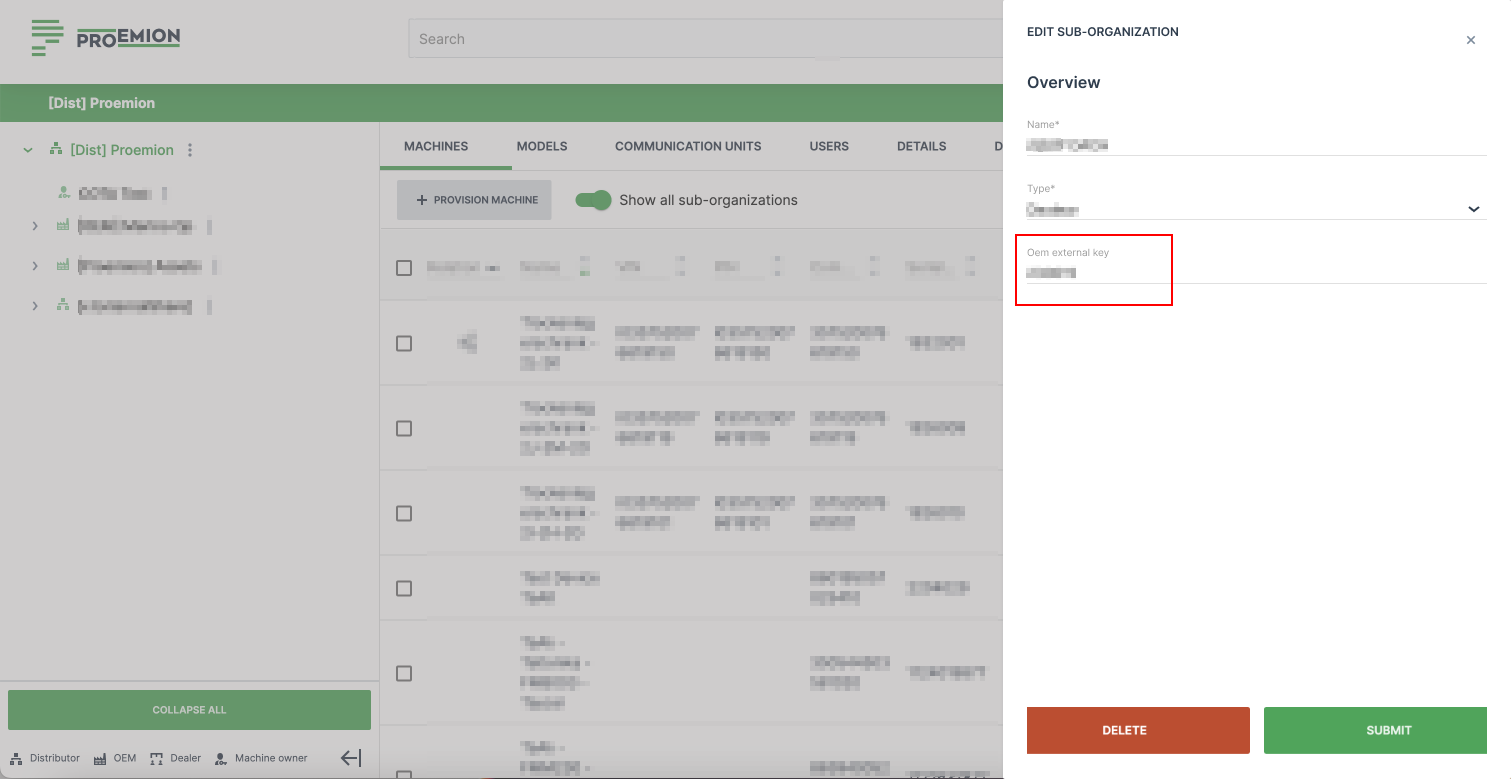
The OEM external key can be added and edited to new and existing (sub-)organizations by the admin of the parent organization. The parent organization must be of type "OEM".
Feature Switch
You can enable (or activate) configured features and languages for your organization from the DataPortal Administration menu.
Note
The Feature Switches functionality (including the configured features) is not available out-of-the-box and must be implemented for each organization specifically.
Feature Management
To open the Features management panel for an organization:
-
Select Settings > Administration > Organization Structure from the expansion menu to open the Admin page.
-
Select the organization where you want to set feature access for.
-
Select Features from the Administration Menu from the Top Menu Bar.
-
After configuring the features, click Apply.
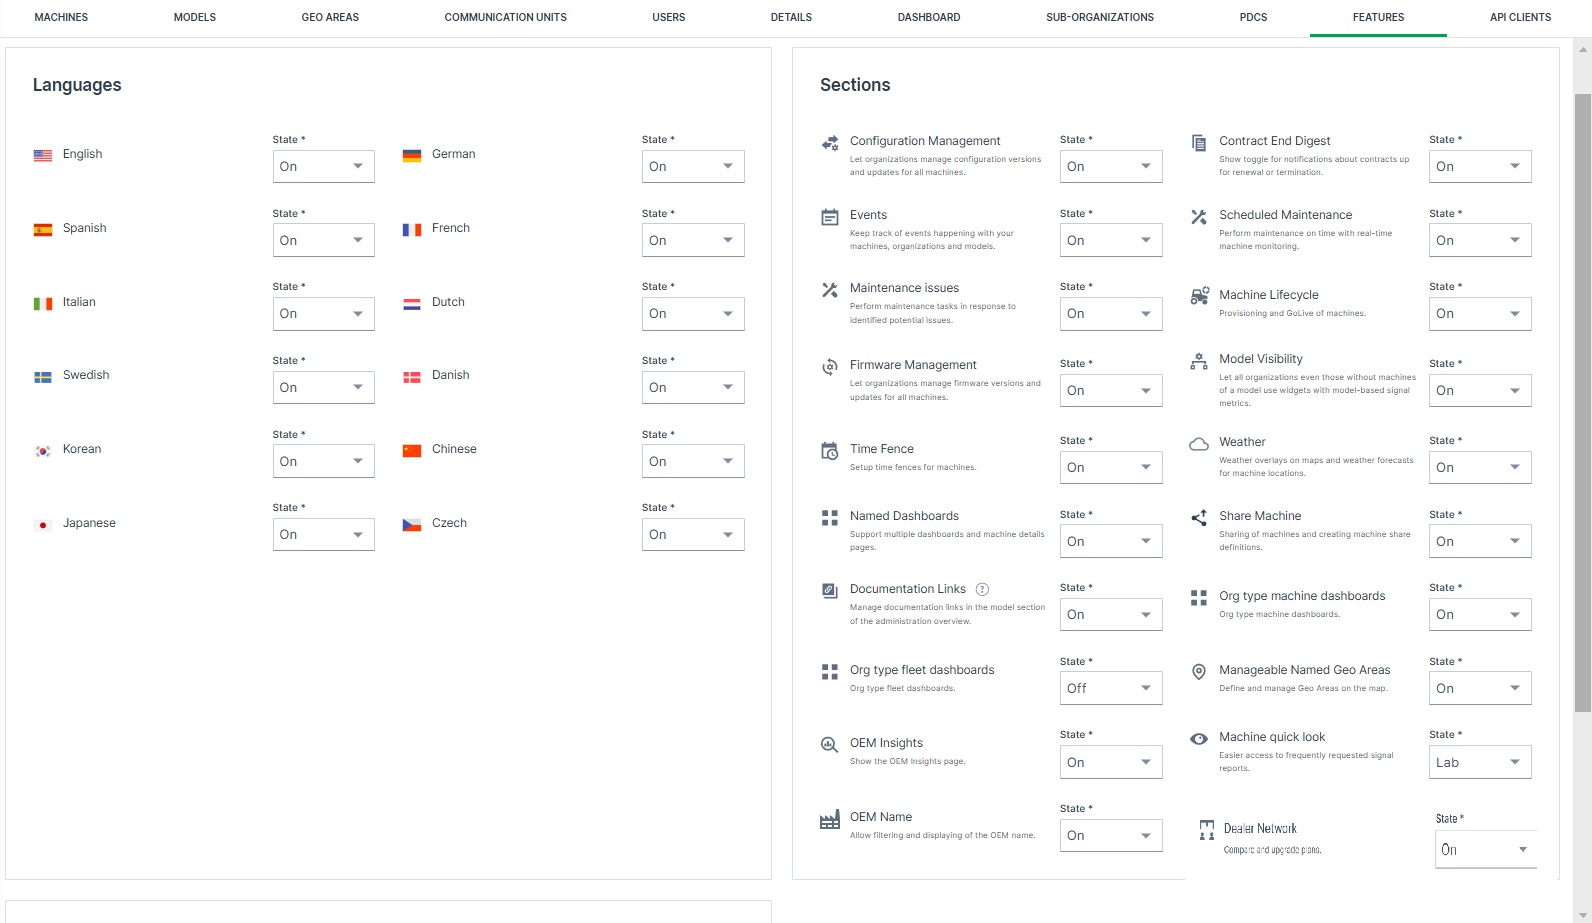
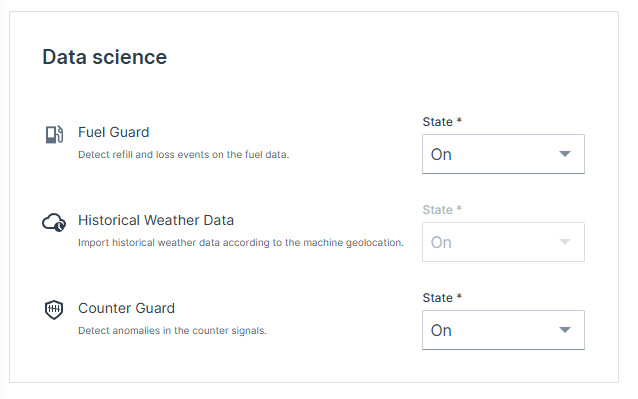
| Item | Description |
|---|---|
| Languages* | Lists the languages available to your organizations in the DataPortal, see Available Languages. |
| Sections | Displays the features available to your organization, see Available Features. |
| Data Science | Data operations features that analyze a condition (e.g. counter units, fuel level) and trigger events based on data operations, see Available Features. |
| For each language or feature, you can configure the State: | |
| State | On: All users in the organization and sub-organizations have access to the feature. Lab Mode: Only users with Lab Mode enabled from user preferences can access the feature/language. Off: Access to these features is disabled and the page/language option does not appear in the DataPortal. |
Note
* Enabling a language requires that the translations are available in the PDC and DataPortal.
Available Languages
Enable or disable configured languages for the DataPortal (English cannot be disabled)
The users can then change the language on the Login Page or Personal User Settings.
You can choose from the following languages:
-
English
-
German
-
Chinese*
-
Czech*
-
Danish*
-
Dutch*
-
French
-
Italian
-
Japanese*
-
Korean*
-
Spanish
-
Swedish*
Note
*Those languages cannot be added by default, but must be requested first to be enabled by Proemion.
It should be noted that implementing those and other new languages requires additional Proemion resources including project setup, manual configuration, recurring services which may result in additional costs.
Contact your Sales representative at Proemion.
Available Features
The table below provides a link and description to the documentation of features that are available via the Feature Switch functionality.
Enable or disable the configured features for the DataPortal.
Note
If you want to make use of a feature that is listed here but not in the feature switch section of your account, Proemion may need to activate it first for your organization
Create a ticket at the Service and Support or contact your Proemion representative.
| Feature | Description |
|---|---|
| Events | Visualizes events details (such as timestamp, machine, etc.) captured by the data platform. |
| Maintenance Issues | For maintaining machine service tasks based on unscheduled maintenance issues inbetween service cycles. |
| Scheduled Maintenances | For maintaining machine service tasks based on service cycles. |
| Machine Lifecycle | Allows you to provision and activate the machine. |
| Time Fence/Timetable | Allows you to define a schedule for when a machine is permitted to be in use. |
| Firmware Management | Enables monitoring and updating of the installed firmware versions on the available communication units. |
| Configuration Management | Enables monitoring and updating of the installed configuration versions on the available communication units. |
| Weather | Visualizes the weather forecast details as a map overlay or in tabular format for the current location of a machine. |
| Named Dashboards | Create multiple dashboards for different user groups or different time periods (e.g. last 7 days or last 30 days). |
| Share Machine | Allows you to open access to your machines to DataPortal users outside your organization. |
| Model-Based Signals Visibility | Enable Model-Based Signals visibility in the DataPortal and as a base for the DataScience feature. See DataScience Manual → "Model-Based Signals". |
| Contract End Digest | Display the toggle in the Notifications menu for enabling contract end notifications. |
| OEM Name | Allows you to enable OEM name (display machine data, machines filter) globally for machines in your fleet. |
| Documentation Links | Allows to configure links to external documents and resources for each model. The defined links are shown on the Machine Master Data widget on the machine detail page. Please be aware that existing links at the Machine Master Data will be overwritten by model based document links. |
| Org type machine dashboards | Configure layouts for dashboard and specify their visibility according to the organization type. |
| Manageable Named Geo Areas | Create geo areas for custom DataPortal features. |
| OEM Insights | Analyze aggregated data of your users and machines in different charts. |
| Data Analytics Instances | Get insights on the data collected from the machines. See DataScience Manual → "Data Analytics". |
| Fuel Guard | Detect refill and loss events for fuel signal data. See DataScience Manual → "Fuel Guard". |
| Counter Guard | Detect inconsistencies (as events) in counter signal data. Relevant for the features listed in DataScience Manual → "Counter Guard". |
| Historical Weather Data | Import historical weather data according to the machine geolocation. See DataScience Manual → "Historical weather data". |
Warning
As of June 1st, 2025, the Historical Weather Data feature has been temporarily deprecated. If you're interested in accessing this feature, please contact our Sales Team to explore options.
Lab Mode Activation
Beta (or trial) access to new DataPortal features for users in an organization is activated via Lab Mode. However, users must separately enable the lab mode in their personal settings to use the activated feature/language, see Lab Mode.
To enable a feature for the organization, toggle the status for a feature to Lab as shown:
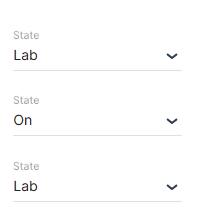
OEM Name Feature
When the OEM Name feature is enabled, machines can be filtered by OEM name in supported features and widgets.
Enabling this feature allows filtering machines by OEM name in the following areas:
| Feature/Menu Item | Module/ Column | Filter? Y/N | Navigation |
|---|---|---|---|
| Machines Management | Y | Settings > Administration > Organization Structure > Machines tab | |
| Models Management | N | Settings > Administration > Organization Structure > Models tab > New machine model dialog > Machines > Select machine | |
| Machine List | - | Y | Machines > Machine list widget |
| Maintenance | - | Y | Maintenance > Filter > Machine |
| Events | - | Y | Events > Filter > Machine |
| Assignments | - | Y | Assignments > Filter > Machine |
| - | Y | Assignments > Create new assignment > Machines | |
| Reports | Maps | Y | Reports > Maps > Configure maps > Select machine |
| Plots | Y | Reports > Plots > Configure plots > Select machine | |
| Scatter Plots | Y | Reports > Scatter Plot > Configure scatter plot > Select machine | |
| Tables | Y | Reports > Table > Configure tables > Select machine | |
| GeoLeash | N | Reports > Filter GeoLeash Events > Select machine | |
| Machine Efficiency | N | Reports > Efficiency Snapshot > Select machines | |
| N | Reports > Efficiency History > Select machines | ||
| Assignments | N | Reports > Assignments > Assignment Report > Configure report |
Model-Based Signals
Model-Based Signals comprise a fixed catalog of signals that require no configuration and enable comparison operations via widgets and reports.
Standard operations based on a model are described in Models Management.
You can also edit models' visibility for users in different organization.
Model-Based Signals are also used for the DataScience feature
Read about the feature and its use case in DataScience Manual → "Model-Based Signals".
Model-Based Signals Catalog
The signals defined by the OEM for a model are managed via the PDC Manual the same as machine signals.
Contact your Proemion representative for more information.
Model-Based Signals Visibility
Model-Based Signals Visibility allows you to mark a model to be visible for users in the DataPortal whether they are in the organization that owns or can view the model by default (e.g. org units that have a machine of this model).
Administrators can perform the following functions to Configure Model-Based Signals for a model for users in different organization.:
-
Configure models visibility
Standard operations based on a model are described in . -
Configure visibility for sub-organizations for users who do not have access to a machine of a particular model.
-
Set the model management (create, modify and admin overview) flag for visibility.
Enable Model-Based Signals
To enable visibility for MBS independent of a machine, proceed as follows:
-
Open Settings > Administration > Organization Structure.
-
Select Features (switch) from the Top Menu Bar.
-
Under Sections, toggle the state of Model Visibility to On.
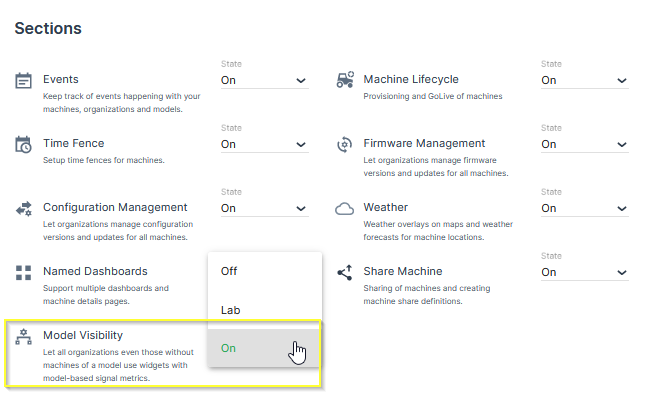
Configure Model-Based Signals for a model
To edit the visibility of Model-Based Signals, proceed as follows:
-
Open Settings > Administration > Organization Structure.
-
Select Models from the Top Menu Bar.
-
Select the Edit link to the right of a model that you want to edit.
-
This opens the Edit Models dialog. Here you can select from 2 visibility options:
-
Regular: All organizations with machines of this model can use it across widgets and reports.
-
Distributed: Organizations that do not have machines of this model can use widgets with Model-Based Signals metrics of this model.
-
You can filter visibility for Model-Based Signals by selecting the Visibility from the Models tab in Administration as shown.
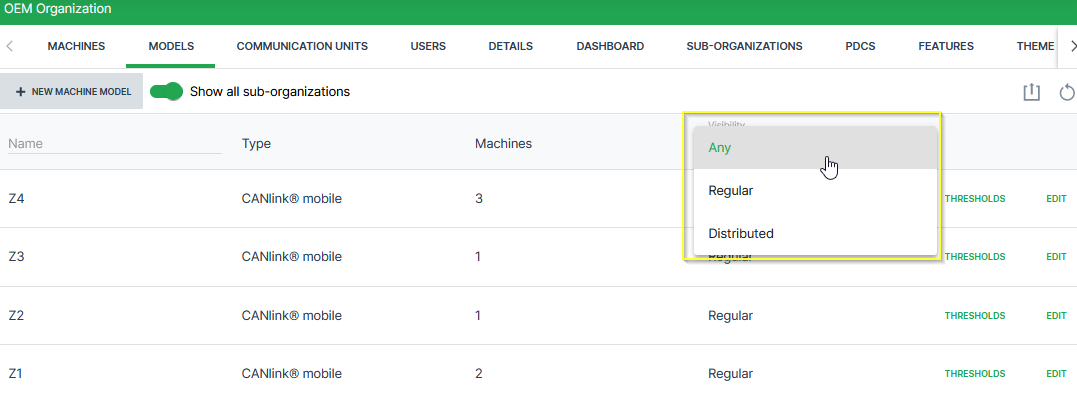
Communication Units
The Communication Unit (CU) is the telematics device installed on a machine.
Note
A CU cannot connect to the DataPlatform if it is not assigned to a machine.
Communication Unit Details
To open the Communication Units tab, go to Settings > Administration > Organization and select Communication Units from the Top Menu Bar.

Alternatively, open the Communication Units page via the  icon on the Machine Page.
On the Communication Units page, users can find detailed information about all CUs assigned to their organization and manage them. For example, users can:
- See an overview of all devices including basic information such as device name, serial number, last login and logout on the physical device etc.
- Access detailed information for each CU via the Details option, see table below.
To view detailed information of a CU, open the three dots menu at the end of the row and choose Details.
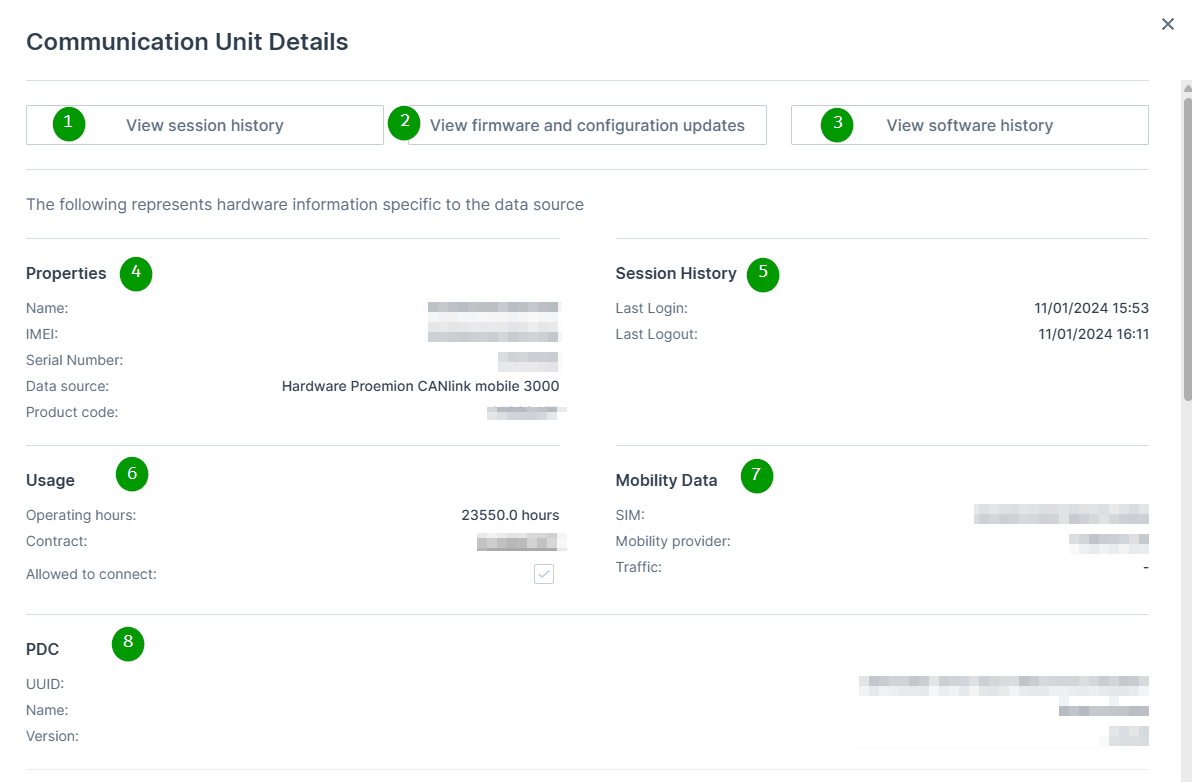
| # | Item | Description |
|---|---|---|
| 1 | View session history | Button to open detailed session information. See Session History. |
| 2 | View firmware and configuration updates | Button linking to Firmware and Configuration Updates. |
| 3 | View software history | Button linking to Software Version History. |
| 4 | Properties | Display of CU master data: Name, IMEI, Serial Number, Hardware / Data Source, Product Code. |
| 5 | Session History (Summary) | Display of last Login and last Logout timestamps. |
| 6 | Usage | CU operating hours, contract information, and connection permission status. |
| 7 | Mobility Data | Information about the eSIM (ICCID), mobile network provider, and traffic. |
| 8 | PDC | Information about the assigned PDC file (UUID, Name, Version). |
Installed and Pending Communication Units
The Communication Units tab contains the following two sub-tabs, to clearly separate active devices from devices that still require activation:
-
Installed: Displays all Communication Units that have already been activated and are live. These CUs are fully provisioned, assigned to a machine, and actively transmitting data. This tab is selected by default.
-
Pending Installation: Displays Communication Units that have already been shipped to the customer but are not yet activated. These devices are visible to support a transparent activation process and are ordered by shipment date (oldest first) to help users prioritize the activation of older devices.
For Communication Units listed under Pending Installation, an Install button is available once at the top of the table and at the end of the row of a machine to start the activation process. When selected, the Install dialog with the activation workflow opens with the CU pre-selected and key device information such as the serial number and IMEI number automatically filled in.
This allows users to quickly assign the device to a machine and complete the activation with minimal manual input. Once a Communication Unit has been assigned to a machine and successfully activated, it automatically moves from the Pending Installation sub-tab to the Installed sub-tab.
Communication Units listed under Pending Installation may belong to organizations that were automatically created by Proemion based on shipment information.
For further information refer to system organizations.
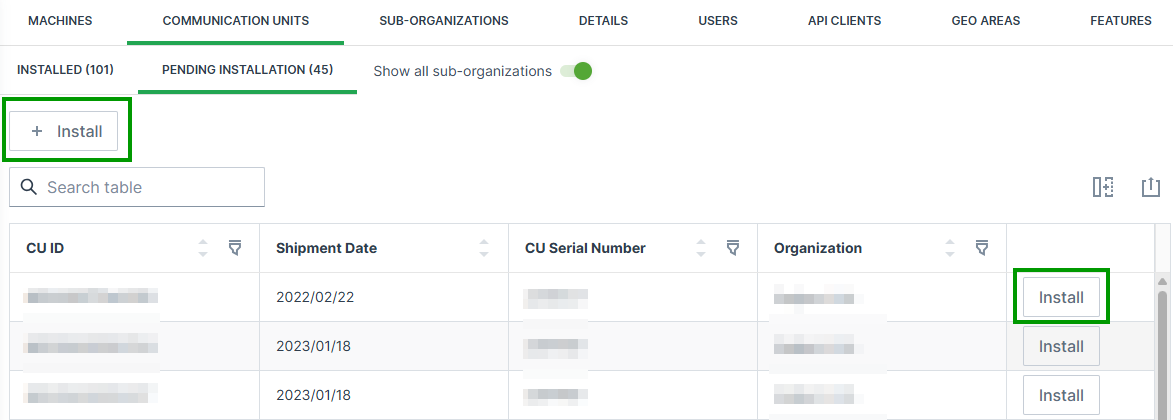
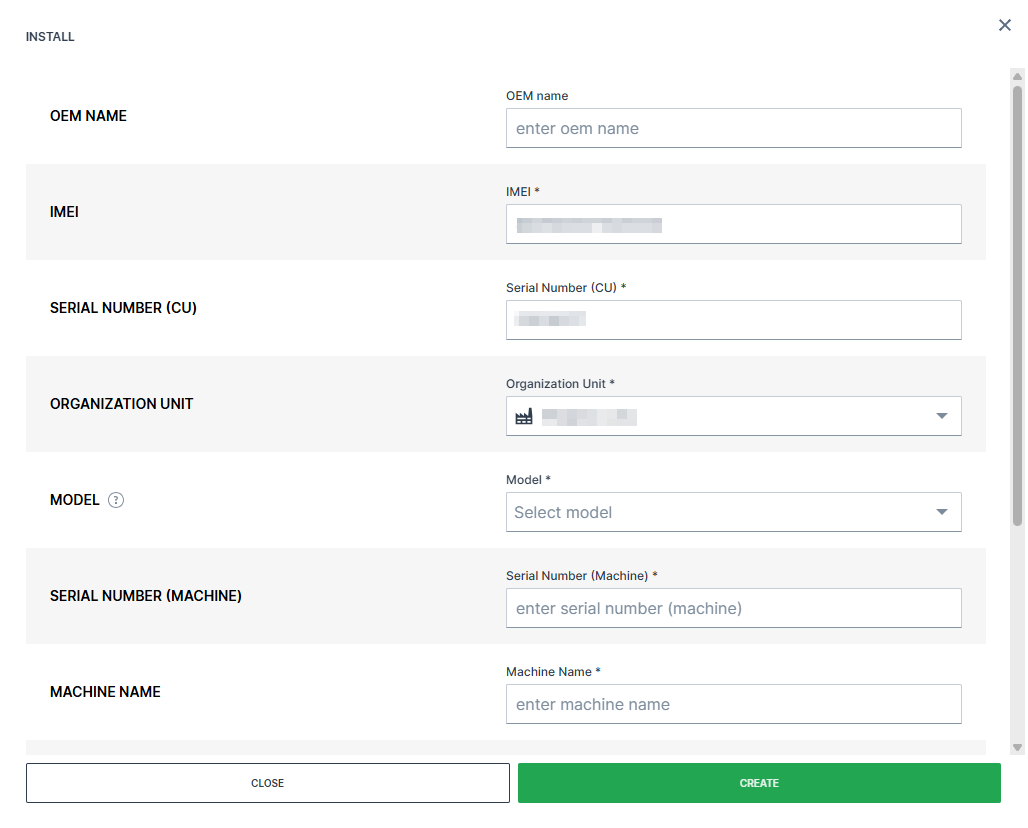
Session History
The Session History allows to gain additional information about the operating mode, wakeup reason, duration and signal strength of each session within a given time range.
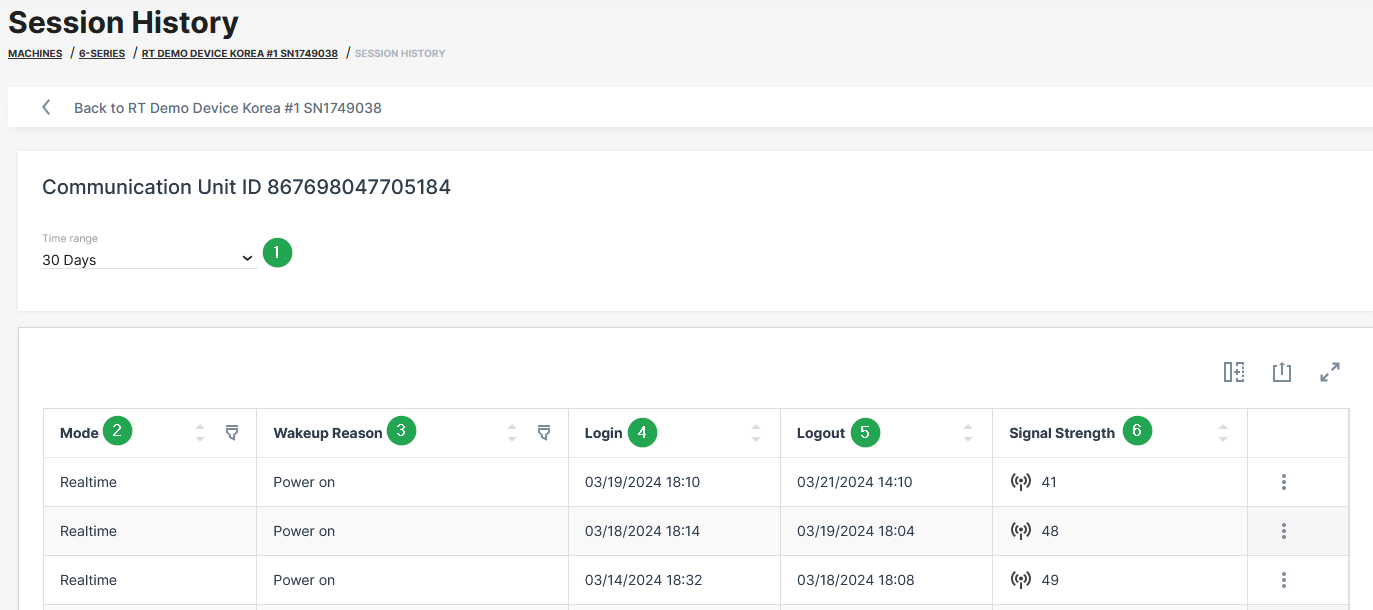
| # | Item | Description |
|---|---|---|
| 1 | Time range | Drop down menu to define the time range for the session history |
| 2 | Mode | Display of the operating mode (Online, Logging, Realtime or Unknown). "Online" is available for the CANlink® mobile 3600 and {{ wl_product_name_clm1000 }} devices. For more information, read CANlink mobile 3600 Online feature. |
| 3 | Wake-up reason | Details about the wake-up reason of the device for example due to ignition, power on, CAN activity, real-time clock–based wake-ups (interval or alarm) and accelerometer events. Not all wake-up reasons are applicable to all device types. |
| 4 | Login | Date and time of session start. |
| 5 | Logout | Date and time of session stop. |
| 6 | Signal strength | Mobile network signal quality at session start. Values are shown in decibel unit ( dB). For more information, see Signal Strength. |
| 7 | Export | Table Options. |
Signal Strength
For an evaluation of the mobile signal quality, the values need to be converted to RSSI values with the formula:
RSSI = 2*x - 113 dBm (Formula for CANlink mobile 3600)
where x is the value from the CANlink mobile (Index 0x5251 Sub 0x00 in the CANlink mobile 36xx).
The following table shows the mapping of RSSI to db:
Note
31 in all cases means "maximum". The smaller the dBM the better the signal strength is.
| dB | RSSI (RSSI = 2*x - 113 dBm) |
|---|---|
| 0 | -113dBm or less |
| 1 | -111dBm |
| 2...30 | -109dBm... -53dBm |
| 31 | -51dBm or greater |
| 99 | Not known or not detectable |
| 100 | -116dBm or less |
| 101 | -115dBm |
| 102...190 | -114dBm...-26dBm |
| 191 | -25dBm or greater |
| 199 | Not known or not detectable |
| 100~199 | Extended to be used in TD-SCDMA indicating received signal code power (RSCP) |
The next table describes the meaning of the signal values (source of the table: RSSI Teltonika)
Note
The RSSI on its own is useful when comparing different antennas on your device, or for example to check whether directional antennas have a good orientation. But there might be a strong signal but with a lot of (other) traffic that will lead to poor reception. Thereby, it needs to be considered that there is no linear mapping like "RSSI value > x = good reception". But the following table gives a good indication.
| RSSI | Signal strength | Description |
|---|---|---|
| > -65 dBm | Excellent | Strong signal with maximum data speeds |
| -65 dBm to -75 dBm | Good | Strong signal with good data speeds |
| -75 dBm to -85 dBm | Fair | Fair but useful, fast and reliable data speeds may be attained, but marginal data with drop-outs is possible |
| -85 dBm to -95 dBm | Poor | Performance will drop drastically |
| < = -95 dBm | No signal | Disconnection |
API Client Management
API Clients can be used for connecting DataPlatform to other systems or 3rd parties via REST API and AEMP API.
Info
API Clients are intended for machine-to-machine integrations without an individual end user, such as scripts or ERP integrations. If you need to give your own application user-level access on behalf of a signed-in DataPortal user, read DataPlatform as Identity Provider instead.
Organization Admins with Organization:Admin Permission Set can create and delete clients while users with Organization:Maintain Permission Set can view client information (i.e. URL and available Permission Sets).
In the DataPortal navigate to Administration > Organization Structure and open the API Clients tab.
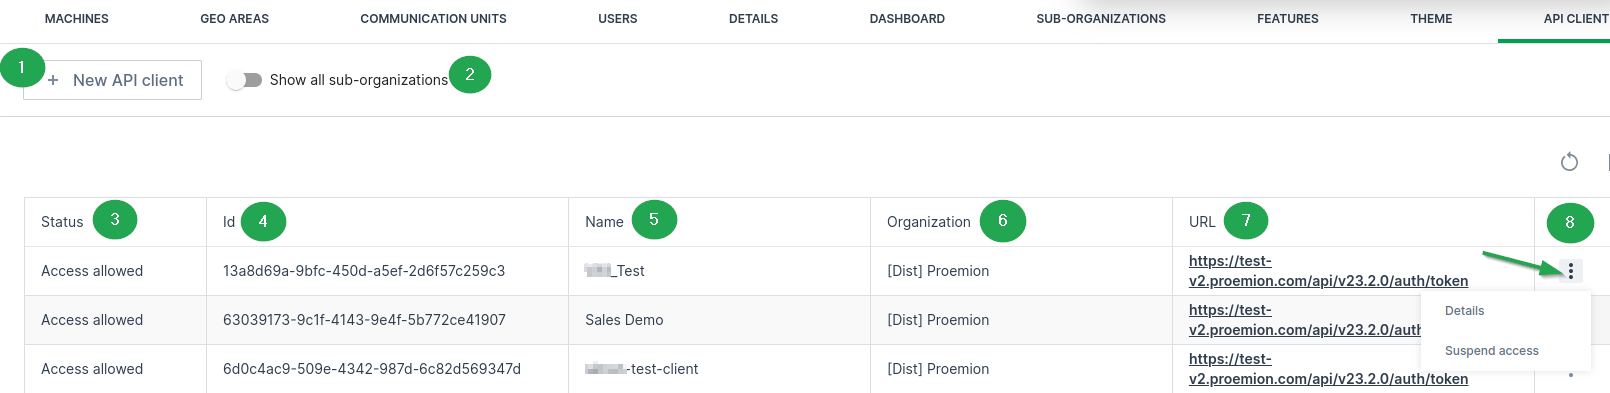
| # | Item | Description |
|---|---|---|
| 1 | New API Client | Open the create new client dialog. |
| 2 | Show All sub-organizations | Show or hide Clients for the sub-organizations. |
| 3 | Status | Shows the access status of the API Client. |
| 4 | ID | Automatically generated client ID. |
| 5 | Name | Name provided by the client admin. |
| 6 | Organization | The DataPortal organization the client can access. |
| 7 | URL | URL of the client. |
| 8 | Details | View or edit client details. Configure the access, see Ban API Clients. |
To view information about an existing client select Details to the right of an item in the list. Here you can also edit the permission set.
Note
Users with the Organization:Maintain Permission Set cannot edit clients.
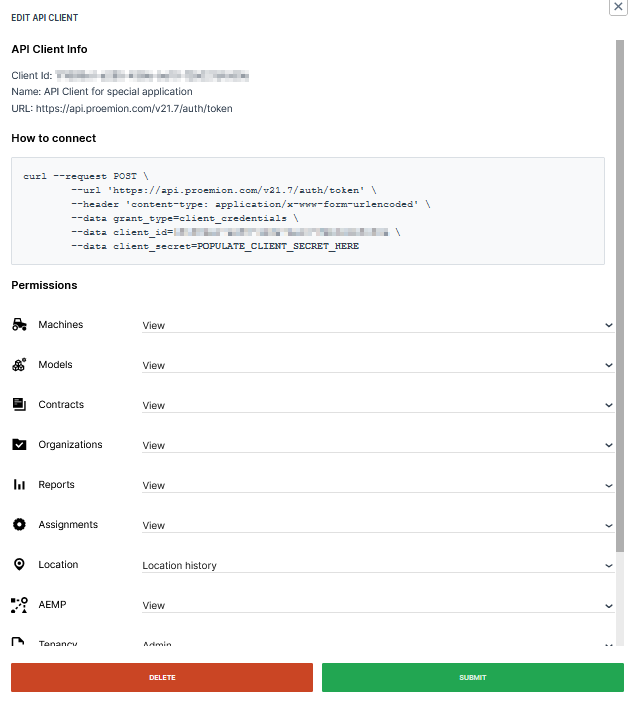
Managing API Clients
This section covers how to create a new API Client and suspend or restore its access.
Create a New Client
To create a new API client:
-
Select Settings > Administration > Organization Structure from the left-hand menu to open the Administration Dashboard.
-
Select the organization unit from the org tree on the right side where you want to create a new API client.
-
Select the API Clients tab.
- Optionally toggle the Show all sub-organizations to display all API clients.
-
Select the New API Client button
 .
. -
In the panel that opens enter a name and select the permissions for the client.

Figure 3: New Client Configuration -
Select Submit to view and Copy the Client Secret Now.
Danger
Store your client secret in a safe location.
-
Confirm the creation of the new API Client.
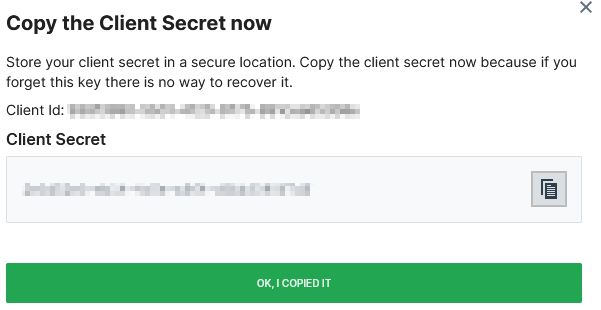
The new API client is now visible in the list of clients for this organization.
Ban API Clients
You may ban API Clients in order to disable them to obtain an authentication token or request other endpoints with previously obtained (not yet expired) token.
To ban API Clients, i.e. suspend the access, the Organization:Admin Permission Set is required.
In the API Client Management administration table, the Status column shows the current access status of the client.
To change the status, at the end of the table row of each API Client, select the 3-dots icon ![]() > Suspend access.
> Suspend access.
Select Allow access to revoke the ban.
EU Data Act
In order to share data with 3rd parties according to EU Data Act, use the Operational:View Permission Set which can only be assigned to REST API Clients. This Permission Set grants the necessary read-only access to Product Data and selected Related Service Data, without granting administrative or configuration privileges.
For further information on EU Data Act, please contact Service and Support or contact your Proemion representative.
Access AEMP Service
The following chapter targets OEMs and describes which requirements to fulfill in order for consumers, e.g. Machine Owners' third party fleet management systems, to retrieve data via the Proemion ISO 15143-3 (AEMP) API with their account and machines
For more information on the API, read AEMP API.
The machine data that should be retrieved via the ISO 15143-3 API are defined in the PDC using standard metric keys
Refer to AEMP API and Proemion Standard Metrics
Machine data include any history of a machine.
Make sure to meet the following criteria to make machine data accessible via the AEMP API:
-
The machines must be identifiable using the following identifiers (read also about the identifiers in the section General properties > Identifiers / Request parameters in the AEMP API):
-
VIN or PIN identifiers: recommended for consumers to use as the parameters for VIN or PIN are not likely to change over the machine's lifetime.
-
MakeModelSerial identifier (combination of the parameters for OEM name (Make), Model and Serial number): optional to use; both the OEM name and Model are more likely to change than PIN/VIN
In case of a change of a parameter, in the AEMP API the machine must be accessed by a new identifier
Moreover, the OEM name is to be set for each machine individually.
-
Note
Both identifiers are configured by the OEM. It is highly recommended for the OEM to maintain all the parameters for these identifiers to ensure compatibility with any request type a consumer may use.
-
In order to access the AEMP interface, the AEMP - View permission set must be assigned to the requesting Rest Client, see AEMP Subject.
-
The AEMP API should be accessed with a REST client only.
Data Analytics
Data Analytics are an additional option to assist in various kinds of data exploration.
For further information on Data Analytics refer to the DataScience Manual → "Data Analytics".
Note
The Data Analytics tab is not enabled by default and require specific setup and configuration for your organization. For instruction on how to enable it for your account, please contact your Proemion representative.
Note
Only users with at least Organization:Maintain Permission Set have access to the DataPortal Analytics tab.
Note
Please make sure that the correct organization unit within the organization tree is selected to display the available Data Analytics.
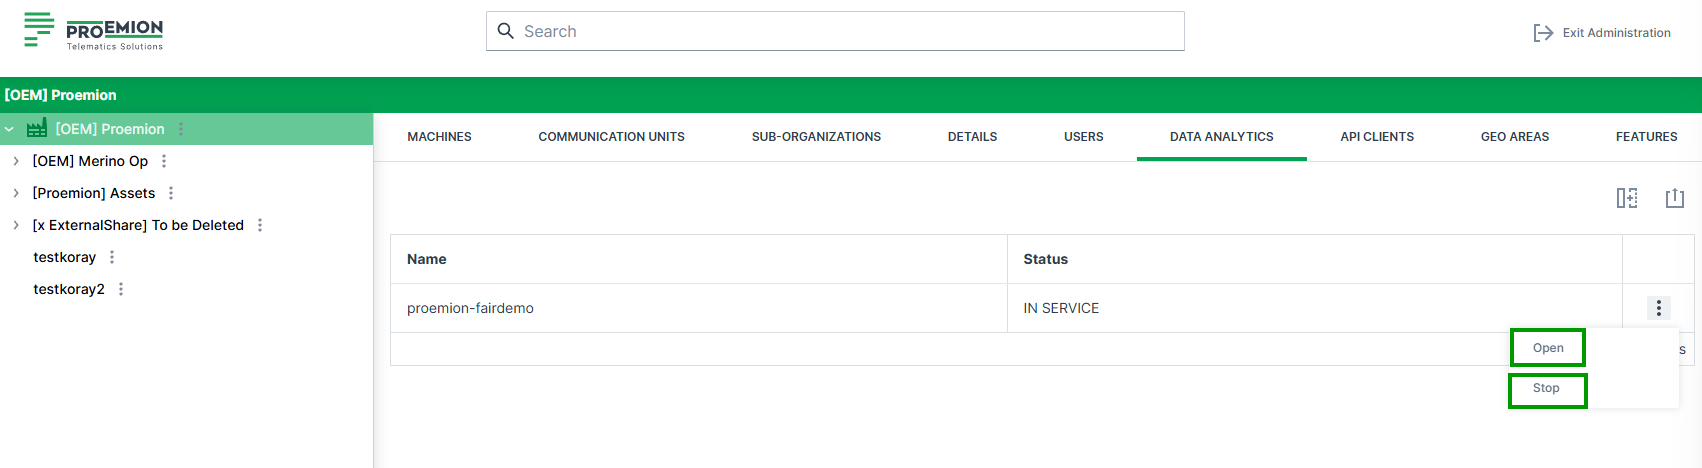
| Item | Description |
|---|---|
| Name | The specific name of the available data analytics instance. |
| Status | Current status is displayed. (STOPPING, PENDING, IN SERVICE) |
| Start | Button to start the predefined data analytics instance. |
| Open | Button to open the latest instance of the data analytics instance. |
| Stop | Button to stop the latest instance of the data analytics instance. |
Start Data Analytics Instance
As the instances run on flexible computing resources, the instance needs to be built everytime it shall be used.
To build an instance, hit the Start button.
After a start it takes approx. 10 minutes until the instance is built and available for the requester.
After this time the instances is IN_SERVICE service state and can be accessed via the Open button.
Note
After > 1 hour not being used, the data analytics instances are shut down automatically and need to be restarted in case of further use.
MFA Configurations
Note
The MFA Configurations tab is only available if Multi-Factor Authentication is enabled for your organization.
The MFA Configurations tab is used to display information about Multi-Factor Authentication (MFA) requirements for users.
It shows a table with the Permission Sets and their corresponding levels for which users are required to set up and use MFA.
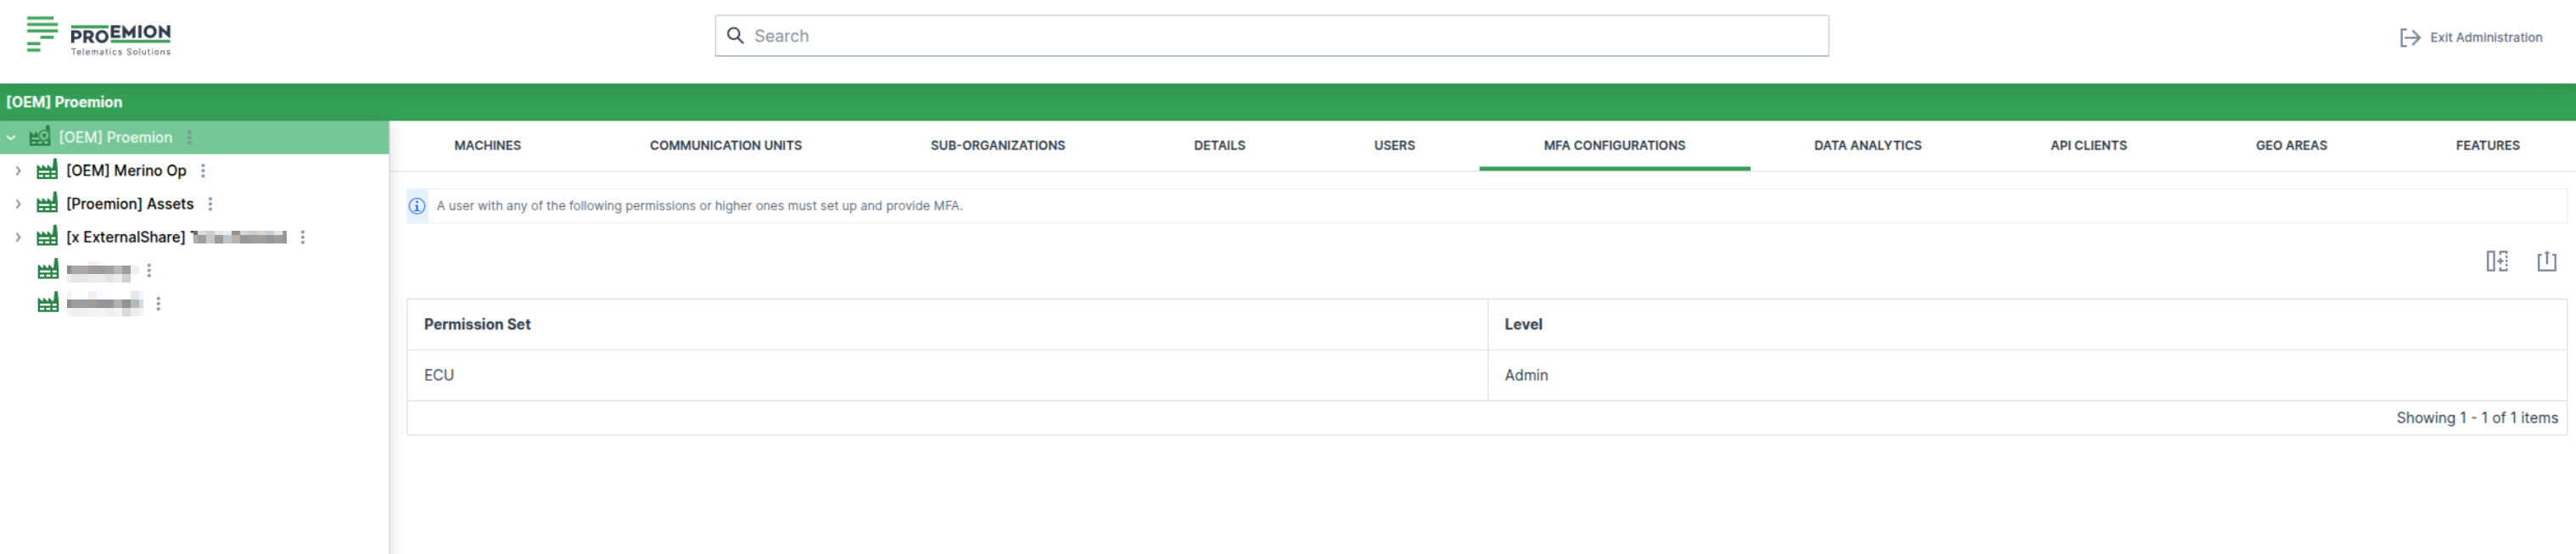
Machines Management
The Machines tab is selected by default when opening Settings > Administration > Organization Structure
The following details are displayed:
-
Machines List: Displays a list of machines in the selected (sub-)organization; you can select a machine to move or share it.
Note
Consider that machines may be assigned to different org units, see Organization Unit Management.
-
GO TO MACHINE: Redirects you to the Machine Page
The GO TO MACHINE link is to be found at the end of the line of each machine. -
EDIT: Opens the Manage Machine dialog to change Properties like Machine Name, VIN, etc. or use the Advanced functions, e.g. Device Mode, Time Fence and other Actions.
The EDIT link is to be found at the end of the line of each machine.
Machine Properties can be also accessed via Machine Page.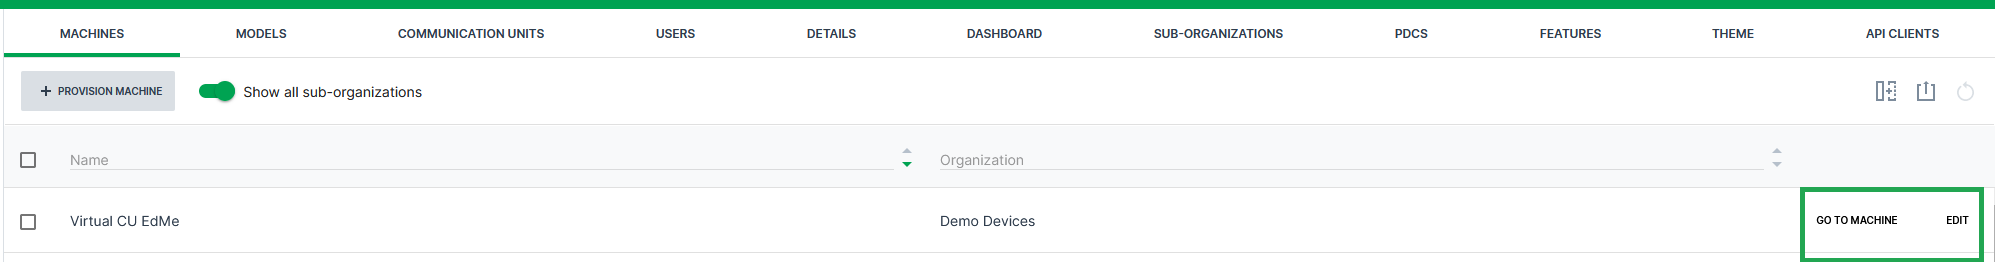
Figure 1: Go to Machine and Edit links
Move a Machine
Note
The Organization:Maintain permission set is required to move a machine from one organization unit to another.
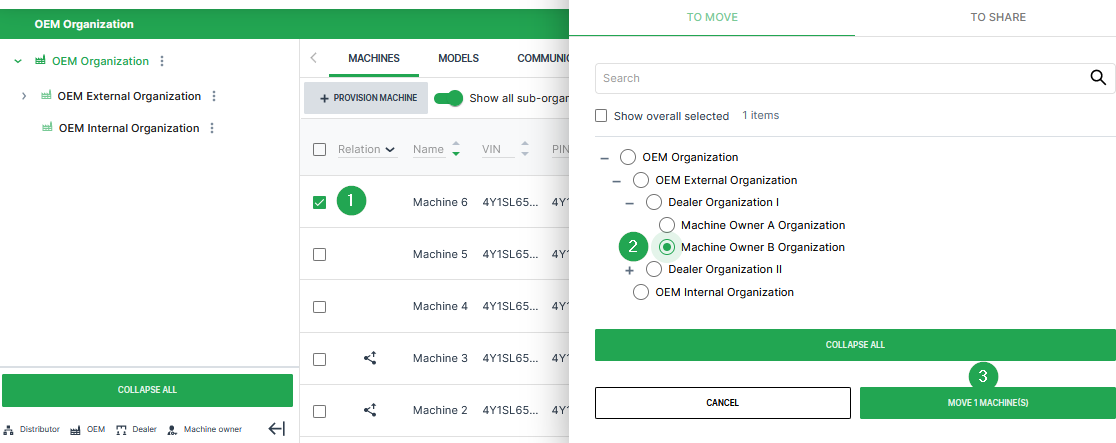
-
Select the check box(es) of the machine(s) you want to move to open the To Move/To Share dialog.
-
Select an organization that you want to move the machine(s) to from the list of organization units.
-
Click the Move Machines button at the bottom of the dialog to move the machine(s) to the organization unit.
Once you successfully move a machine to another organization, it appears in the list of machines of the organization you have moved it to.
Provisioning
Provisioning allows you to make a machine with a telematics unit installed available on the DataPortal. The machine will be visible and during the process you can assign a model and change the machine name, serial number and PIN/VIN.
The Machine:Admin permission set is required for the tasks that need to be performed for this feature.
Note
The status of the new machine can be verified within Settings > Administration > Contract.
If you want to reactivate a machine with terminated contract that is still visible to your organization, follow the steps described in chapter Reactivation.
If you want to renew the contract of the machine, follow the steps described in chapter Contract Renewal.
If it is no longer visible for your organization, you have to complete the Provisioning and Go Live like for new machines.
Data retention and GDPR
The machine is automatically removed from the DataPlatform three month after contract termination. All historical machine and communication unit (CU) data are permanently deleted and cannot be recovered.
Provision Machine Dialog
To open the provisioning dialog, go to Settings > Administration > Organization Structure and open one of the following tabs from the Top Menu Bar:
-
Machines tab:
- Click the Provision Machine button
 .
.
- Click the Provision Machine button
-
Communication Units tab:
- Click Pending Installation.
- Click the Install button
 . Machines that can be provisioned are displayed in the table.
The provisioning dialog opens.
-
Enter the following data within the provisioning dialog:
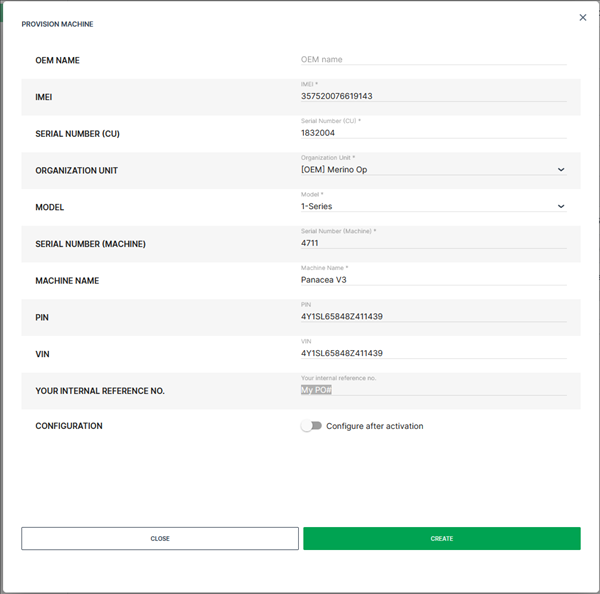
Figure 3: Provision Machine dialog - OEM Name (see also OEM Name)
- IMEI1 (of the communication unit to be provisioned)
- Serial Number1 (of the communication unit to be provisioned)
- Organization Unit1 (where the provisioned machine will be assigned)
- Machine Model1 (only models with assigned PDC can be selected here; if the model has no PDC assigned, it is greyed out, see following image)
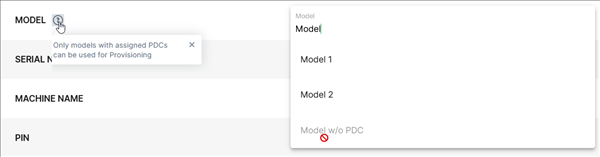
- Serial Number1 (of the machine)
- Machine Name1
- PIN
- VIN
- Your internal reference no.2 (purchase order number for later reference)
- Configuration 2 (if there is a configuration bundle available for the selected CU, the user can enable the automatic configuration update after the activation)
-
Click on Close to exit the provisioning dialog when the message ✓ PROVISION MACHINE SUCCESSFUL appeared.
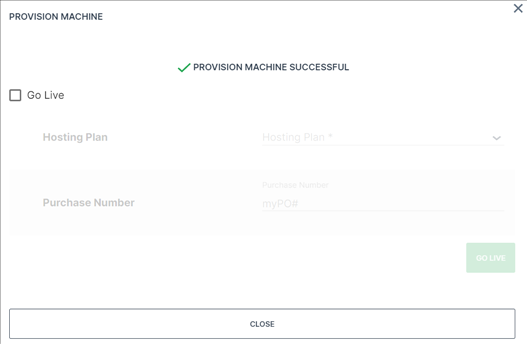
Figure 4: Provision Machine Successful Tip
To perform Go Live immediately after provisioning, click the checkbox and select the required hosting plan.
A successfully provisioned machine is visible on the DataPortal within Settings > Administration > Contract and has the state Provisioned
In the Provisioned state, the communication unit is not permitted to connect to the DataPortal and to transfer data until it is Live:
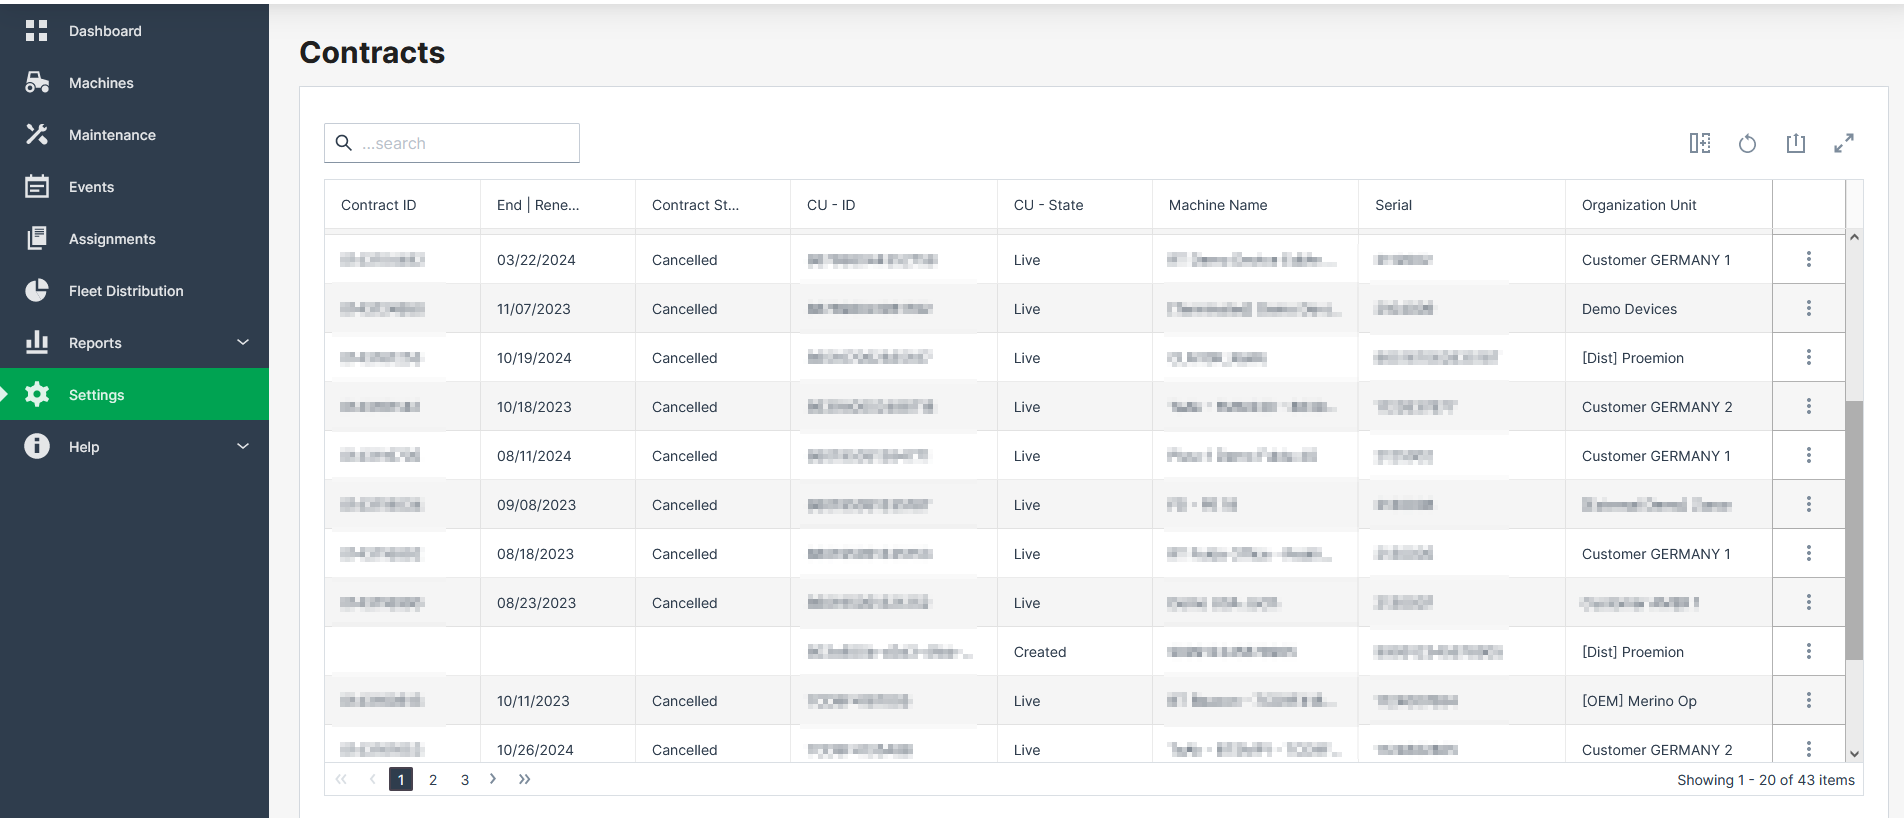
Go Live
Go Live is the activation of Communication Units (CU) after Provisioning. Once the CU has been activated, it is authorized to connect to the DataPlatform and transfer data.
During the activation the following processes are performed:
-
Creating a legal contract between the OEM and Proemion.
-
Enabling the CU for data transfer.
-
Activation of the SIM card.
Note
The automatic activation of the integrated SIM card usually takes about 15 minutes. In exceptional cases it can take up to one working day.
Once these steps have been completed, the CU has the status Live
The hosting contract is enabled and data can be sent to the DataPortal
For information on the availability of the Proemion tariffs for each country, see Cellular Dataplan.
The Contract:Maintain permission set is required for the tasks described below that need to be performed for the Go Live feature.
Note
A pre-set internal reference/purchase number can only be changed by users with Contract:Admin permission set.
Activation of provisioned Communication Unit
There are three options to perform the activation of a provisioned communication unit:
| Option | |
|---|---|
| 1 | Go Live immediately after Provisioning |
| 2 | Go Live in Contracts Overview |
| 3 | Go Live in the Manage Machine Dialog |
Go Live immediately after Provisioning
-
When the message PROVISION MACHINE SUCCESSFUL is displayed after Provisioning of a new machine, enable the Go Live check box.
-
Select the required Hosting Plan.
Note
Note that the list of available hosting plans is based on the CU type to be activated and, therefore, might change depending on the CU type, e.g. CANlink® mobile 3600 or Basic Tracker, etc.
Note
You can view whether the hosting plan supports the (planned) machine location via Supported Countries, i.e. whether the country the machine is or will be located in is covered by the hosting plan.
The supported country can also be checked in the Contracts menu.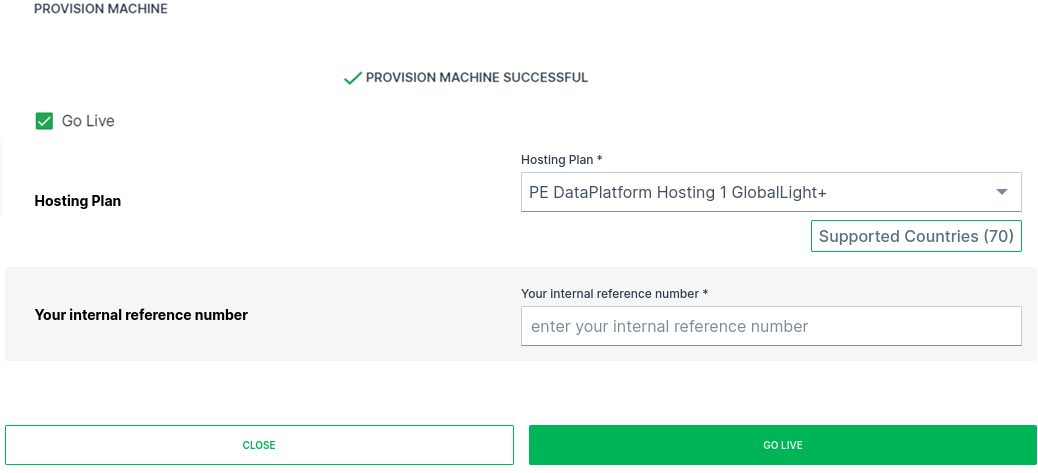
Figure 6: Provisioning to Go Live -
Ensure that the corresponding Your internal reference number is added (the internal reference number can be assigned during Go Live).
-
Click on GO LIVE.
Go Live in Contracts Overview
-
Open Administration > Contracts.
-
Click on the label PROVISIONED at the communication unit which needs to be activated. You may also filter the CU - State column by the label.
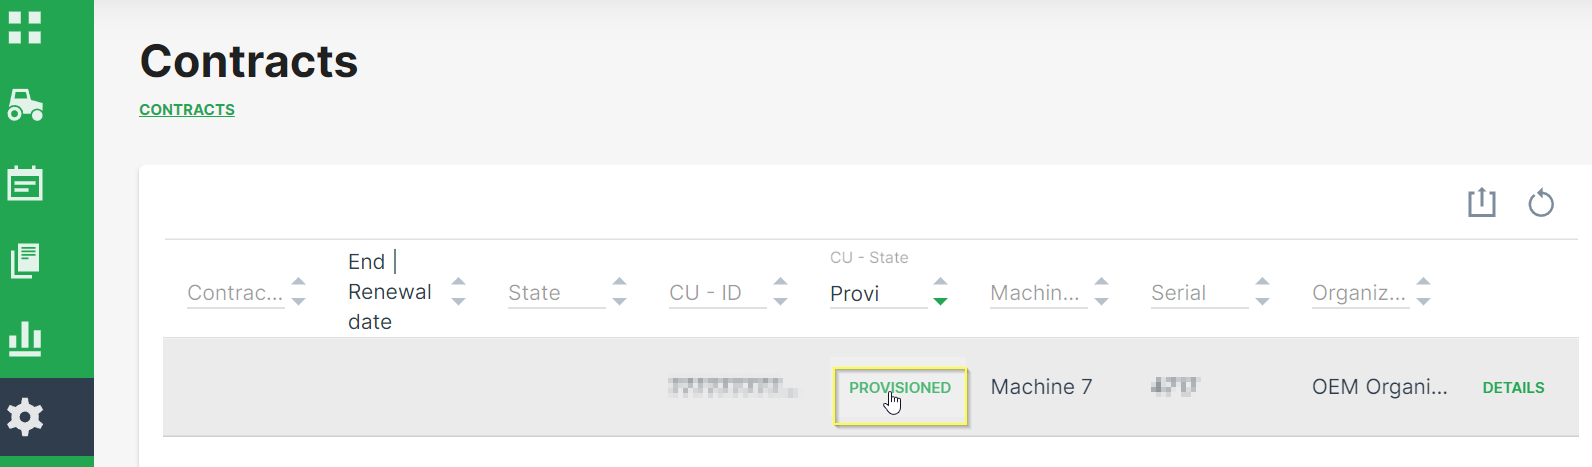
Figure 7: Contract Overview -
Select the required Hosting Plan from the drop-down list.
Note
Note that the list of available hosting plans is based on the CU type to be activated and, therefore, might change depending on the CU type, e.g. CANlink® mobile 3600 or Basic Tracker, etc.
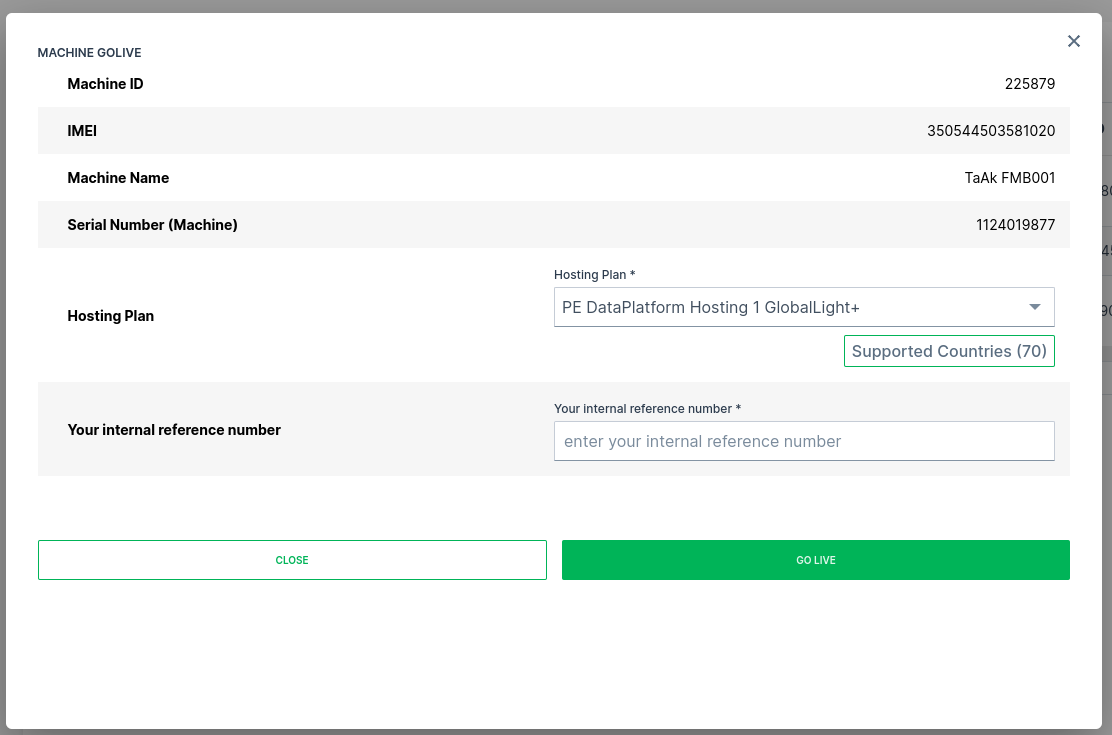
Figure 8: Contract Overview GoLive Dialog -
Ensure that the corresponding Your internal reference number for later reference is entered.
-
Click on GO LIVE.
Go Live in the Manage Machine Dialog
On the Machine Page, select the machine you want to manage and click the Manage Machine vehicle button in the top-right corner.
This opens the Manage Machine window.
-
Open the Machine advanced functions menu and select Machine go live from the left-hand menu.
-
Select Machine GoLive.
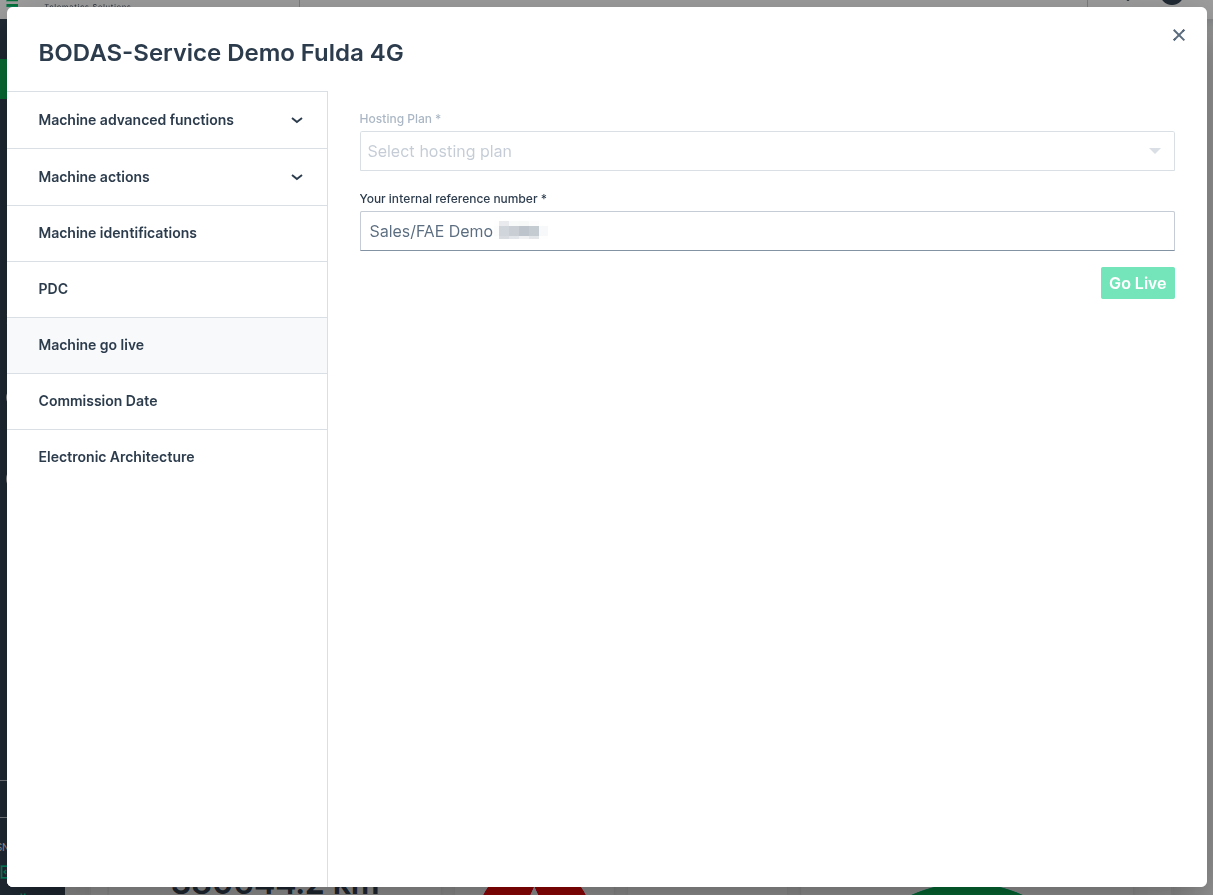
-
Select the required Hosting Plan from the drop-down list.
Note
Note that the list of available hosting plans is based on the CU type to be activated and, therefore, might change depending on the CU type, e.g. CANlink® mobile 3600 or Basic Tracker, etc.
-
Ensure that the corresponding Your internal reference number is added (the internal reference number can be assigned during Go Live).
-
Click on Go Live.
Reactivation
This section refers to the reactivation of a CU with terminated contract. A CU can be reactivated for up to one year after contract termination. Within three months after contract termination, the CU can be reactivated directly using the process described in this chapter. After three month, reactivation is only possible via Provisioning and GoLive.
In case that a machine with terminated contract needs to be reactivated and the machine is still visible to your organization, the following steps must be performed:
-
Go to Settings > Administration > Organization Structure > COMMUNICATION UNITS tab and search for the machine which needs to be reactivated.
-
Click on DETAILS of the corresponding communication unit.
-
Make a note of the: IMEI and Serial Number (of the CU).
-
Go to Settings > Administration > Organization Structure > MACHINES tab and search for the machine which needs to be reactivated.
-
Make a note of the Organization Unit, Model, Serial Number (Machine), (Machine) Name, PIN and VIN.
-
Provision the machine as described in chapter Provisioning.
-
Activate the communication unit as described in chapter Go Live.
Verify Contract Status
The status of the contract can be verified by opening Settings > Administration > Contracts > ![]() > Contract details.
> Contract details.
Share Machine functionality
The Share Machine functionality allows you to grant access to your machines to DataPortal users outside your organization. You should note that a Share Machines functionality to an organization unit means that the parent organization also has identical access to the machine
Additionally, the receiving organization:
-
will see their own widget layout for the machine.
-
can see the owner in the Machine Info on the Machine Page.
-
can assign (e.g. move the share) the machine to one of their own organization units.
-
will receive notifications for shared machines.
-
can not manage the machine because the permission level is automatically set to none.
Note
Share Machine is available in the DataPortal as part of Feature Switches. The Organization:Maintain permission set is required to share a machine from one organization unit to another.
You may also categorize your machine shares, see Machine Share Definitions.
Share a Machine
To share a machine:
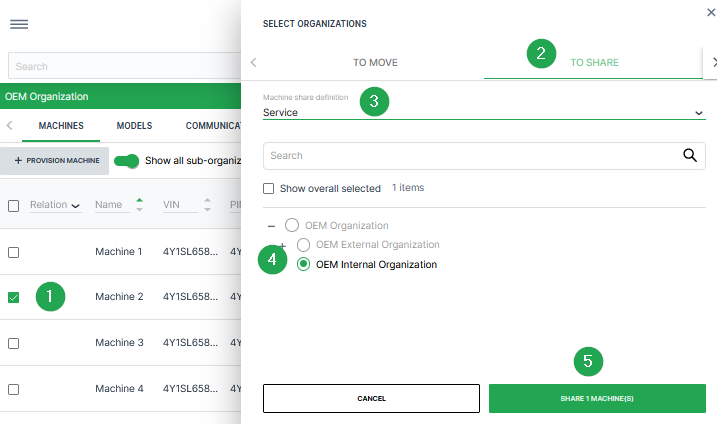
-
Select the check box(es) of the machine(s) you want to share to open the To Move/To Share dialog.
-
Select the To Share tab at the top of the dialog.
-
Select a Machine Share Definition from the drop-down list underneath the share/move tabs.
-
Select an organization that you want to share the machines to from the list of organization units.
-
Click the Share Machines button at the bottom of the dialog to share the machine to the organization you have selected.
Once you have successfully shared a machine to another organization, it appears in your list of machines with the Share icon ![]() .
.
To remove a share:
-
Go to Settings > Administration > Organization Structure.
-
In the list of machines, click the Share icon next to a machine and select the Delete Share Machines functionality icon.
Geo Areas
Geo Areas are pre-defined areas on the map that can be applied in features which are based on the machine locations, e.g. in the GeoFence feature.
Geo Areas are bound to the business unit of the user creating them.
In the Geo Areas tab, you can individually draw and store these areas. Thereby, you don't need to draw the area manually each time you want to limit the area on the map.
In the according DataPortal feature you can then choose from a list of Geo Areas.
Requirements
-
The required permission set to define, edit, delete or export Geo Areas is GeoAreas:Maintain.
-
GeoAreas can only be created by Tenants where Business Unit is enabled globally. If you create GeoAreas in a sub-organization, it will be automatically assigned to the parent Business Unit.
Create Geo Area
To define Geo Areas, proceed as follows:
-
Open Settings > Administration > Organization Structure > Geo Areas tab. If the Geo Areas tab has already defined Geo Areas, they will be displayed in a table.
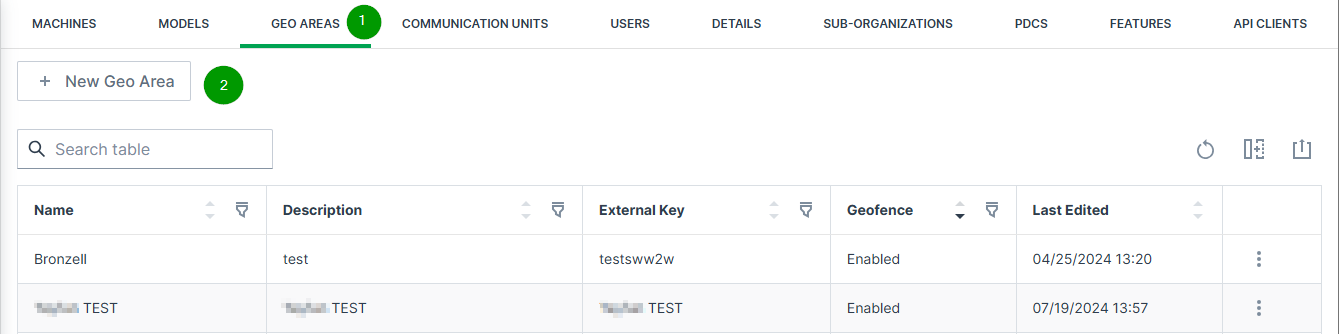
Figure 10: Geo Areas page -
To define a new Geo Area, click
 button. The map opens:
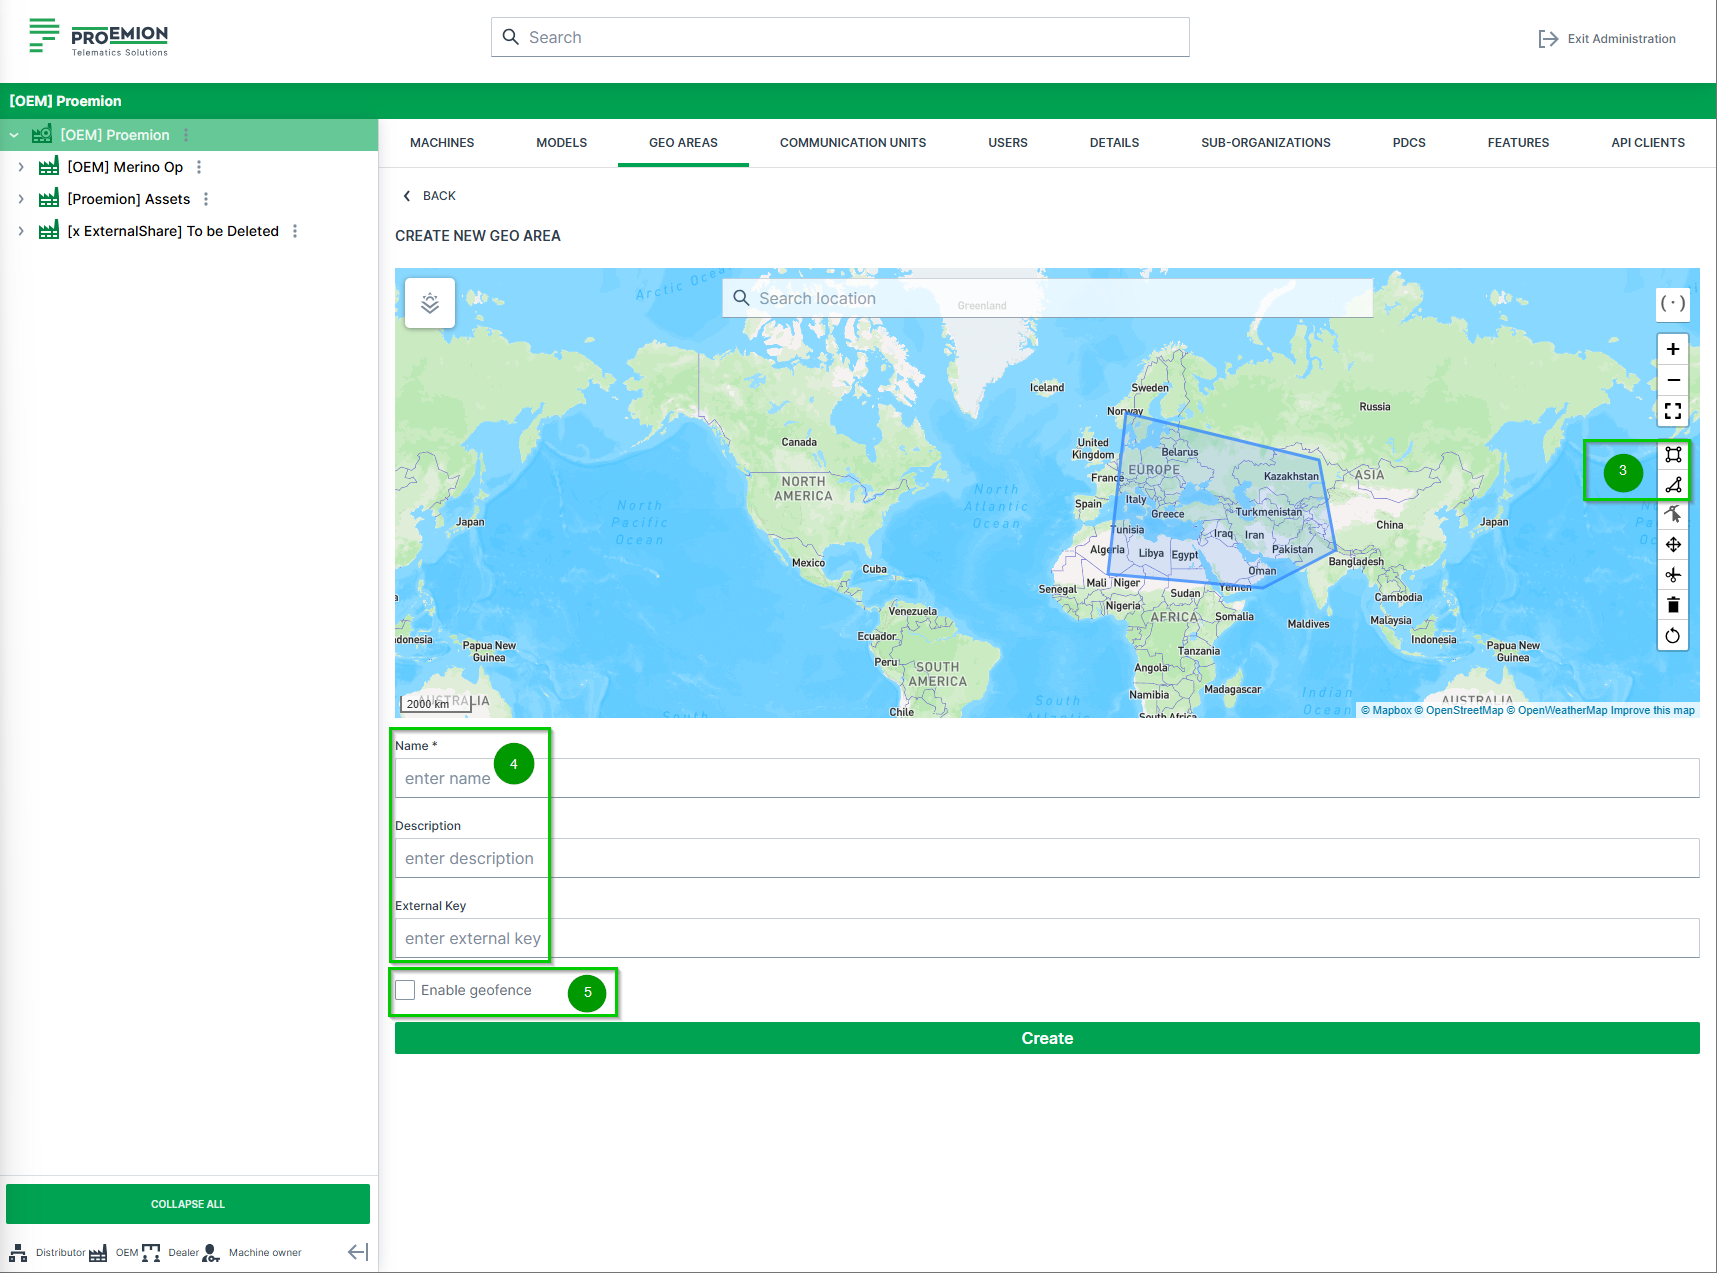
Figure 11: + NEW GEO AREAS -
Draw the Geo Area with the
 rectangle icon or
  polygon icon.
Figure 12: rectangle icon -
Enter a Name, a Description (optional) and an External Key (optional), that can be used to add custom keys, e.g. for reference.
-
Activate or deactivate the option Enable geofence. For more information read section GeoFence.
-
Click create to save your changes.
✓ The new Geo Area is now listed in the page and can be used in the DataPortal.
Edit Geo Area
-
Open Settings > Administration > Organization Structure > Geo Areas tab.
-
In the Geo Areas page, select the
3-dots at the end of the line of the desired Geo Area to open the available options:
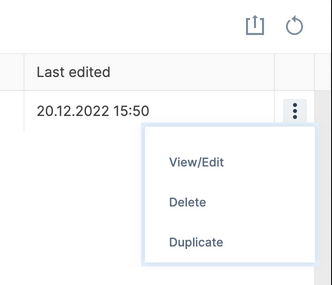
Figure 13: 3-dots -
Select the desired options:
Option Description View/Edit View or edit the selected Geo Area in the map as shown in Create Geo Area. When editing the Geo Area, make sure to use the Edit layer options:  .
.
IMPORTANT: When drawing a new area on the same map by using the polygon or rectangle options, the selected designed Geo Area will be deleted (a warning will be displayed beforehand).After editing, save your changes.Delete Delete the selected Geo Area. The Geo Area will be removed from the Geo Areas page. Duplicate Create a copy of the selected Geo Area. The duplicate will be listed in the Geo Areas page with "Copy" in the name: 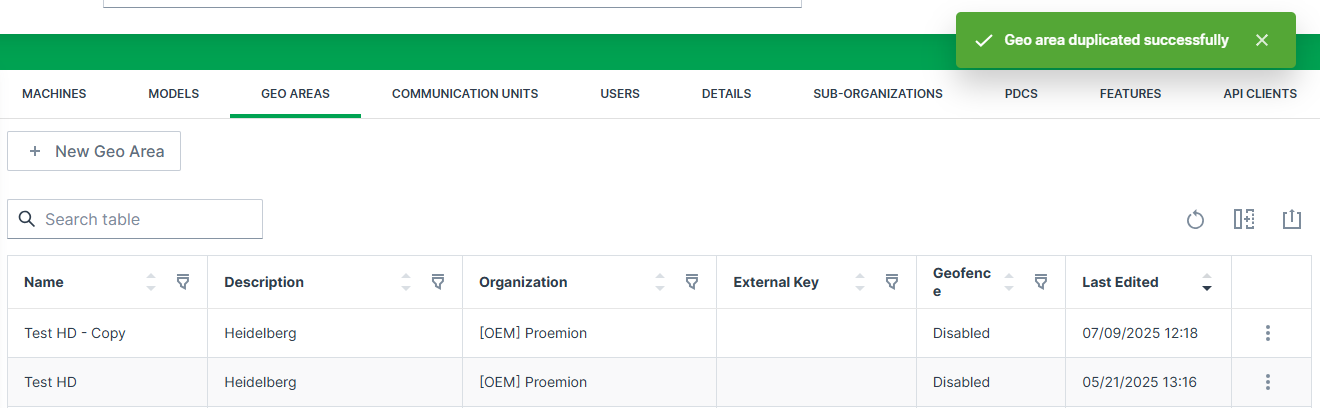
-
- The internal reference number can already be entered in the provisioning dialog. In case that the Go Live process is started at a later time, the correct internal number is already assigned to the machine then.
- The automatic configuration is only available when the Feature Switch for Configuration Management is enabled and if there is a corresponding configuration bundle available for the selected CU.
User Management
There are different kinds of user accounts and security configurations that can be set up on the DataPortal:
-
Regular, standard accounts allows user to log into the DataPortal directly, see Create Regular User Account.
-
SSO accounts allow for a centralized login, see Create SSO User Account.
-
MFA (Multi-Factor Authentication) can be enabled to increase the security of user logins by requiring a second factor in addition to the password, see section Multi-Factor Authentication.
Large equipment manufacturers might want to use SSO to access the DataPortal for security (centralized access control), comfort (a single sign-on/authentication to remember) and providing customers with a single landing page for all applications. SSO users can have multiple accounts for multiple applications, including the DataPortal, but only need to log in once.
Overview
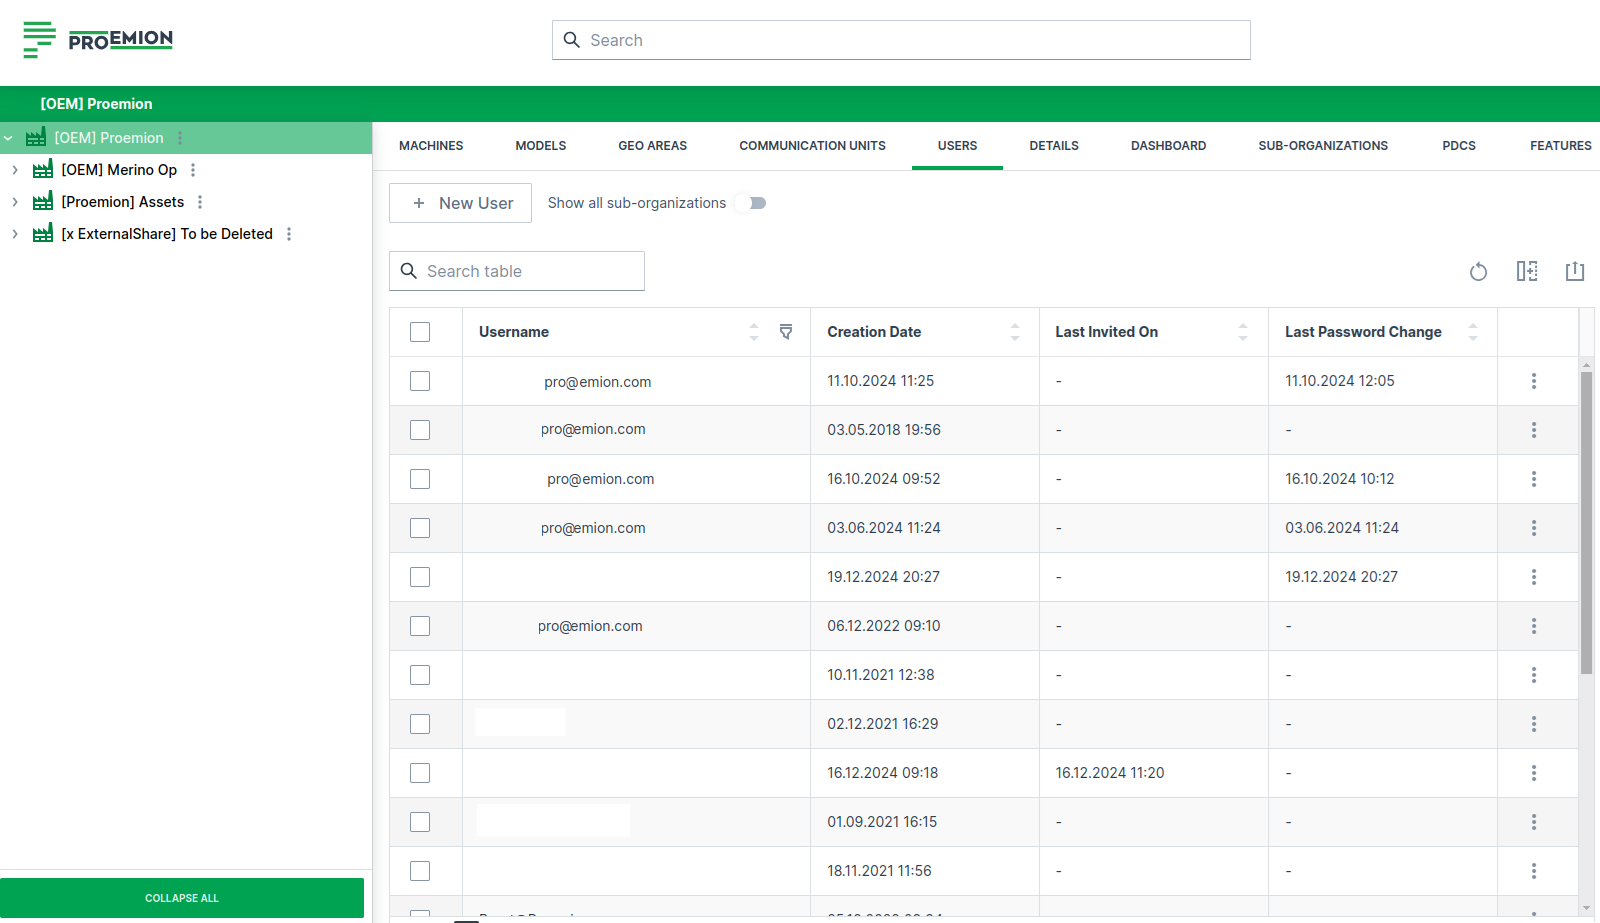
The User Management is to be found at: Settings > Administration > Organization Structure > Users tab.
The Permission Set Organization:Maintain is required for viewing and editing the user management.
The Users tab lists all users in a table and shows additional information on the account activity in different columns, e.g.:
- Type (Regular, SSO)
- Status
- Last Access
- Creation Date
- Last Invited On
- Last Password Change
- Reset Password and Password Reset Request At, see also Force Password Reset
Create Regular User Account
Add users to the DataPortal within the Settings > Administration > Organization Structure > Users tab by following the steps below:
New User
Select the corresponding organization unit in the org tree on the left and click on the New User button to open the dialog.
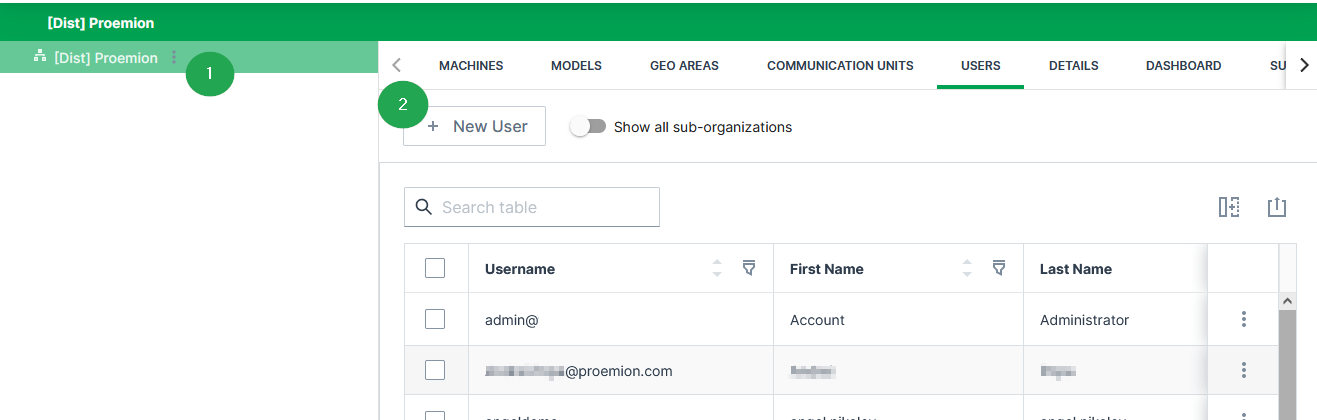
Enter User Details
In the Overview, enter the information for the Regular account:
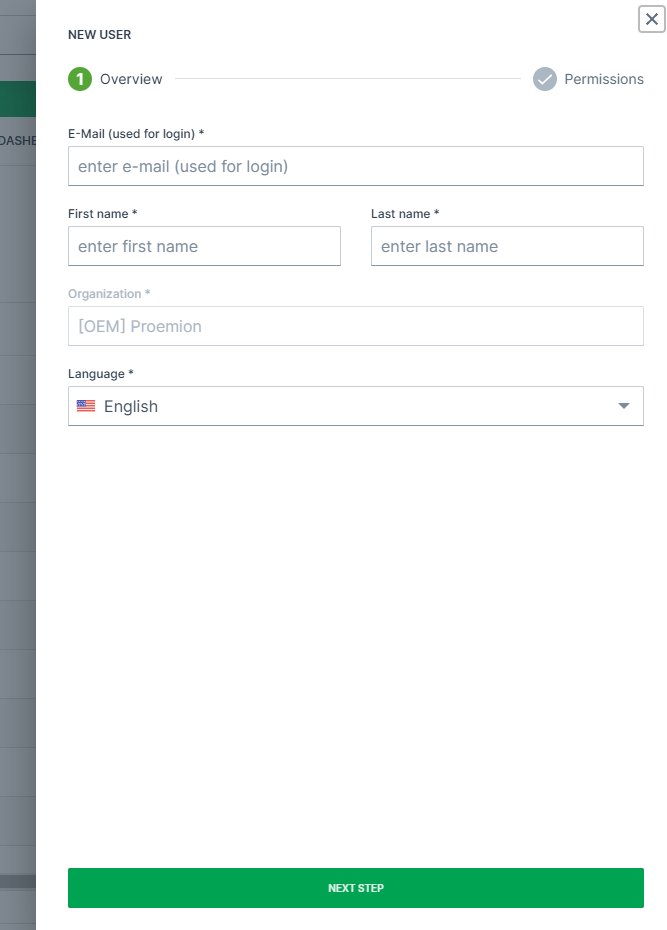
| Item | Description |
|---|---|
| Email address of the user. | |
| First/ Last Name | First and last name of the user. |
| Organization | The organization the user belongs to in the DataPortal as selected above in New User. |
| Language | The language group the user belongs to. |
Note
For the email address, usually used as the username, it is allowed to use email subaddresses, provided that your email provider supports it.
By that, you can have multiple accounts with 1 email address, e.g. myemail+machine-owner@oem-mail.com
This feature supports Dealers that work on multiple OEMs; there might be many users that need multiple emails to log in to different OEMs' DataPlatform accounts.
It can also help a single OEM's user to create test users for different organization unit types or even subcustomers, e.g. myemail+dealer@oem-mail.com, myemail+customer-a@oem-mail.com.
Note
The DataPortal email/username is NOT case-sensitive. This means john.doe@sample.com, John.Doe@Sample.com and johN.doE@sAmple.com are identical and represent a single user account.
Note
It must be considered that below each specific DataPlatform URL, such as dataportal.proemion.com usernames have to be unique. But identical usernames could appear below separate white-labelled DataPlatform URLs like customer1.proemion.net or customer2.webpage.com. In case a white-label package is required, please get in contact with your Proemion sales representative.
Assign Permissions
After entering the user information in the Overview, select Next Step to assign Permissions.
User permissions can also be managed using predefined User Roles.
After assigning the permissions to the account, select the Submit button to complete the user setup.
After selecting Submit to conclude the process, the user is added to the DataPortal pending email verification.
Email Verification
An invitation link is sent to the user as shown and users are requested to verify their email address.
Note
The invitation link is valid for 7 days.
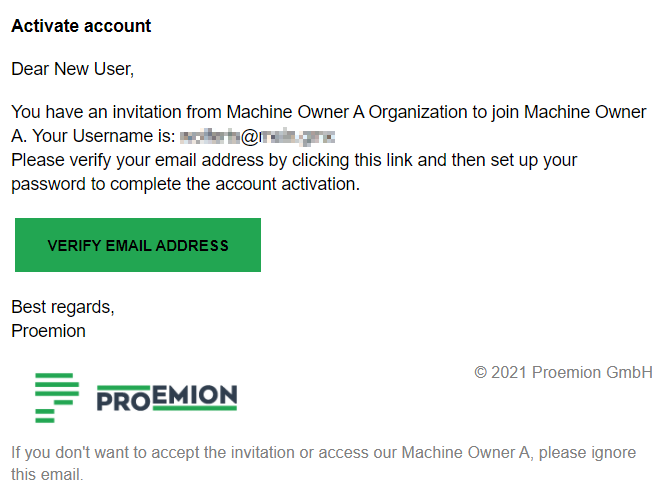
Users are then redirected to the DataPortal where they can set a password before login
For the creation of new passwords, see Password Policy.
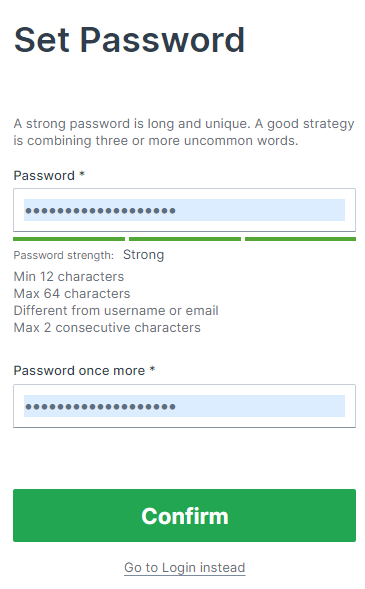
Multi-Factor Authentication
When Multi-Factor Authentication (MFA) is enabled, users must authenticate using a second factor (a time-based one-time password from an authenticator app) in addition to their regular login credentials. Once enabled, users will be prompted to configure MFA during their next login.
Enable MFA for Tenant
MFA is configured per tenant by assigning the required Permission Sets to the tenant.
Note
Please contact your Proemion representative to enable MFA for your organization.
Once MFA is enabled for a tenant, users matching the defined Permission Set (or higher) will :
- Be prompted to set up MFA during their next login.
- Be required to enter a valid time based one-time code (TOTP) during each subsequent login.
Upon first login after MFA is enabled, users are shown a QR code to scan using an authenticator app:
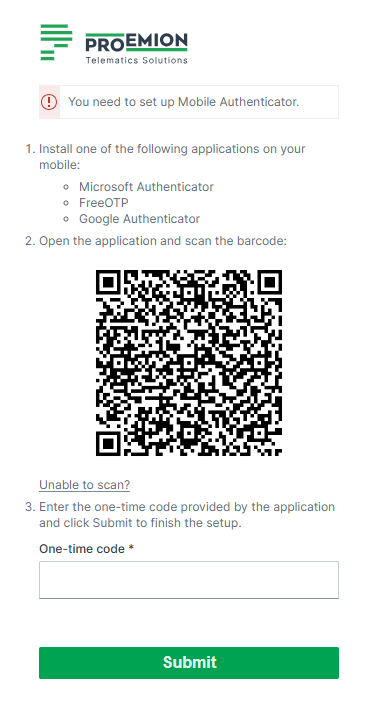
After completing setup, users will be prompted to enter a new one-time code from their authenticator app at each login:

Verify MFA Enabled for Tenant
You can verify whether MFA is active for a tenant by viewing the tenant's permissions.
To do so, proceed as follows:
- Go to Settings > Administration > Organization Structure.
- Select the tenant on the left side and navigate to the MFA tab.
If MFA is enabled for the tenant, a list of Permissions requiring MFA is displayed. Users with one of these Permission Sets (or higher) are required to configure and use MFA.
Verify MFA Enabled for User
To check whether MFA is enabled for a specific user, proceed as follows:
- Go to Settings > Administration > Organization Structure.
- Navigate to the Users tab.
- Look for the MFA Enabled column. If MFA is enabled for the user, this column will display Yes.
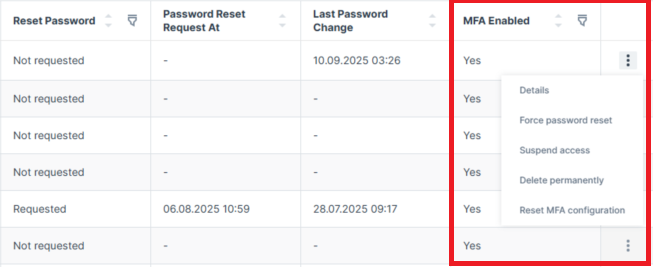
Reset MFA for a User
If a user no longer has access to their MFA device (e.g. due to a lost phone or removed authenticator app), a system administrator can reset their MFA configuration. To reset MFA, proceed as follows:
- Go to Settings > Administration > Organization Structure.
- Navigate to the Users tab.
- Open the 3-dots menu at the end of the row of a user and choose one option of the following from the context menu:
- Select the Reset MFA option.
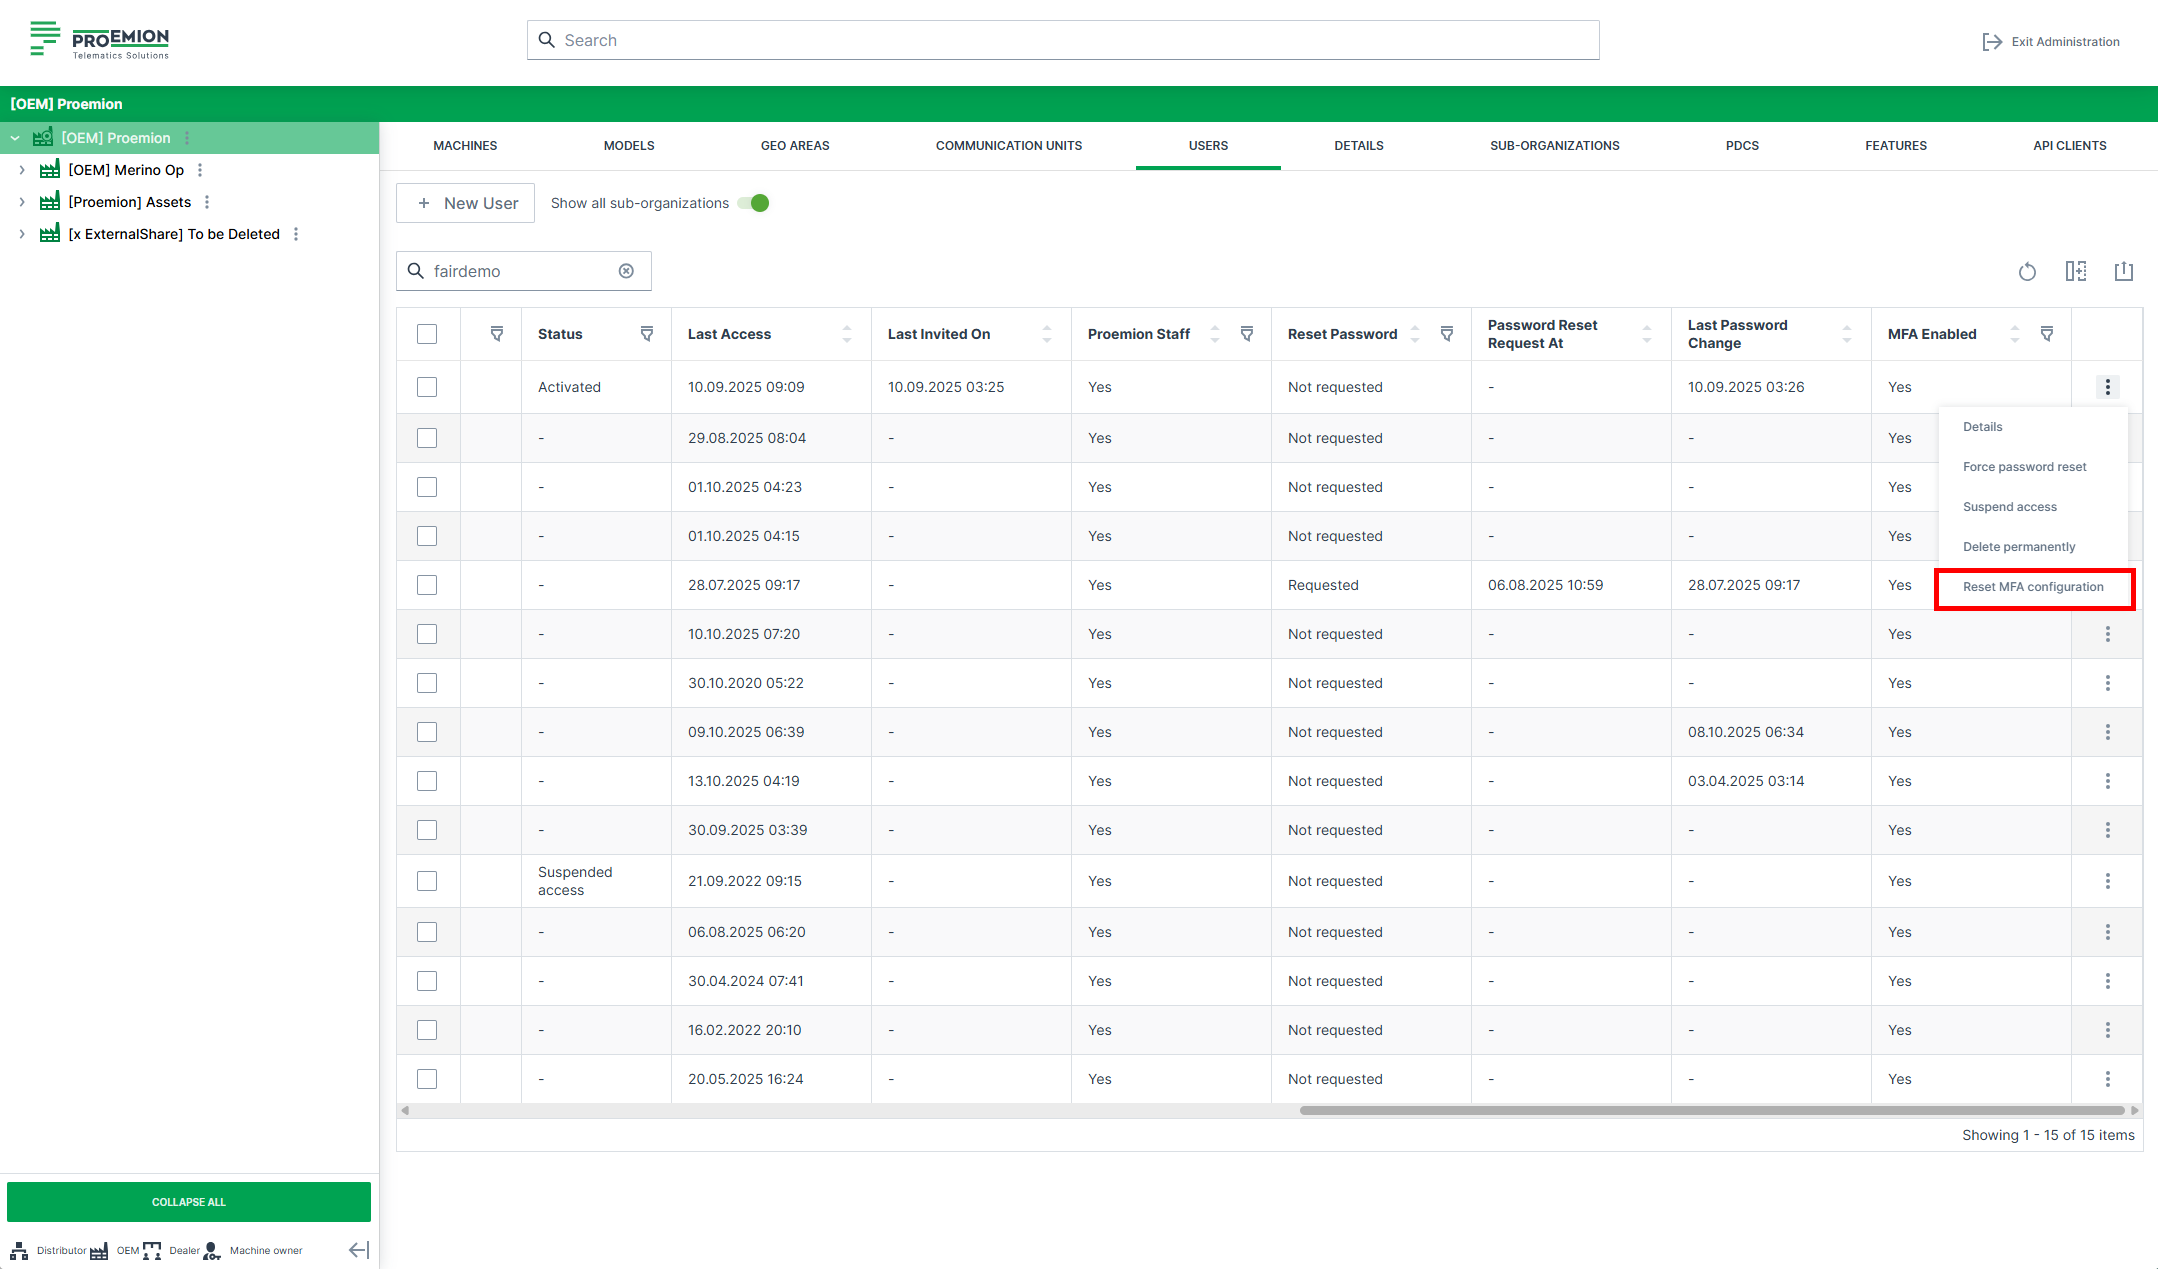
-
Select the Details option and click the Reset MFA Configuration button.
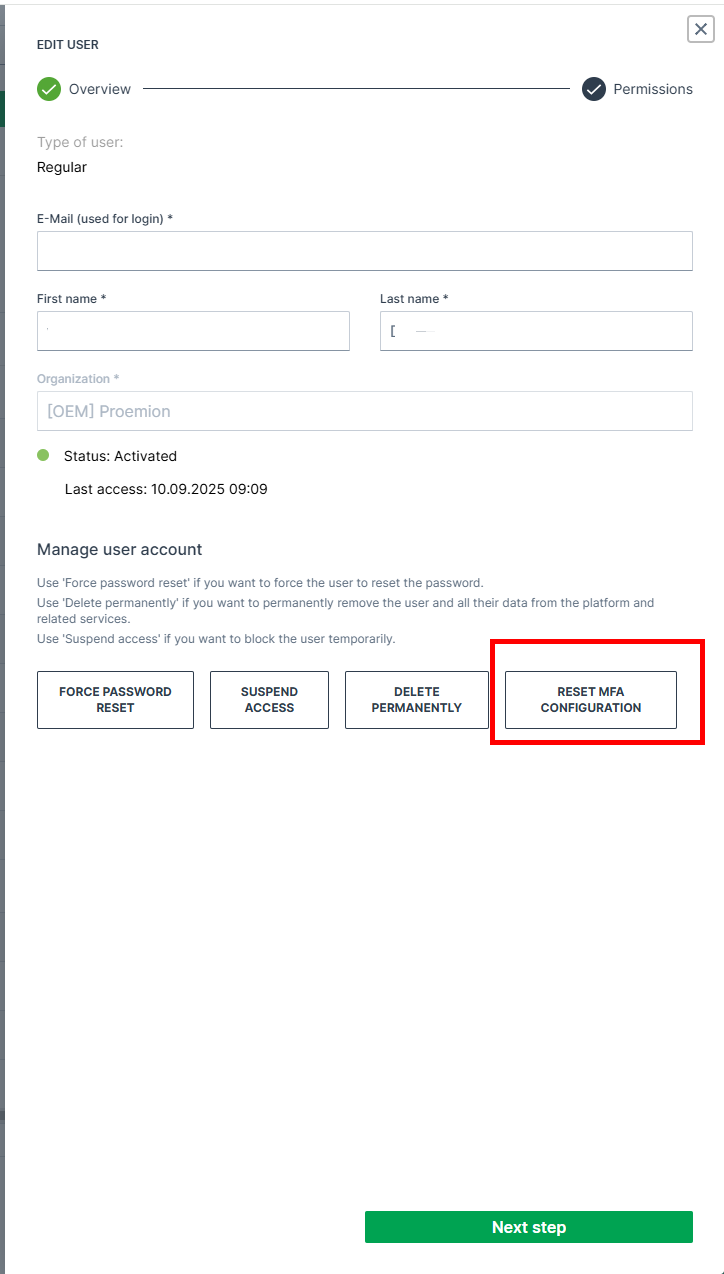
Figure 10: MFA Reset via Edit User menu -
Click Confirm in the reset dialog.
Warning
Resetting MFA does not disable it. The user will be required to reconfigure MFA at the next login. The user will then be prompted to set up MFA again during their next login.
Create SSO User Account
The authentication (confirmation of your identity) of SSO users is performed by the configured identity provider, whereas the user permissions and their organization assignment are managed on the DataPlatform.
We recommend doing this automatically on the user login by setting up a customized mapping from attributes in the identity provider like roles to organization units and permissions in the DataPlatform.
Note
By doing so, the manual creation of one or both "regular" and "SSO" user types can be disabled by Proemion and the New User button won't be displayed
This might be needed for organization units that are not tenants.
Alternatively, SSO users can be created manually in the DataPortal
The account creation can only be performed by authorized users
Add users to the DataPortal within the Settings > Administration > Organization Structure > Users tab by following the steps below:
New SSO User
Select the corresponding organization unit in the org tree on the left and click on New User button to open the dialog.
Use the SSO form:
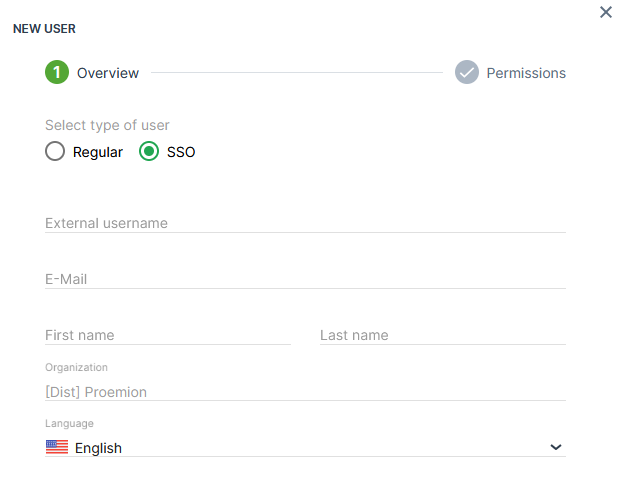
| Item | Description |
|---|---|
| External Username | This is the name of the account in the SSO identity provider. |
| E-Mail1 | Email address of the user. |
| First/ Last Name1 | First and last name of the user. |
| Organization1 | The organization the user belongs to in the DataPortal as selected in New SSO User. |
| Language1 | The language group the user belongs to. |
Assign Permissions
After entering the user information in the Overview, select Next Step to assign Permissions.
After assigning the permissions to the account, select the Submit button to complete the user setup.
Note
SSO users do not receive an invitation link.
View and Edit User
To view and edit users in an organization, you must first select the organization in the org tree on the left of the panel, then select Users from the top menu bar
This view lists all the users in the selected child organization.
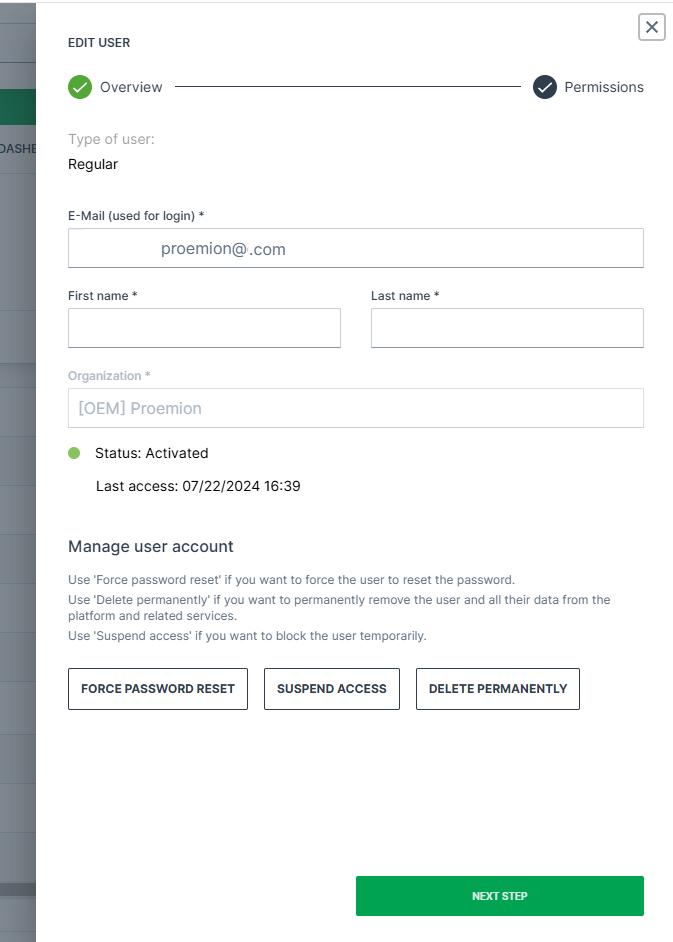
-
Select Details to the right of the user to open the Edit User dialog.
-
Adapt the fields as desired and proceed to the Next Step.
-
In Permissions, adapt the user access for the Subjects.
-
Click Submit to save the changes.
Note
The link to verify a new email address is valid for 4 hours.
Note
The organization corresponds to the structure displayed in the org tree and cannot be changed.
Move Users across Organizational Units
Users can be moved across Organization Units as follows:
-
Select the user(s).
-
Activate the checkbox of the user(s).
-
The Organization tree will appear in the Select Organizations dialog on the right.
-
Select the target organization.
-
Click Move User on the bottom right to apply the change.
Force Password Reset
DataPortal Admins can force a password reset for users.
Users with a pending forced password reset cannot log in, until they have requested a new password in the login mask and completed the password reset, see Password Reset.
Note that after forcing a password reset, the users receive no email unless they reset the password.
To force the password reset, proceed as follows:
| Permission Set Name | Level |
|---|---|
| User | Admin |
-
Open the Settings > Administration > Organization Structure > Users tab.
-
Open the drop-down menu by the end of the row of the user.
-
Select the Force password reset option.
-
Confirm the reset in the dialog window:
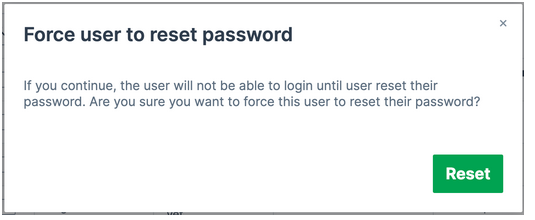
In the Users table, you can then view whether a user has a forced password reset and when it was requested:
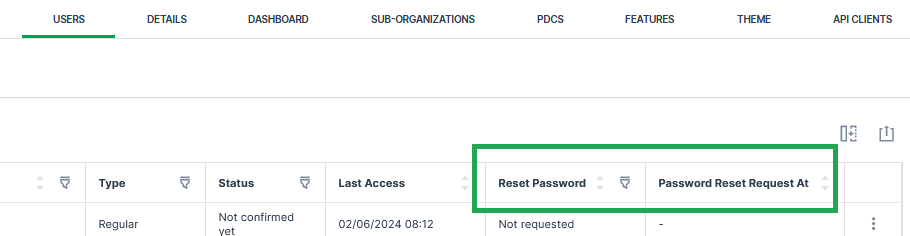
Suspend Users and Inactive Users
-
To suspend access for the DataPortal account, open the Details of the user account.
-
In the Edit User dialog, click the Suspend access button and the user will not be able to login to the application.
-
To re-activate an account, click Restore access.
Inactive users that meet the following criteria will be removed from the system automatically:
- users that have no account activity in more than a year AND never logged in
OR
- no login over 3 years AND no account activity for 2 years
To comply with GDPR, once a month user-accounts that meet the above criteria are removed from the system.
Note that as an admin you may also Force Password Reset.
Delete Users
Use Delete permanently if you want to permanently remove the user and all their data from the platform and related services.
Required permission:
| Permission Set Name | Level |
|---|---|
| Organization | Admin |
Users can be deleted as follows:
-
Select the user.
-
Activate the check box next to the user.
-
Click on Delete permanently.
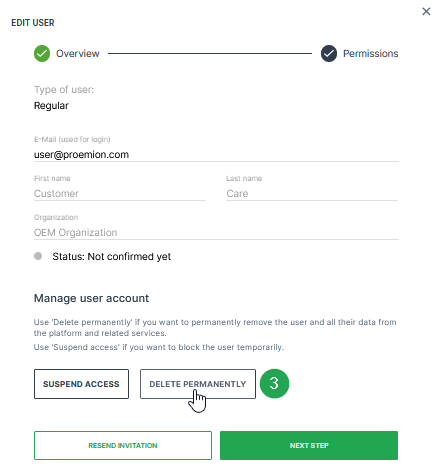
✓ The message User has been successfully deleted. will appear in the upper right corner.
User Roles
The concept of user roles simplifies user management by allowing administrators to create, edit, delete and assign user roles to individual users directly in the DataPortal.
User roles help standardize permission management for users with similar responsibilities, for example Machine Owners, Dealers or Service Teams. Instead of configuring permissions individually for each user, predefined roles can be assigned and reused across the organization.
For example, you can assign specific roles for various tasks in the DataPortal, such as Machine Owners or Dealers.
Note
The first user role must be created by your Proemion representative. Please contact them.
To create, edit and delete user roles, the Tenant:Admin Permission Set is required.
To assign user roles to users, the Org:Maintain Permission Set is required.
Create User Roles
After the first user role has been created by your Proemion representative, you can create additional custom user roles.
Note
The list of available user roles depends on the roles that have already been created in your DataPortal instance.
To create a new user role, proceed as follows:
-
Open the User Roles page via Settings > Administration > User Roles. The overview lists all existing roles.
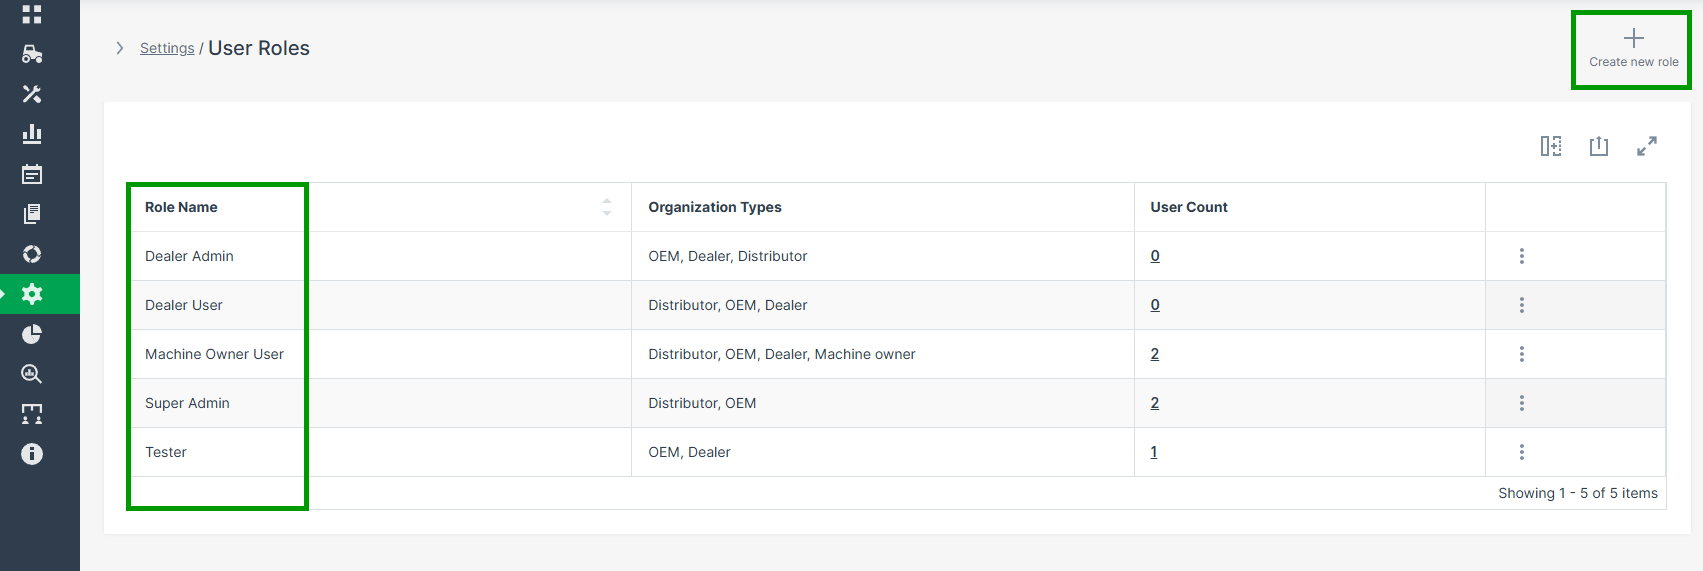
Figure 1: Overview User Roles Page -
Click Create new role in the upper-right corner to open the role creation page.
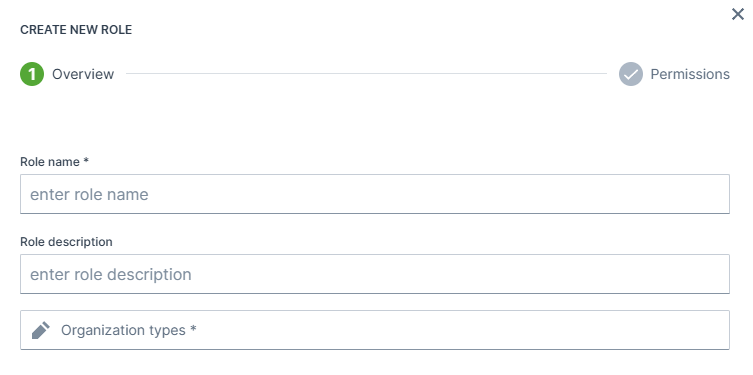
Figure 2: Create User Roles Page -
Enter the basic information for the role, to determine in which organization environments the role can be assigned:
- Role name: (mandatory): Choose a clear and descriptive name.
- Role description: (optional): Add context for other administrators.
- Organization types: (mandatory): Select one or more of:
- OEM
- Dealer
- Distributor
- Machine Owner

-
Click Next Step to proceed with the permission assignment.
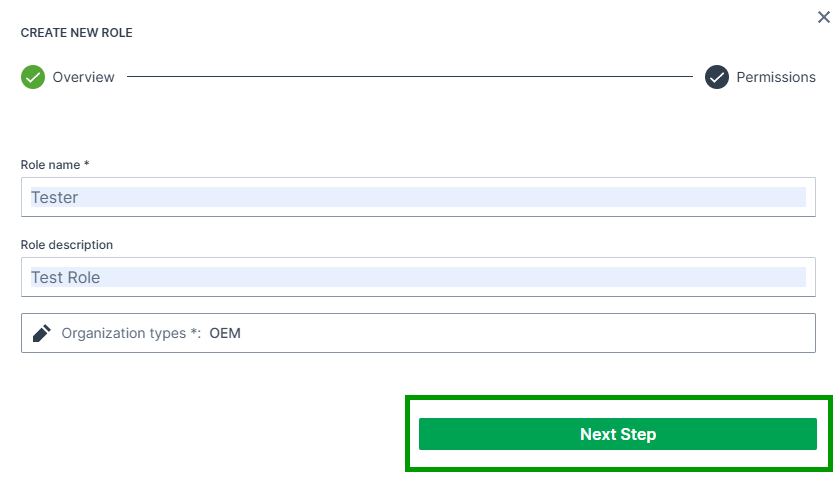
Figure 3: Next Step -
Assign the required permissions for each subject:
- Subjects are grouped for improved usability.
- Click the question-mark icon to view a tooltip describing the subject’s main functions.
- Use the quick-action buttons to speed up configuration:
- Set all to admin: Grants admin permission for all subjects.
- Set all to none: Removes all permissions.
Recommendation: Start with minimal permissions and grant higher privileges only where necessary.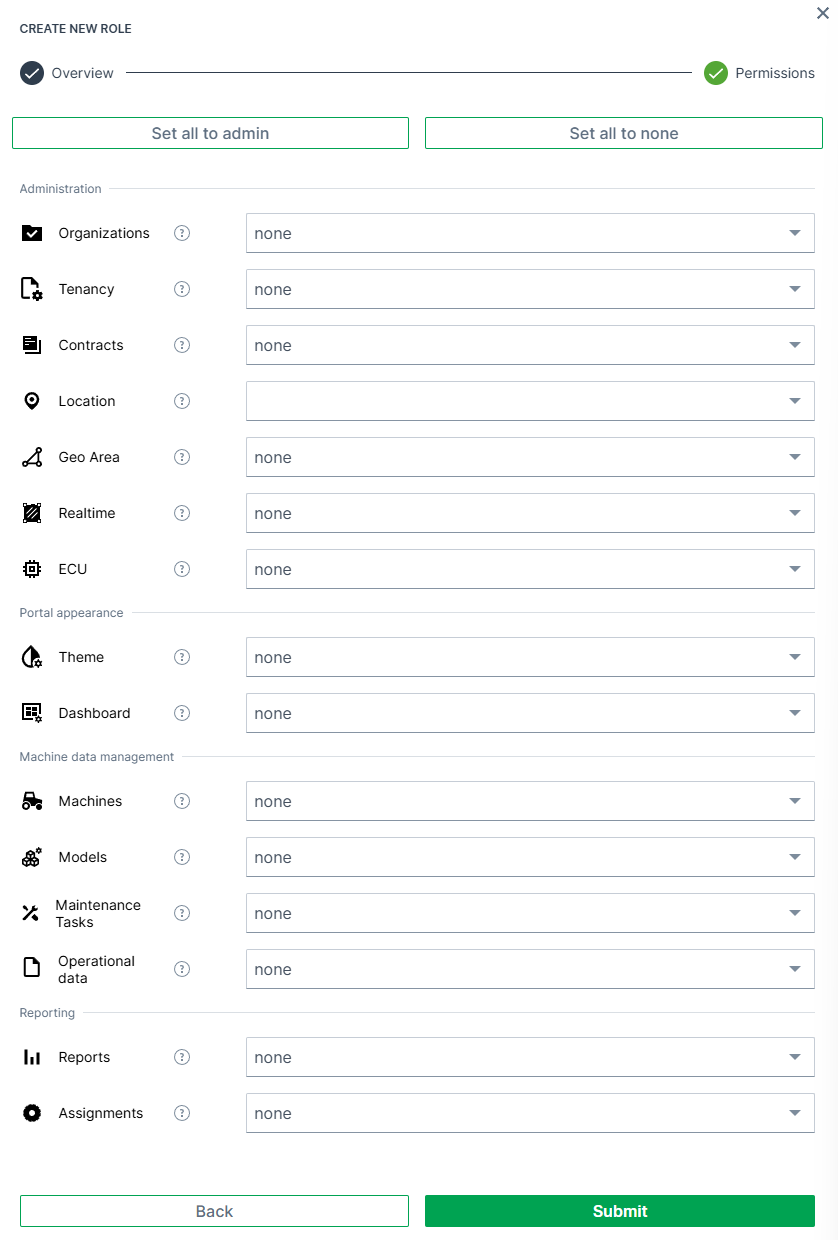
For further information about permissions, refer to the Permissions documentation.
-
Click Submit to finalize the role. A confirmation message appears: Role successfully created!
The role is now listed in the User Roles overview.
Delete User Roles
To delete an existing user role, proceed as follows:
- Open the ⋮ (three-dots) menu next to the role you want to remove.
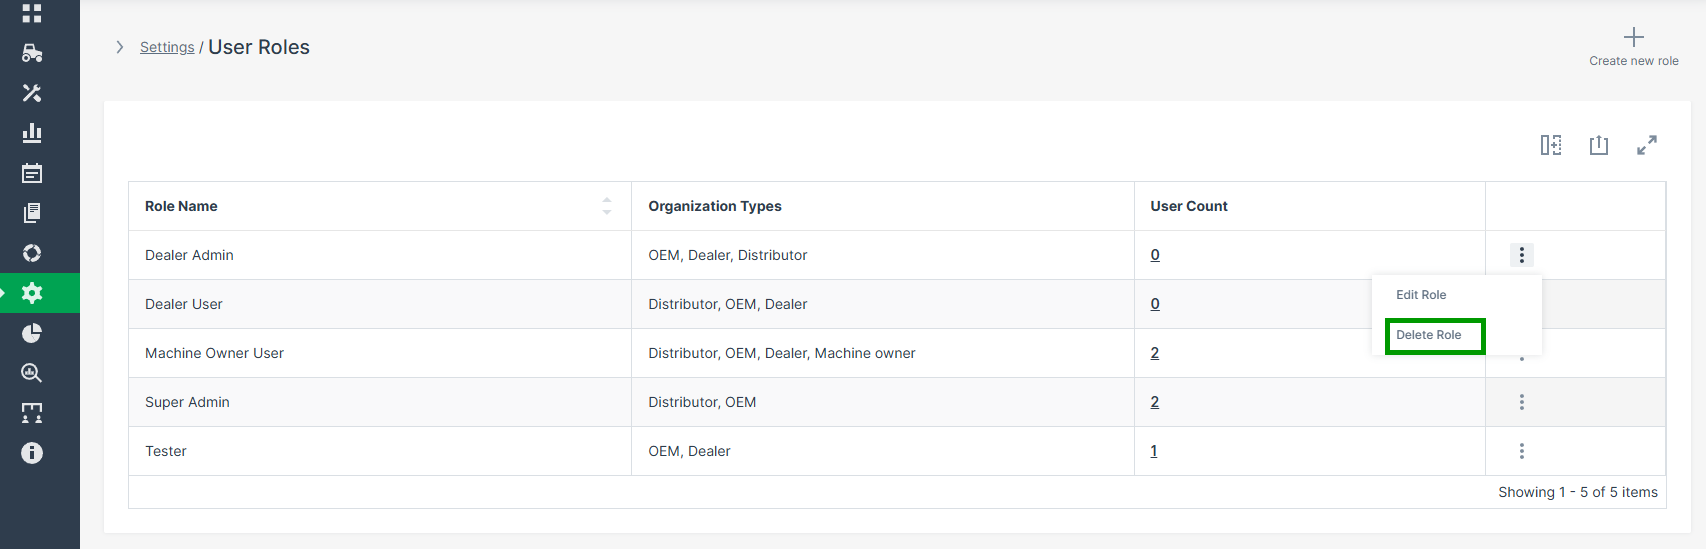
-
Select Delete Role. A delete confirmation dialog appears.
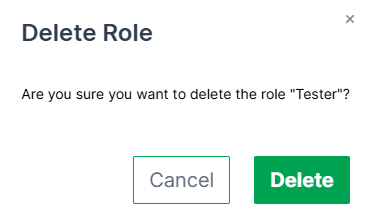
Figure 4: Delete Role Confirmation Dialog -
Click Delete to confirm the action. A confirmation message appears: Role successfully deleted!
Note
If the role is currently assigned to users, it cannot be deleted.
Edit User Roles
To modify an existing role, proceed as follows:
-
Open the ⋮ (three-dots) menu next to the role and select Edit Role.
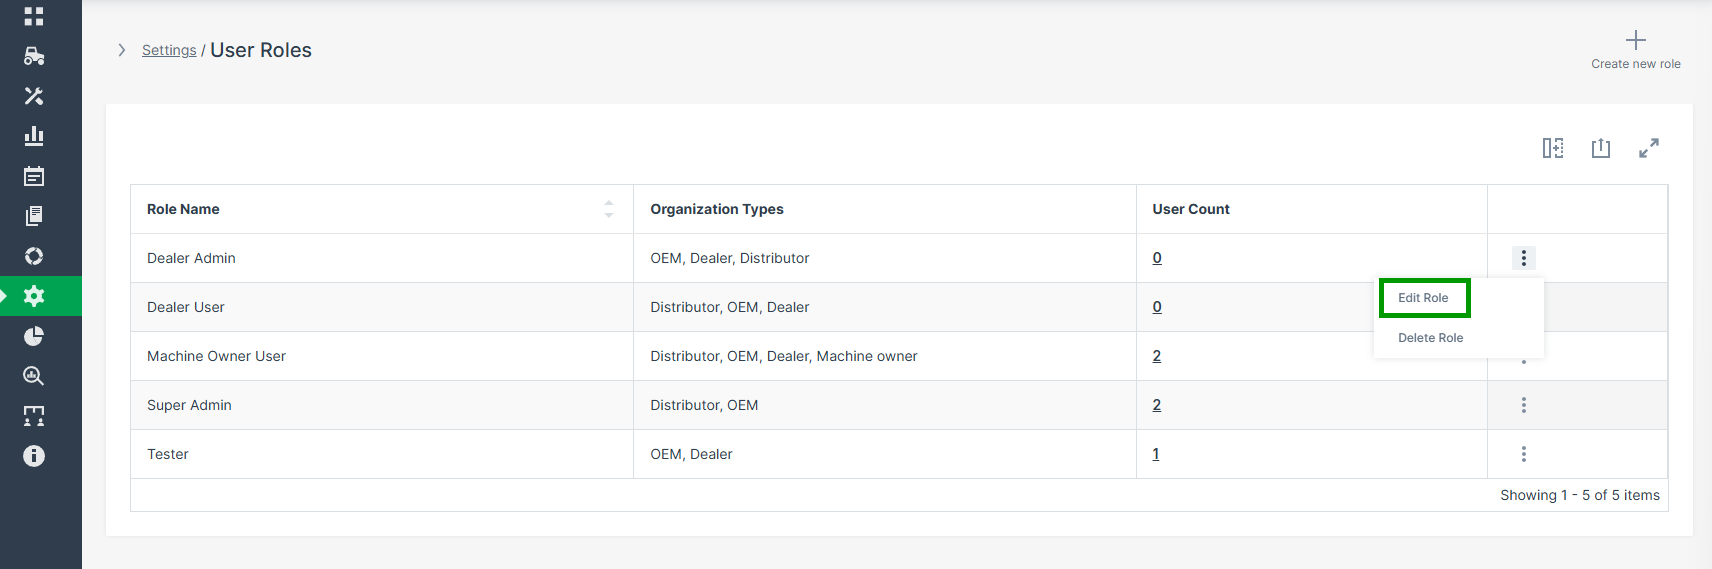
Figure 5: Edit User Role -
Adjust the role information and permissions as needed.
- Use the same permission assignment logic as described under Create User Roles.
- Click Submit to save your changes. A confirmation message appears: Role successfully updated!
Assigning User Roles
To assign a predefined user role, proceed as follows:
-
Navigate to Settings > Administration > Organization Structure > Users. Open the 3-dots menu ⋮ at the end of a user and select Details.
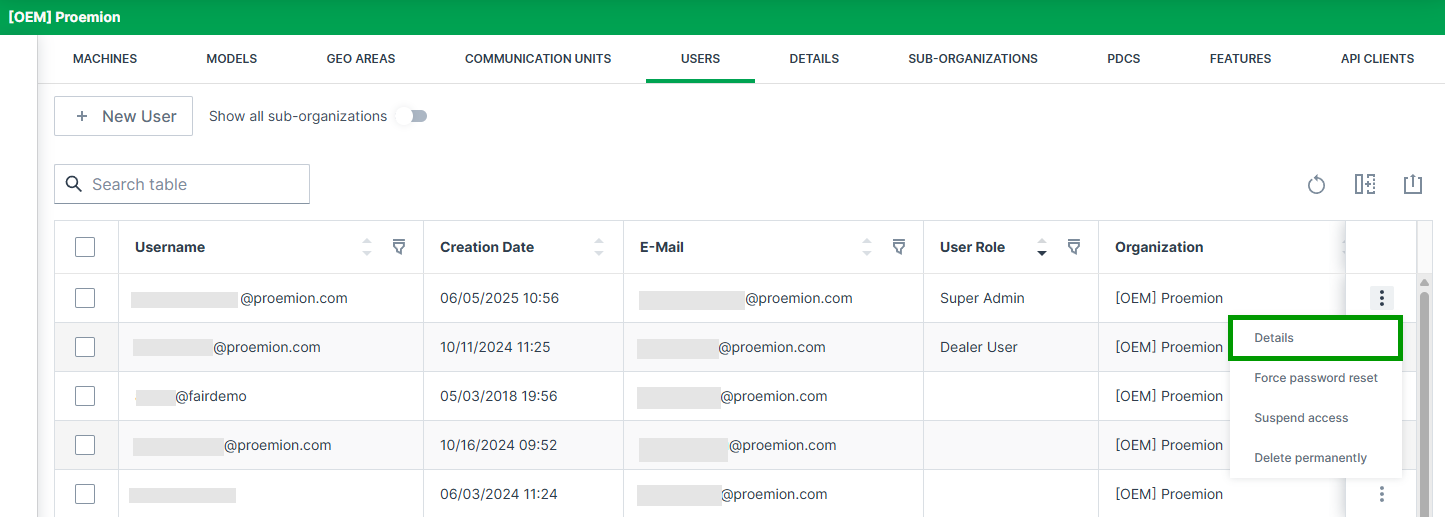
Figure 6: Details User Roles -
Click Permissions in the top right corner. The checkmark turns green to indicate that edit mode is active.
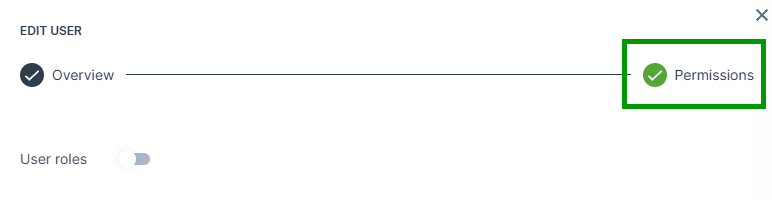
Figure 7: Permissions Button User Roles -
Active the User roles toggle. The User role dropdown menu appears.
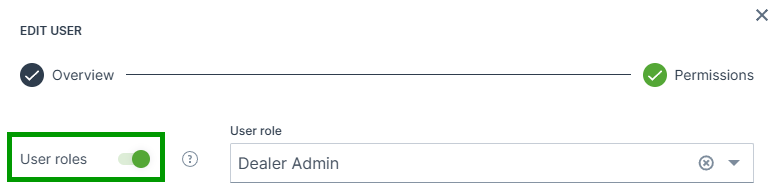
Figure 8: Toggle User Roles -
Open the User role dropdown menu and select a role from the list.
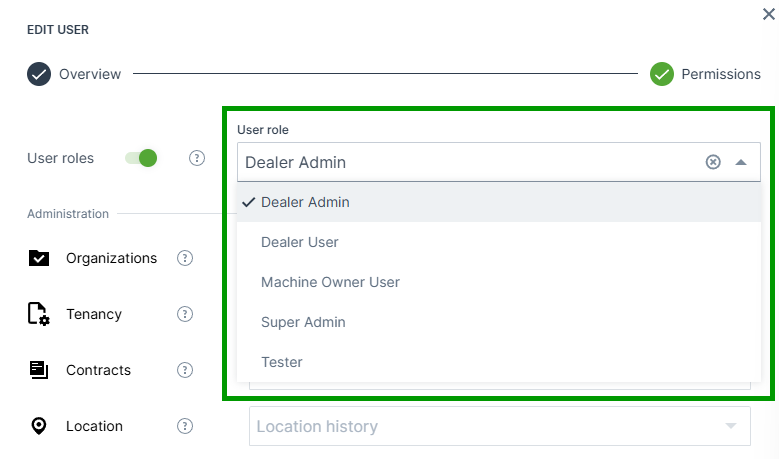
Figure 9: Dropdown Menu User Roles -
Click the Submit button to save your changes.
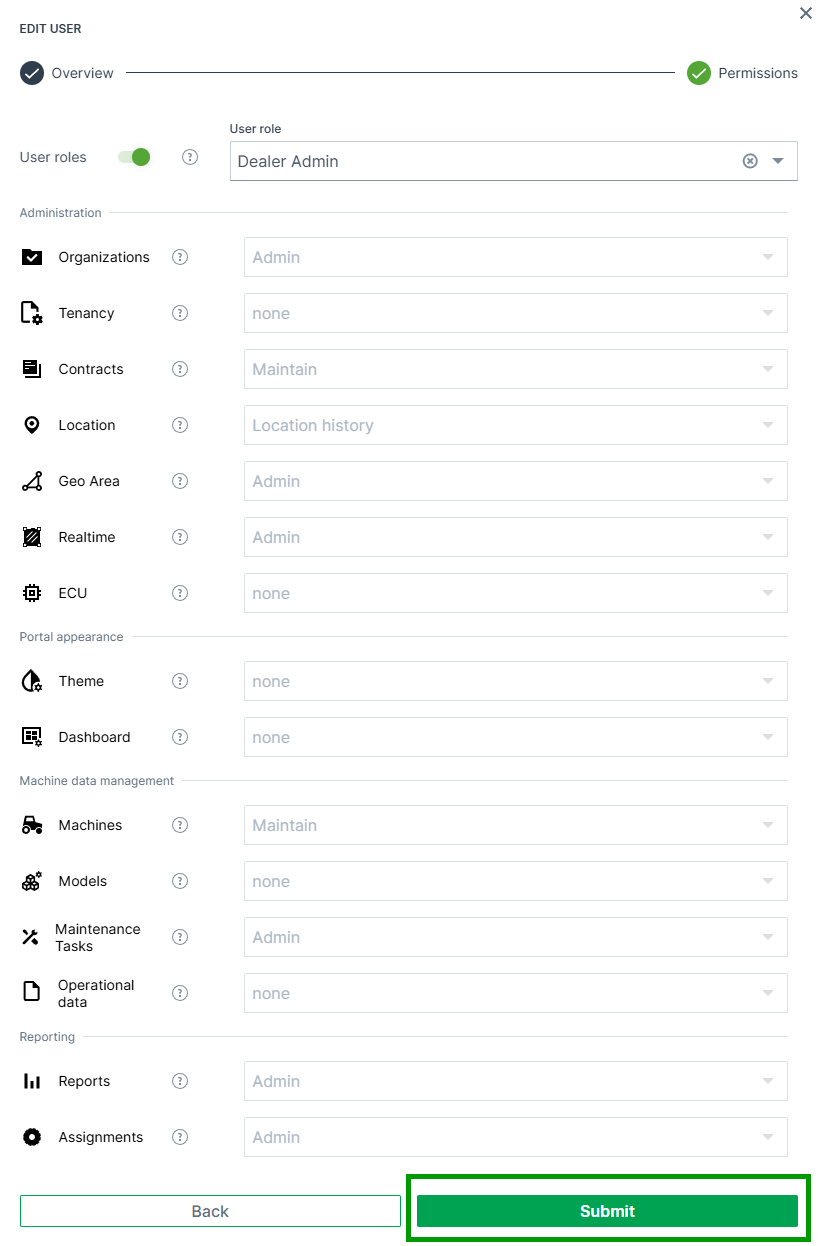
Figure 10: Submit Button User Roles
Machine Contracts
The DataPortal allows a user with the Contract:Maintain permission set an overview of the contracts and the current status for their machines. When a machine/communication unit (CU) is activated, the tariff is then selected and a contract is created. When the machine changes ownership from the OEM to the machine owner, the contract typically remains with the OEM. Each CU has a single contract. For information on the availability of the Proemion tariffs for each country, see Cellular Dataplan.
To view the contracts, open Settings > Administration > Contract.
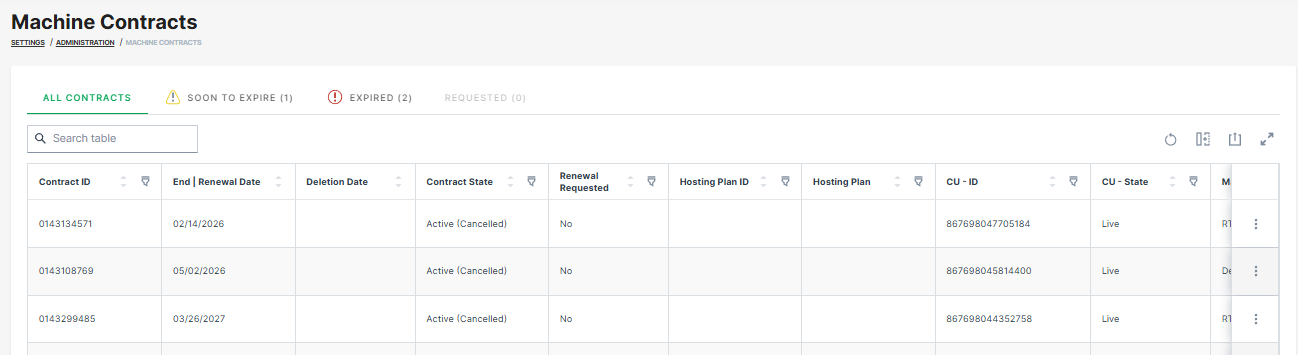
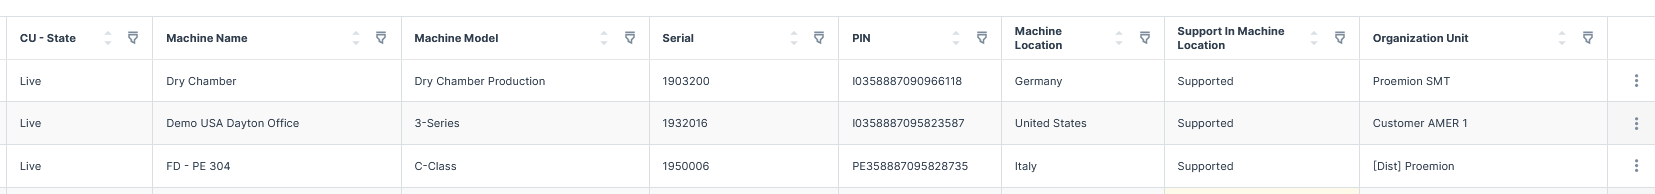
You may search, sort or filter by the following items.
| Item | Description |
|---|---|
| Contract ID | The identification number of the communication unit's hosting contract. |
| Your Internal Reference Number | Your order/purchase number for internal reference (the internal reference number can be assigned during Go Live). |
| Contract start date | Shows the date when the contract was started. |
| End date / Renewal date | Shows the reference date when the hosting contract will be renewed (in case of a manual Contract Renewal by the user) or terminated in compliance with a period of notice (in case of State = active (cancelled)). |
| Activation Date | Shows the date when the device was activated. |
| Deletion date | Shows the date planned for deleting a terminated machine. |
| Contract State | Shows the current state of the contract. |
| NOTE: Machines with terminated contracts will be removed from the portal after 3 months, i.e. the historic machine and CU data will be then deleted. | |
| For more information on the different states, see Contract State and CU State. | |
| Renewal requested | Indicates if a user requested a renewal. Only if the feature has been activated. |
| Hosting Plan | The identification number of the hosting plan. |
| Hosting Plan Description | The name/description of hosting plan, e.g. "PE DataPlatform Hosting 50 GlobalLight+". |
| CU - ID | The identification number of the communication unit. |
| CU - State | The state of the communication unit. |
| For more information on the different states, see Contract State and CU State. | |
| Machine Name | The identification of the machine. |
| Machine Model | The name/identification of the model. |
| Serial | The unique, identifying number or group of numbers and letters assigned to the machine. |
| PIN | The Part Identification Number of the machine. |
| Machine Location | The current location (country) of the machine. |
| Support in Machine Location | Shows whether the (planned) machine location is supported by the current hosting plan, i.e. whether the country the machine is or will be located in is covered by the hosting plan. The supported country can already be checked in the Go Live menu. |
| Possible values: | |
| - "Supported": The current machine location is supported by the hosting plan. | |
| - "Not Supported": The current machine location is not supported by the hosting plan. | |
| - "Unknown machine location": The location of the machine is not known. | |
| Organization Unit | The organization unit the machine is assigned to. |
Contract Details
To view a single contract, at the end of each row, select ![]() to open the drop-down menu and select the Contract Details. The Contract Details window looks as follows.
to open the drop-down menu and select the Contract Details. The Contract Details window looks as follows.

The Contract Details, Communication Unit and Machine tabs may show additional information on the contract, see below.
| Item | Description |
|---|---|
| SIM traffic volume (used/limit)1 2 | Shows the used SIM traffic of the current month and the contract's limit. |
| Realtime traffic cases (used/limit) 1 | Shows the number of Realtime cases of the current month and the contract's limit. See also Realtime Cases by Contract |
| Active tariffs | Shows a list of the description of the active hosting tariffs, i.e. Hosting Plan. 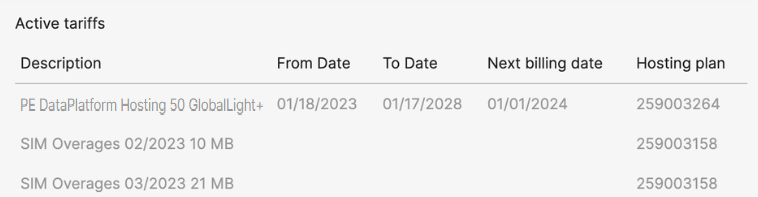 |
| Current SIM card ID | The identification of the SIM card currently used by the CU. |
| Provider | The network provider that was last used for communication by the CU. |
| Last Login | The last time the CU was connected to the DataPlatform. |
Contract State and CU State
The Contract State and CU State may have the following values.
The following Contract states are possible:
| Contract State | Description |
|---|---|
| testphase | Contract with future start date. CU is allowed to connect and send small amounts of data. |
| active | Contract is active. The CU is allowed to send data. All contracts with this state will be renewed automatically a specific time before the Renewal date. |
| active (cancelled) | Contract has a defined End date and will be terminated once this date is reached. The contract term can be extended by using the Contract Renewal function. |
| terminated | Contract has reached its End date and the CU is no longer allowed to connect. Please refer to chapter Reactivation for further details on how to reactivate a terminated device. |
Data retention and GDPR
Machine and communication unit (CU) data are retained for 3 months after contract termination. After contract termination, the contract state changes to terminated and the CU can no longer connect to the DataPlatform. You can reactivate the machine within this 3-month period, as long as it is still visible in your organization. If you reactivate the machine within this period, historical machine and CU data remain available. After 3 months, the machine is automatically removed from the DataPlatform. All historical machine and CU data are permanently deleted and cannot be recovered. Proemion does not retain customer data without a valid contract in order to comply with GDPR requirements.
The following CU states are possible:
| CU State | Description |
|---|---|
| created | CU/Machine exists in the Data Platform. It is ready for Provisioning. Note: Machines with this state may not be visible on your account. |
| provisioned | CU is visible on your account and ready for activation with Go Live. |
| Live | CU is activated and can send data. |
| terminated | CU is no longer allowed to connect. Please refer to chapter Reactivation for further details on how to reactivate a terminated device. |
| archived | CU and machine data have been wiped. Please refer to chapter Reactivation for further details on how to reactivate an archived device. |
| resiled | Machine data have been wiped from the CU. Please refer to chapter Reactivation for further details on how to reactivate a resiled device. |
Filters
Contracts that are "to expire soon" or "expired" or contract renewal "requested" are now listed as filters above the Contracts table.
You must have Contracts:View permissions to view these filters.
When filtering by those options, the contracts will be listed in the table accordingly. In the columns, you can view the machine name, organization unit and other data belonging to the contract, see above.
These filters are also useful for the Contract Renewal process, see below.
Realtime Cases by Contract
Note
A Realtime case is started by a Realtime diagnosis session, and includes all sessions in the subsequent 4 hours window.
The number of Realtime cases are only updated once a day.
Starting in summer 2025, the DataPortal starts to manage the number of Realtime cases based on machine hosting contracts and will enforce usage limitations:
While some machine-specific tariffs allow a predefined set number of Realtime cases per month, others completely restrict Realtime service.
The count and the number of allowed cases is displayed in the Contract Details:
After exceeding the included number of Realtime cases, no new Realtime diagnosis sessions can be established via tools like the Remote Service Tool, Proemion SoftGateway, PLUS+1 Service Tool, etc.
The data logging remains unaffected, i.e. devices can still go online and connect with the DataPlatform and transmit machine logged data (e.g. clf files).
Realtime sessions used by the Proemion Support team are not counted.
Consider that with newer firmware versions, particularly for the CANlink mobile 3600, the distinction between Realtime and Logging modes has been combined into an "Online" mode, which allows for both data logging and Realtime diagnostics simultaneously, see also CANlink mobile 3600 Online feature.
Add Additional Realtime Cases
You may request to add additional Realtime cases to the current month limit.
To do so, contact Service and Support.
Once the request has been confirmed, you will see a new row "Real Time Top Up [requested number] Cases" in the "Active tariffs" list, see image below, and the "Realtime traffic cases (used/limit)" number increases accordingly.
Contract Renewal
The contract renewal is available on "active (cancelled)" contracts with an end date in the future that is within the next 12 months. Terminated contracts cannot be renewed, but only re-activated, see Reactivation.
Users can either request the renewal; eligible users can directly renew the contracts on their own, see also the Requirements for the required user permissions.
When renewing the contract, both the contract ID and start date of the contract remain the same.
Note
Contracts that are not canceled will be automatically renewed.
Requirements
Users without permissions (e.g. at least Contract:Maintain permissions) can request the renewal of their expired or soon to expire contracts via the Machine Page.
The receiver of the request - usually the OEM or Dealer - can contact the requester, make an offer and renew the contract as described below in Contract Renewal.
The receiver must have the Contract:Maintain permissions - to renew both active canceled contracts and terminated contracts
Renew Contract
To manually renew a contract, proceed as follows:
- In the Contracts menu, select the option Renew Contract via the 3-dots icon by the end of the row :
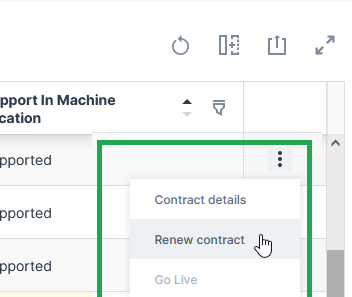
✓ The Renewal details page opens.
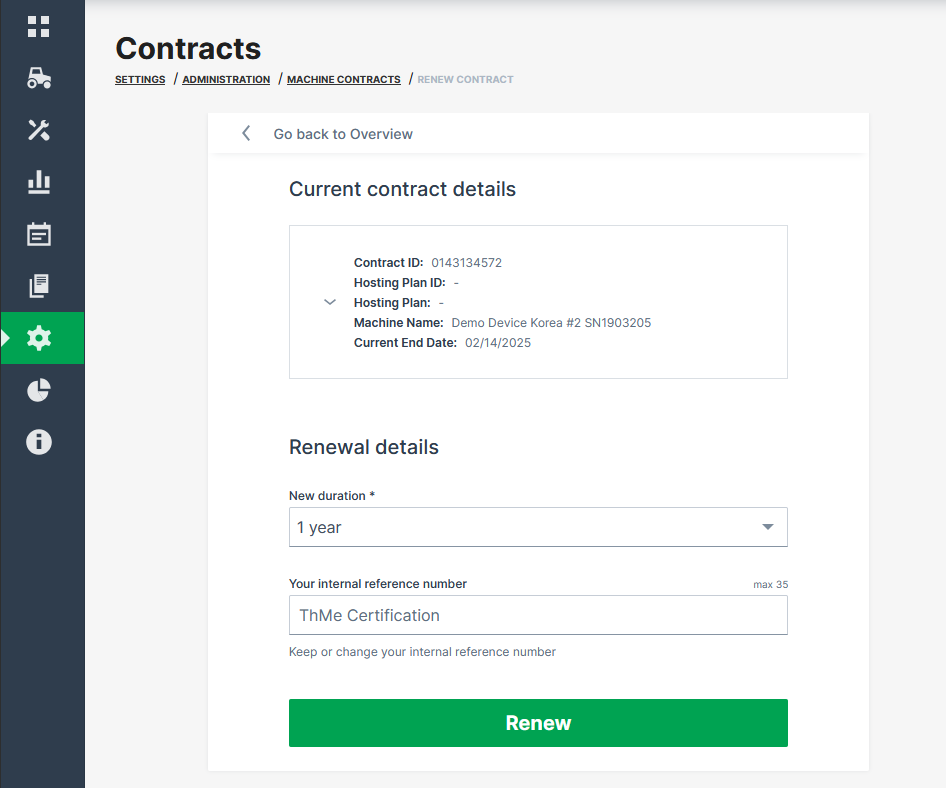
-
Select the New duration: 1 Year, 2 Years, 3 Years, 4 Years or 5 Years.
-
Enter a new Your internal reference number (maximum length of 35 characters) or just keep the existing one for later reference (this number can be assigned during Go Live). It is recommended to have a recurring reference number for easier reference of your machine/contract in your system, see Provision Machine Dialog.
-
Click Renew.
✓ The request for contract renewal is transmitted. ✓ You will receive an updated contract confirmation via email.
Note
With the contract renewal, the complete duration will be billed at once.
Contract End Notification
Users with contract permissions of organizations with the contract expiration feature enabled can subscribe to weekly contract notifications.
These notifications inform the user of all contracts that need attention because they are about to expire, have already expired or a customer has expressed interest in extending the contract.
CANlink® mobile light Upgrade
The concept of the CANlink® mobile light is described in the CANlink® mobile 3600 device manual, see CANlink® mobile light.
To upgrade the CANlink® mobile light to a standard device/hosting plan, proceed as follows:
- Go to the Contracts menu and open the Details of the according machine.
- In the Contract Details, select Upgrade, see also image in the Contract Details.
You have successfully requested the upgrade to the standard CANlink® mobile 3600 device with all the features offered and an independent hosting plan.
The request is displayed in the Contracts menu.
You may then subscribe to contract expiration email, see Subscribe to DataPortal Notifications.
-
The SIM traffic volume and the number of Realtime cases are only updated once a day. Due to technical restrictions, there might be some time shift of the displayed data usage and Realtime cases. ↩↩
-
Consider that the actual used SIM traffic volume will be displayed only after closing a session. Example: 5 MB are displayed in the DataPortal, but a message has been sent to the customer because the limit of 10 MB has been already reached during the yet open session. ↩
Platform Contracts
The Platform Contracts Page provides a unified interface where all customer-specific platform contracts are listed. It improves transparency by consolidating plan information, add-on modules (e.g. Mobile App, Datascience, DataPump Service etc.), pricing details and usage limits in one location inside the DataPortal.
To view all contracts of a Business Unit (BU):
- the Contract:Admin Permission Set is required.
- the BU must have a SAP customer number, see REST API.
Overview
Go to Settings > Administration > Platform Contracts to open the Platform Contracts page.
The screen below displays the details of an FDP (Fleet Diagnostics Package) contract within the Platform Contracts Page. It provides an overview of the contract metadata and shows current usage of the included diagnostic limits.
The following contract information is available:
- Contract Name
- Purchase Number
- Start Date
- End Date
- Price
These fields summarize the validity period and identification of the FDP contract.
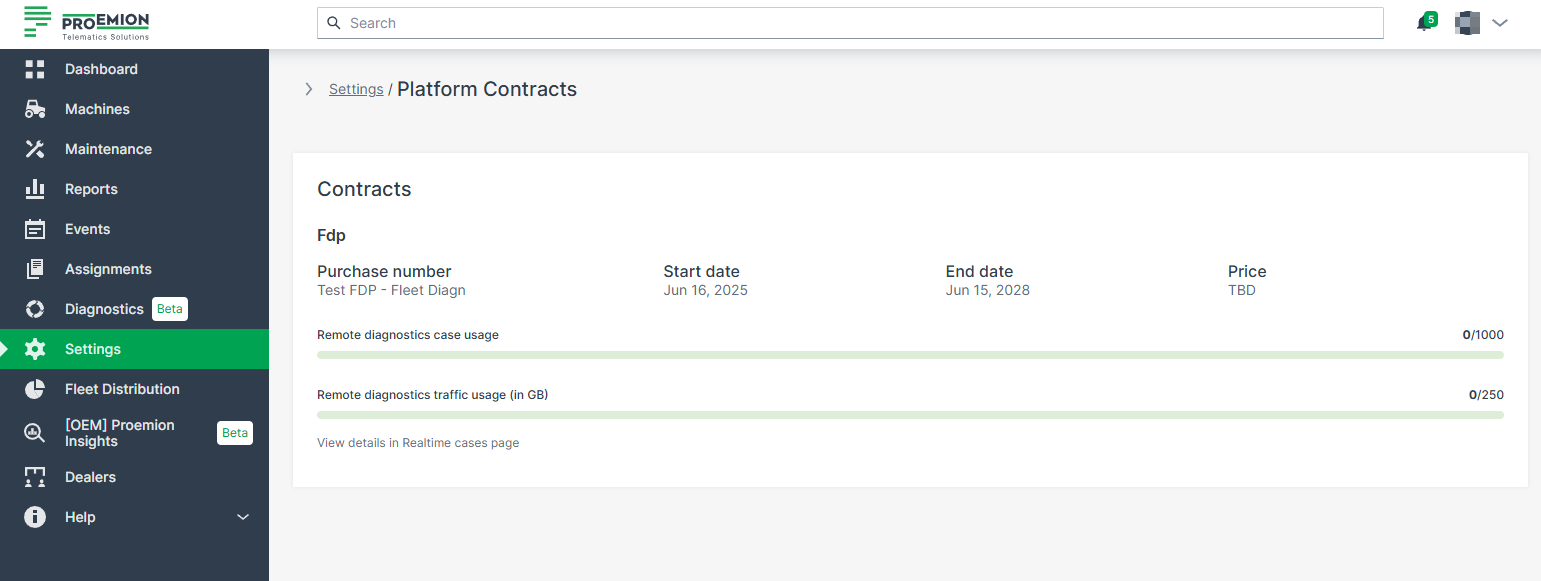
Fleet Diagnostic Package - Usage Information
Two usage bars provide insight into how much of the diagnostic resources have been consumed:
-
Remote diagnostics case usage: Displays how many remote diagnostic cases have been used out of the total available.
-
Remote diagnostics traffic usage (in GB): Shows the data traffic consumption for diagnostic transfers.
The number of available Diagnostic Cases — i.e., the remaining limit value — is updated once per day. However, the number of used Diagnostic Cases is updated immediately when a new case is started. Diagnosis sessions initiated by the Proemion Support team do not count against your contract quota. Only Diagnostic Cases of the last 24 month can be displayed.
Portal Appearance
Themes
As an Administrator, you can customize the theme (logo, color scheme, title, etc.) of your organization in the DataPortal
To do so, select Settings > Portal Appearance > Theme
The Themes customization page opens where you can adapt the design for different sections and elements of the DataPortal:
Browser Title Bar
In the following sections, the brand name and the favicon are defined which should then be displayed on the webpage tab.
Design
In the following section, adapt the primary, accent and header colors for your brand and the map style.
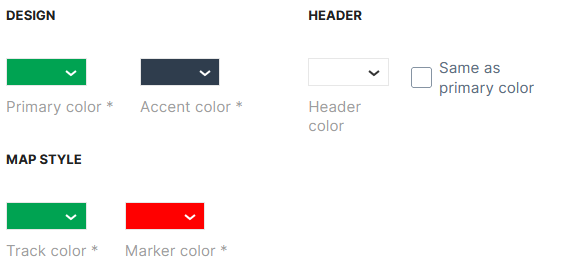
-
Primary color applies to selected menus and hovering over menus in the main menu on the left side, see example with red color:
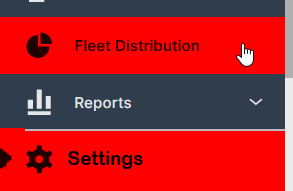
Figure 4: Primary Color - red color example -
Accent color applies to the background of the main menu, see example with red color:
Figure 5: Accent Color - red color example -
Header color applies to the header of the DataPortal, see example with red color:

Figure 6: Header Color - red color example 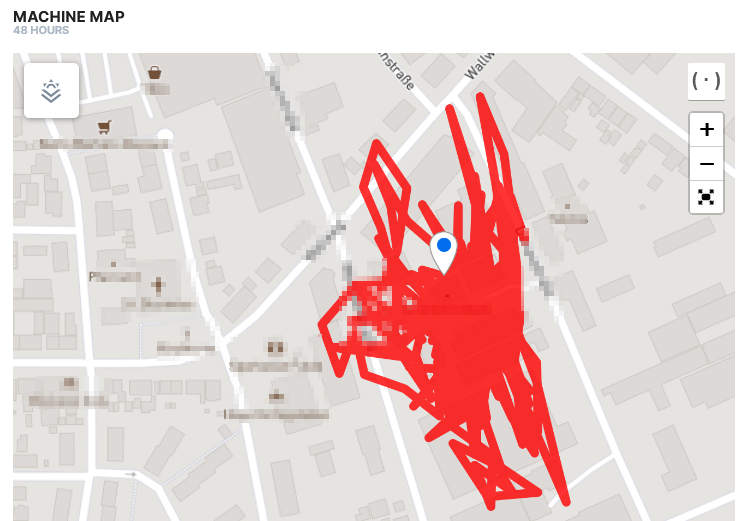
Figure 7: Map Track Color - red color example 
Figure 8: Map Marker Color - red color example
Logo
In the following section the company logo is defined, which will be displayed in the upper left corner of the DataPortal.
Machine icon
In the following section, the machine icon is defined
The machine icon is displayed in the main menu next to Machines menu.
Login Page
In this area the copyright notice, image and footer links for the Login Page are defined.
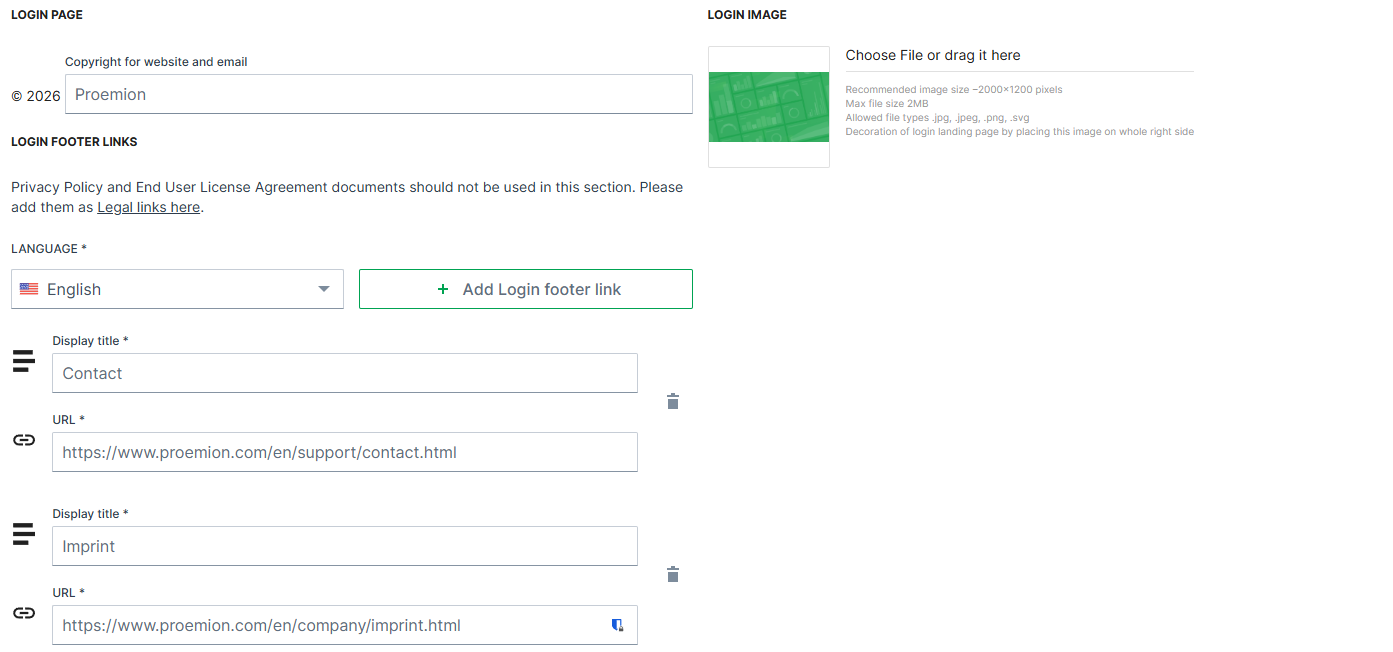
| Item | Description |
|---|---|
| Copyright | Defines the text displayed in the copyright notice in the footer of the Login Page and in system-generated emails. The company name can be customized. The year is automatically generated by the system and cannot be modified. |
| Footer links | Add static links and display text (100 character maximum) to the page footer. These links can point to external resources such as company websites or support pages. They are part of the customizable branding configuration and are not related to the sign-out process. |
| Login image | Upload your own image to the standard DataPortal Login Page. |
For more information, see Sign in to the DataPortal.
Behavior Options
The Behavior options allow you to customize the user experience in the Machines Overview.
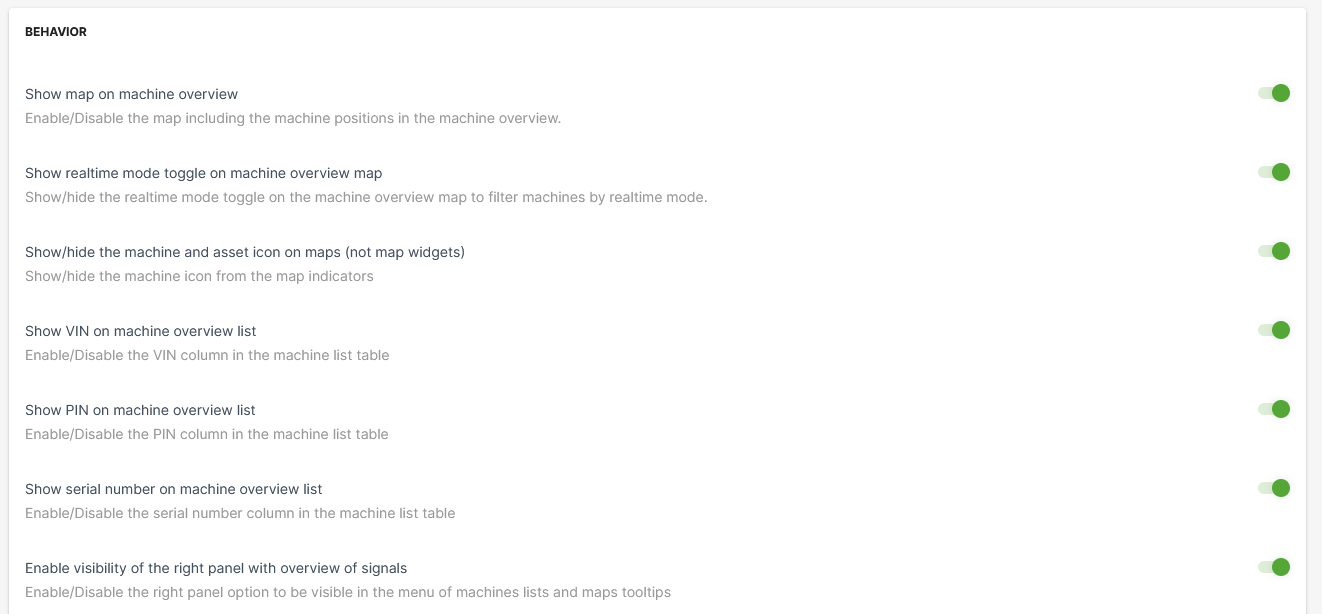
| Item | Description |
|---|---|
| Show map on machine overview | Show the map in the Machines Overview. |
| Show realtime mode toggle on machine overview map | This option allows the user to filter machines by their operating mode on maps. |
| Show/hide the machine and asset icon on maps (not map widgets) | By disabling this option, the asset icons are not displayed, instead only a map icon is displayed, see following example: toggle on (default): toggle off ("hide asset icon"): |
| Show VIN or machine overview list | Include a column with the Vehicle Identification Number (VIN) in the list of machines. |
| Show PIN on machine overview list | Include a column with Personal Identification Number (PIN) in the list of machines. |
| Show serial number on machine overview list | Show the serial number column in the list of machines. |
| Enable visibility of the right panel with the overview of signals | Signal Overview Panel appears when selecting a machine from the machine list or on the map. |
Custom Menu Entries
The DataPortal allows you to add menu categories to the main menu with URL links provided in the panel on the left side.
To add a menu category with menu links to your DataPortal menu, go to Themes > Menu section and proceed as follows:
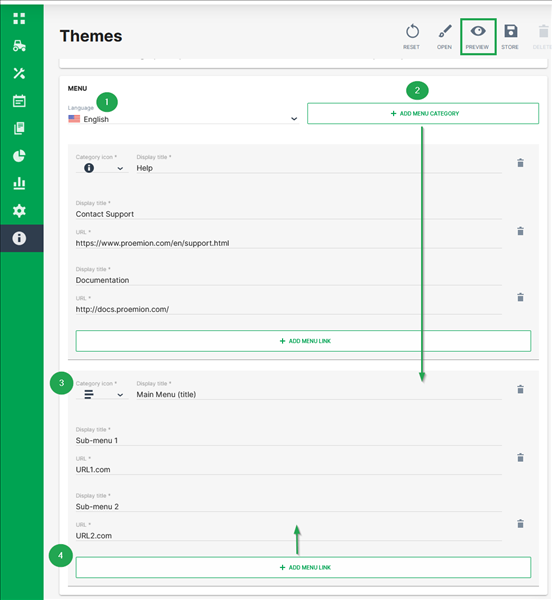
-
Select the language of the DataPortal you want to add the new menu category for.
-
Click +Add Menu Category
The section for menu category opens. -
Select a Category icon and add the Display title that will be used as the header of the drop-down-menu in the panel.
-
To add sub-menus, click Add menu link.
-
Add the Display title and provide the URL for the clickable sub-menus
You may add as many menu links as desired. -
To create a preview of your custom menu entries, click Preview in the upper-right corner. The preview is shown in the same window and can be stopped by selecting Finish preview.
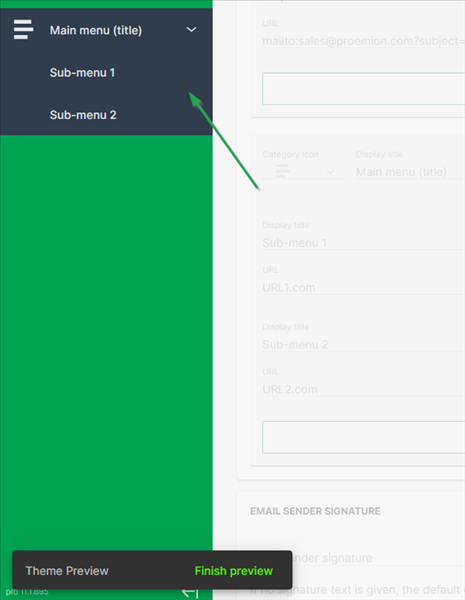
Figure 14: Custom Menu Preview -
To save your changes, click Store in the upper right corner.
Custom DataPortal Email Sender Signature
You can customize the signature text in all email communication sent from the DataPortal. In the Themes area, scroll to the bottom of the page until you see the headline/field Email Sender Signature.

Simply enter the text you want to appear in all of your DataPortal emails and save your changes.
Dashboard Page Layout
The Dashboard Page Layout is the central place for configuring the Organization Dashboard, so-called "Home Dashboard", and its layout of widgets.
The Organization Dashboard is displayed upon entering the DataPortal and is bound to an Organization Type.
When activated, the Dashboard Page Layout menu is to be found in Settings > Portal Appearance > Dashboard Page Layout.
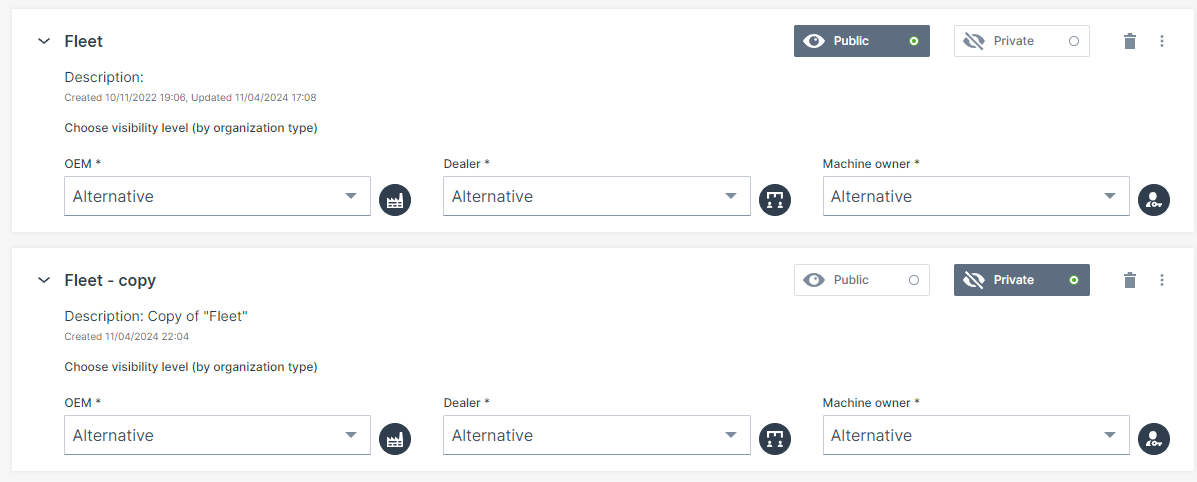
Consider also the following difference:
Next to the "Dashboard Page Layout" menu, there is alo the Machine Page Layout for the Machine Page and is bound to a model and Organization Type.
Requirements
- Activate the Feature Switch for Dashboard Page Layout to enable the Dashboard Page Layout menu.
- The permission to edit and (pre)view the layouts is Dashboard:Admin, see Dashboard Subject.
- This permission can be only granted to users within tenant organization and of Organization Type "OEM" or above.
- Organizations must have a Organization Type assigned.
Consider that each organization type must have configured at most a single default home dashboard. As a dashboard admin you will get notified in case a organization type within the scope of your tenant organization is missing a home dashboard. Via icons, you can also identify which layouts are not bound to an organization type, see Visibility Level/Binding
Layout Visibility
The Layout Visibility specifies if the layout is visible to the organizations and which organization type is allowed to view the layout on the dashboard.
To change the visibility, select the desired layout and click the Edit Layout button.
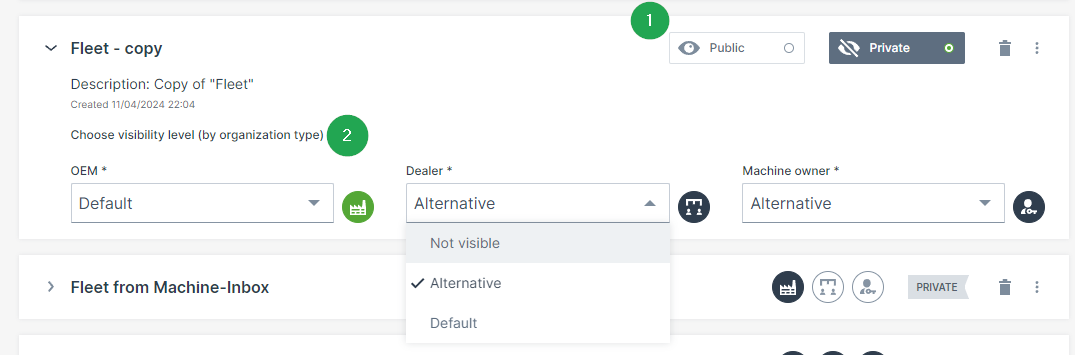
Visibility
Specify the visibility of that layout:
Public: The layout is available for every organization that is allowed to use it.
Private: The layout is only visible to administrators.
This is useful when drafting the layout.
Visibility level/Binding
Specify which the organization type is allowed to view the public layout:
- OEM
- Dealer
- Machine Owner
Specify how the organization type is allowed to view the public layout:
- Default view - layout is available for the organization type and is selected automatically as the first view when opening the Dashboard.
Note
When an organization unit is added to the DataPortal, it will be assigned a default layout.
- Alternative - layout can be selected on the Dashboard via Dashboard Page Layout drop-down menu.
- Not visible - layout is not available.
When the visibility level is set for each organization type (OEM, dealer, machine owner), you can identify the visibility and binding of each layout by the icons:
- Bound to all organization types and public.
- Not bound to any organization type and private.
- Bound only to organization type "Dealers" and private.
Edit Layout
You edit layouts by adding widgets that show the data.
Note
Note that you can't change the assigned layout but only the original one.
Consider that there is also the option to Duplicate Layout where you can adapt the copied layout and/or its widgets.
The "create/edit" view can be accessed as follows:
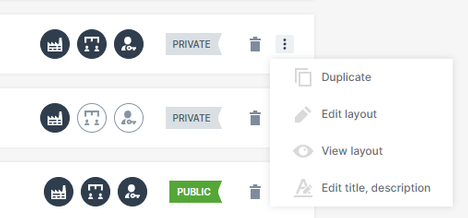
The layout opens in edit mode with the configuration pane on the right side. There, you can add widgets.
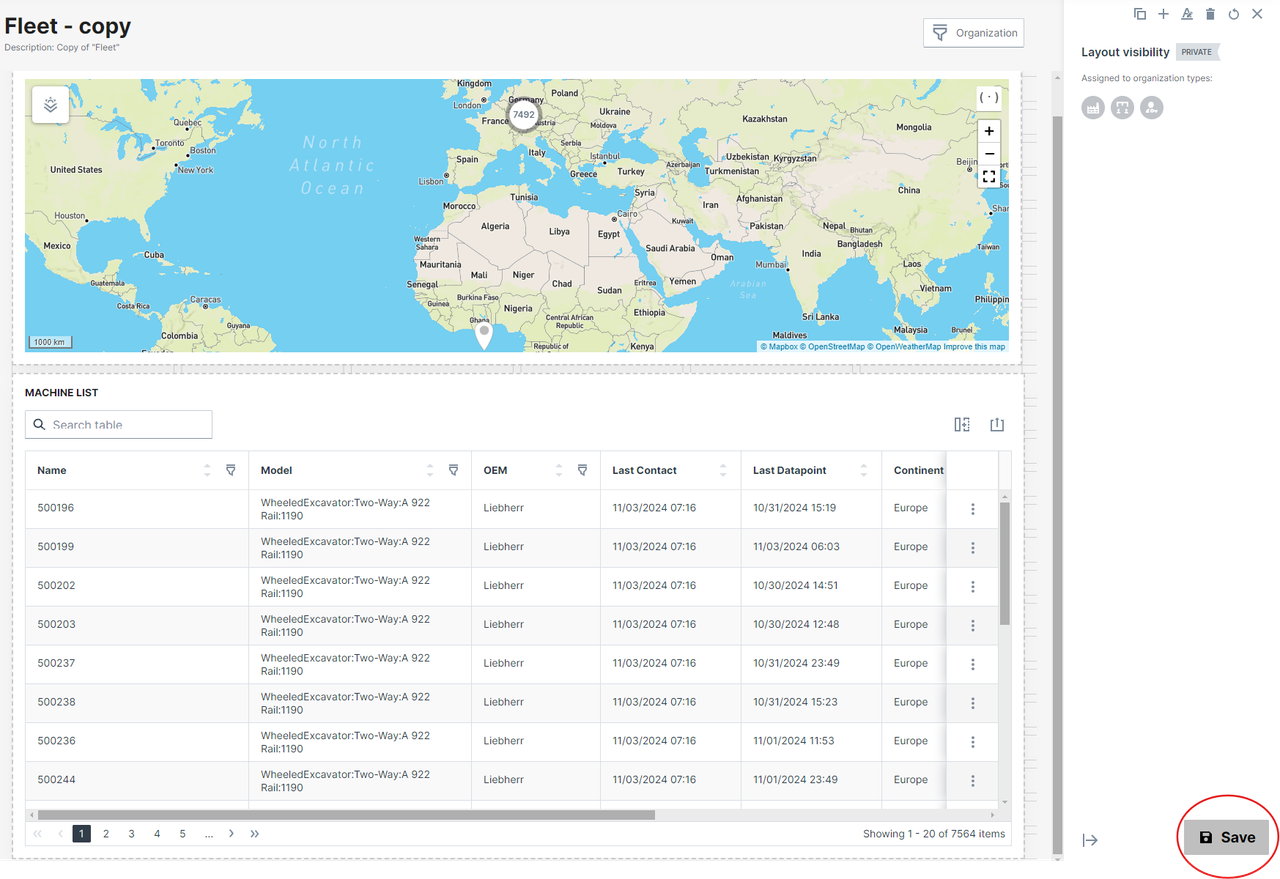
Note
When an organization type is not allowed to view a layout, only the Master Data widget is automatically shown to users when opening the Dashboard.
Note that the Master Data widget is also displayed in case of deleting all layouts assigned to an organization type, see Delete Layout.
Add Widget
Note
Note that there is also the Tab Container widget for organizing the widgets in groups.
Read in the Widget Catalog for a detailed description of each widget's configuration.
To add a widget, proceed as follows.
- To add a widget, select the add icon to open the widgets dialog with widgets listed from the Widget Catalog.
- Select and configure the widget as described in each widget.
- Once you have completed configuring the widget, save your settings. You can also see a Preview Layout.
Resize Widget
While or after adding the widgets, you can resize or move them by drag-and-drop onto a grid that makes the most efficient use of space.
This is useful, because the display of widget information varies widely, from a single symbol to comprehensive graphs.
Proceed as follows:
- When editing the widget layout, the boundaries for a particular widget are shown as table cells within a broken line boundary.
- Each widget type has a minimum size
- There is a shadow under the widget that displays the footprint the widget will take up once you release the resize indicator. If you resize the widget over another widget it will shift to the next available space on the dashboard.
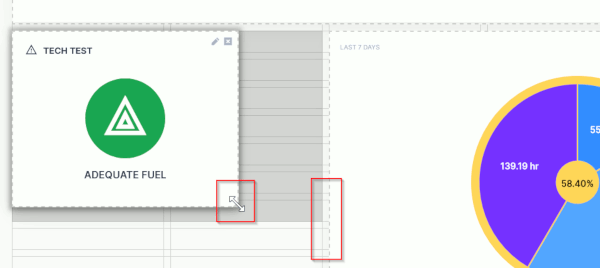
Preview Layout
You can view the layout of the widgets in a preview. Note that you can only see a preview when the layout has been assigned to an organization.
The View Layout can be accessed as follows:
In the preview mode, you have the following options:
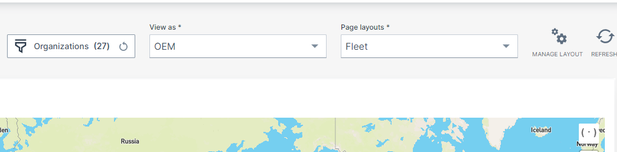
-
View as a different organization type to see how users view the Dashboard.
-
Change between the Page layouts assigned to this machine model. You can also select private layouts for the preview.
Duplicate/Create Layout
You can copy the layout of a dashboard to use it as a basis for a new layout, see Edit Layout. Note that also the layout's widgets and their configuration like bindings will be copied, too.
A duplicated dashboard and its bindings are private. As a result, the new layout will be applied to the same organization types as the original layout, but it won't be visible to users.
If the original layout was the default layout for some organization type, the original layout will remain as such and the new layout will always be an alternative layout.
To duplicate a layout, proceed as follows:
The layout has been now duplicated and in the layout name "copy" has been added to distinguish it from the original layout.
Consider to add a layout description to each layout via Edit title, description (can only be seen by the administrator) as the layouts can have the same name.
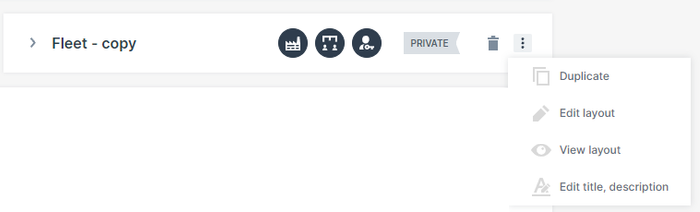
Delete Layout
In the Dashboard Page Layout, you can delete layouts completely from the Dashboard Page Layout or remove only the binding to the model.
Warning
Deleting a layout will delete it for all organizations using it. Make sure it is unused (see Visibility Level/Binding before deleting it.
Consider the following when removing or deleting a layout that is in use by an organization:
- When the layout was the main layout for the organization, the organization's secondary layout becomes the main layout.
- When no other layout exists for the organization, basic information (which is the <
> widget) will be shown to the users.
To delete a layout completely, click the delete icon displayed next to the Visibility icons:

To remove the binding, proceed as described in Visibility level/Binding.
Machine Page Layout
The Machine Page Layout is the central place for configuring all Model Dashboards and configuring their layout of widgets.
When activated, the Machine Page Layout menu is to be found in Settings > Portal Appearance > Machine Page Layout.
A Machine Page inherits the layout of widgets from the Model Dashboard. Therefore, in the Machine Page Layout menu you should proceed as follows:
-
Manage Binding: bind the existing layouts to the models.
-
Layout Visibility: manage which organization type can view this layout per model.
-
Create Layout: create a new layout or including widgets for the dashboard, resp. Machine Page. You may also Duplicate Layout to adapt an existing layout and assign it to models.
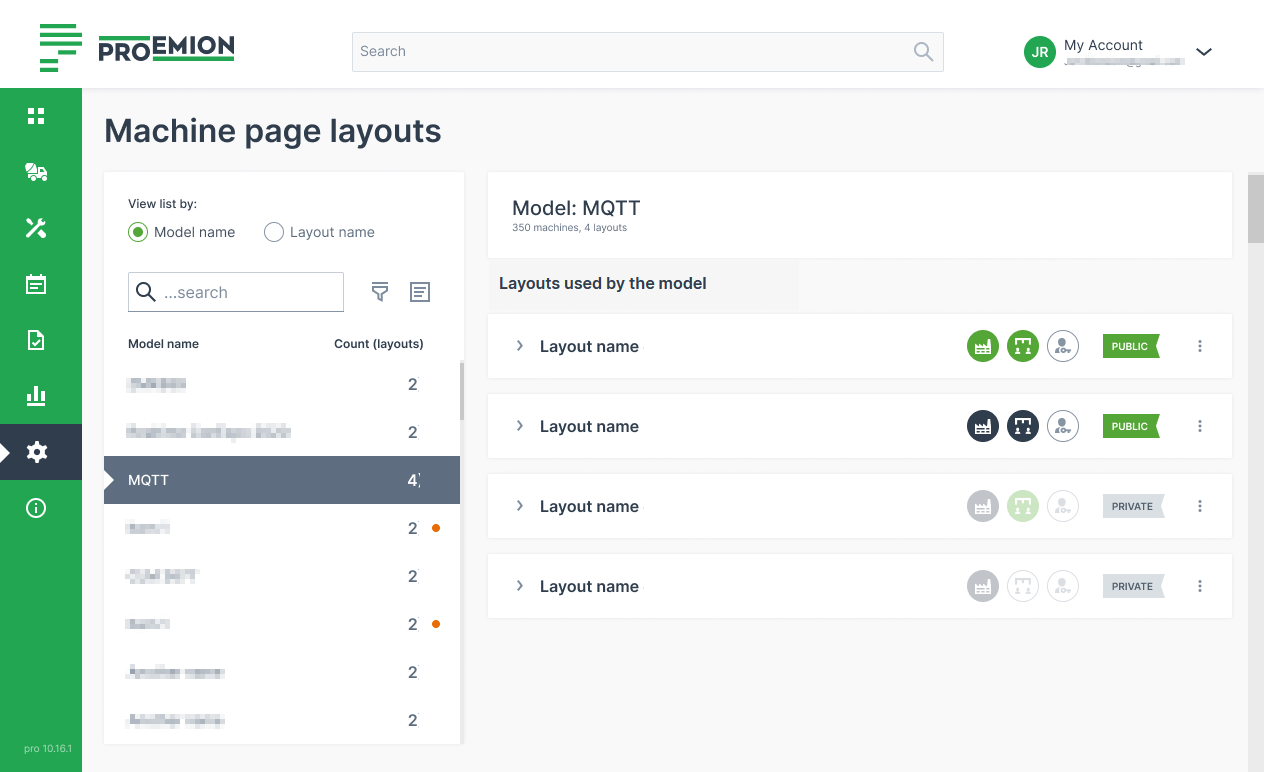
Consider also the following differences:
-
The Machine Page is the dashboard for machines and is bound to a model and Organization Type. Thus, subsequently added organization units of that type will inherit layouts.
-
The Organization Dashboard is displayed upon entering the DataPortal and is bound to an Organization Unit. Note that there is also the "Dashboard Page Layout" menu to Add Widgets to the Organization Dashboard.
Requirements
-
Activate the Feature Switch for Machine Page by Org Type to enable the Machine Page Layout menu.
-
Activate the following permissions:
-
The permission to edit the layouts is Dashboard:Admin, see Dashboard Subject. This permission can be only granted to users within tenant organization and of Organization Type "OEM".
-
The permission to view the layouts is Machine:View, see Machine permissions; the users can see the layouts available for their models in the Machine Page Layout.
-
-
Organizations must have the Organization Type assigned.
Machine Page Layout Views
The Machine Page Layout menu offers two views:
| View List by Model Name | View List by Layout Name |
|---|---|
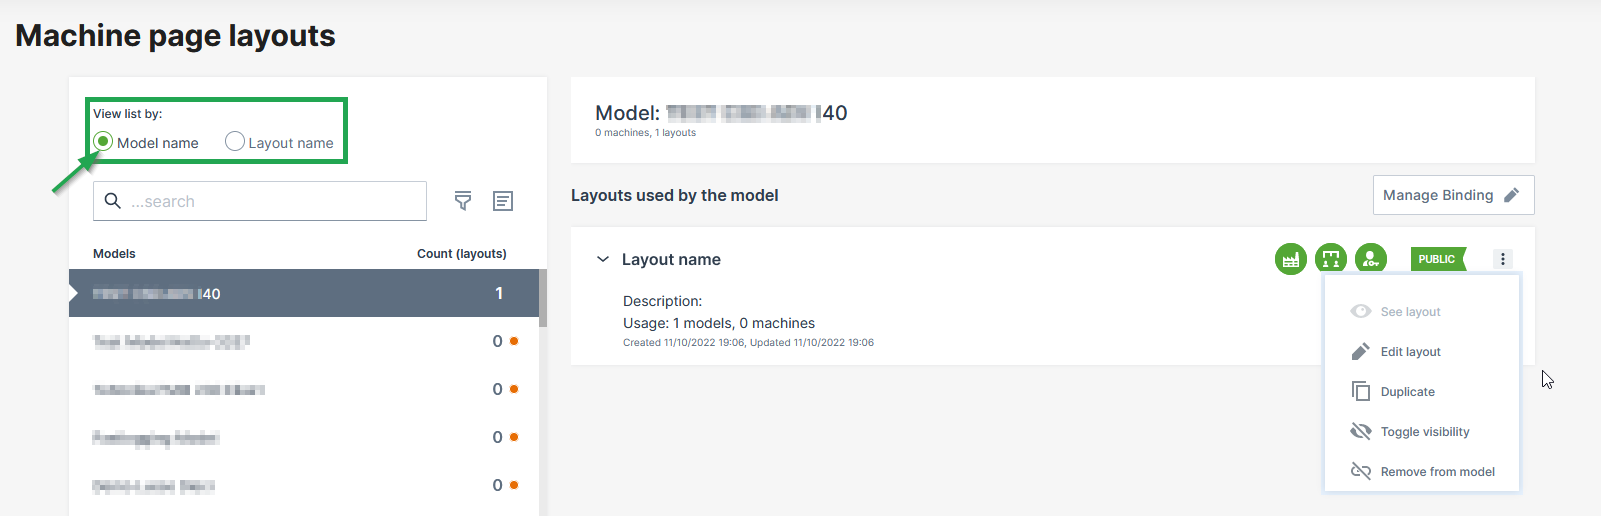 |
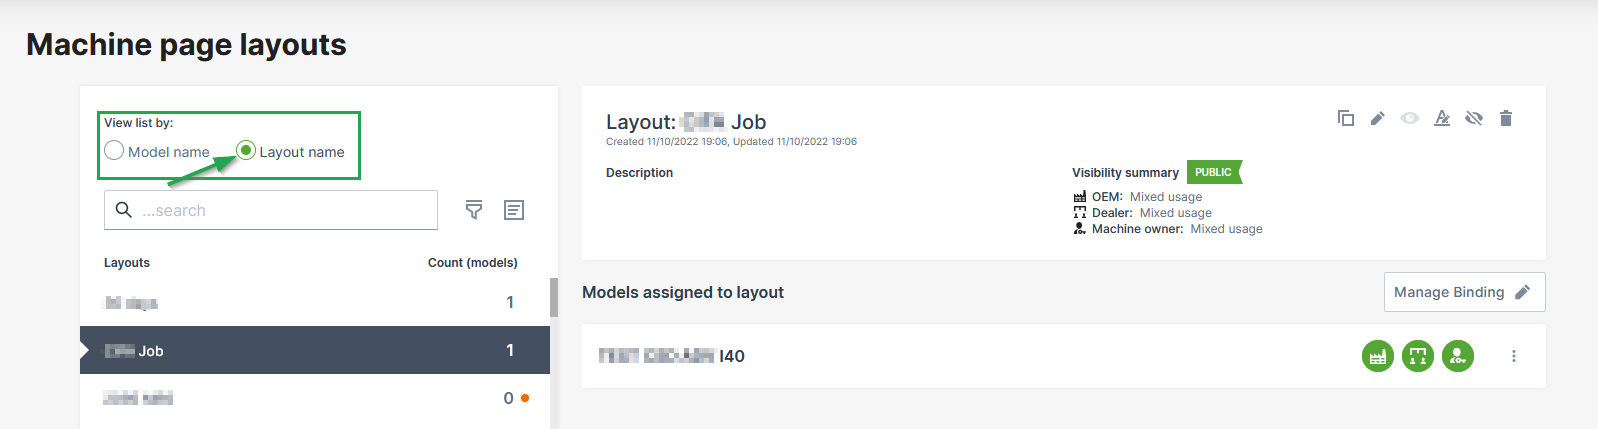 |
| Is selected by default. | You can change to the "List view by the Layout names" via the View list by button. |
| The number of assigned layouts is shown by the end of each line. | The number of assigned models is shown by the end of each line. |
| When selecting a model, the list of "Layouts used by the model" is displayed on the right. | When selecting a layout, the list of "Models assigned to layout" is displayed on the right. |
In case no layout has been assigned to the model yet, the count is 0 and a red dot is shown next to it. |
In case the selected layout hasn't been assigned to a model yet, the count is 0 and a red dot is shown next to it. |
| You can open Manage Binding+ to assign layouts to that model, resp. models to the layout, see Manage Binding. | |
| Different icons show the level of visibility for each organization type. | A Visibility summary shows the assigned visibility level for each organization type. "Mixed usage" is displayed in case a layout is assigned to different models with each different visibility levels for that organization type. |
When selecting a layout, the configuration options are displayed via the drop-down menu: 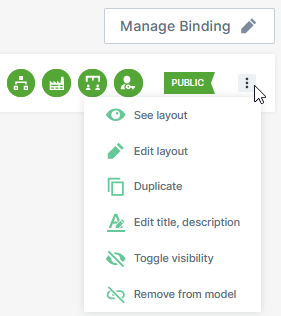 |
When selecting a layout, the configuration options are displayed in the upper right corner: 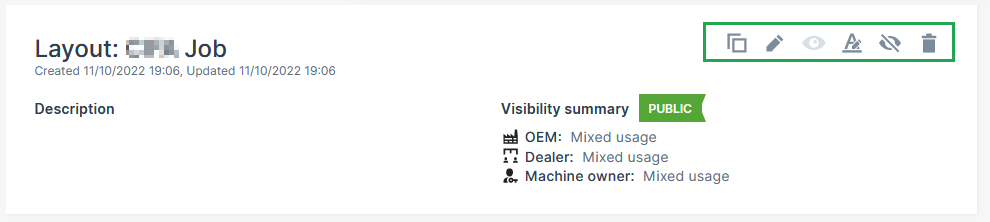 |
The following configuration options are available in both views.
 Preview Layout View the current layout (or preview while editing before publishing the layout).
  Manage Binding You can assign layouts to other models, resp. assign models to layouts. Add/adapt the title of the widget that will be displayed in the layout.
  Duplicate Layout Use the current layout as a basis for new one.
 Layout Visibility Adapt which organization types and are allowed to view the layout. For each organization type and visibility, different icons are shown.
  Delete Layout Remove the layout for a model. You can also delete a layout completely.
  Machine Page Edit the title and add a description. This option is only available via Machine Page > Manage Layout.
  Machine Page Show the not publicly available layouts for the machine model. This option is only available via Machine Page > Manage Layout.
 - In the Machine Page, the configuration options are to be found in the upper-right corner of the selected Machine Page > Manage Layout:
Manage Binding
To manage the binding, means to assign an existing layout to a model (or models to layouts). You may also Duplicate Layout before assigning it to model in order to adapt the layout for the specific model(s). Consider to adapt the Layout Visibility.
In the Machine Page Layout, select the layout and click the Manage Binding button.
Depending on the selected view, you can assign the layouts to the model, or you can assign the models to the layout, see also Machine Page Layout Views for a comparison of the views.
-
In the view List by Model Name, the following page opens.
In the Layouts drop-down menu, select the desired layouts (from other models) that you want to assign to the selected model.
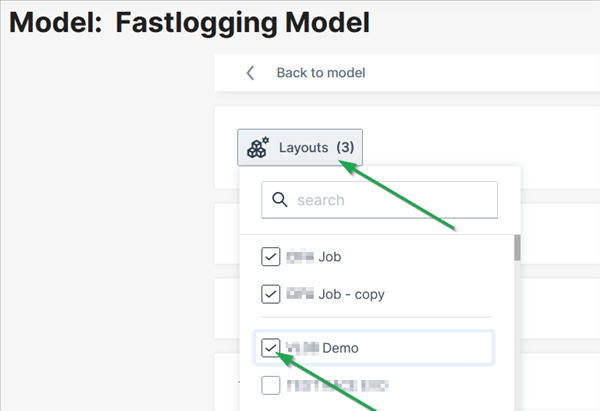
Figure 2: Assign Layouts to Model -
In the view List by Layout Name, the following page opens.
In the Models drop-down menu, select the desired models that you want to assign to the selected layout.
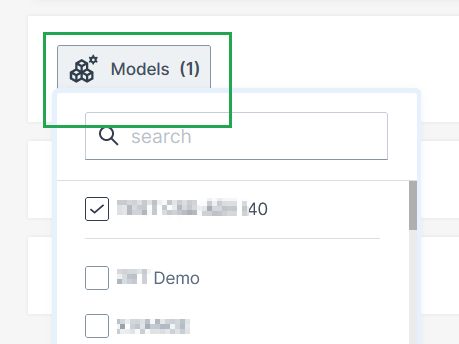
Figure 3: Assign Models to Layout
Layout Visibility
The Layout Visibility specifies if the layout is visible to the organizations and which organization type is allowed to view the layout on the dashboard.
Note
Only when the layout is assigned to a model, you may adapt the visibility, see Manage Binding.
To change the visibility, select the desired layout and click the Edit Layout button. The Edit Layout button is located differently depending on the view, see Machine Page Layout Views for a comparison of the views. Alternatively, you can change the visibility directly in the Machine Page; select Manage Layout > Manage visibility for organizations.
In all cases, proceed as follows:
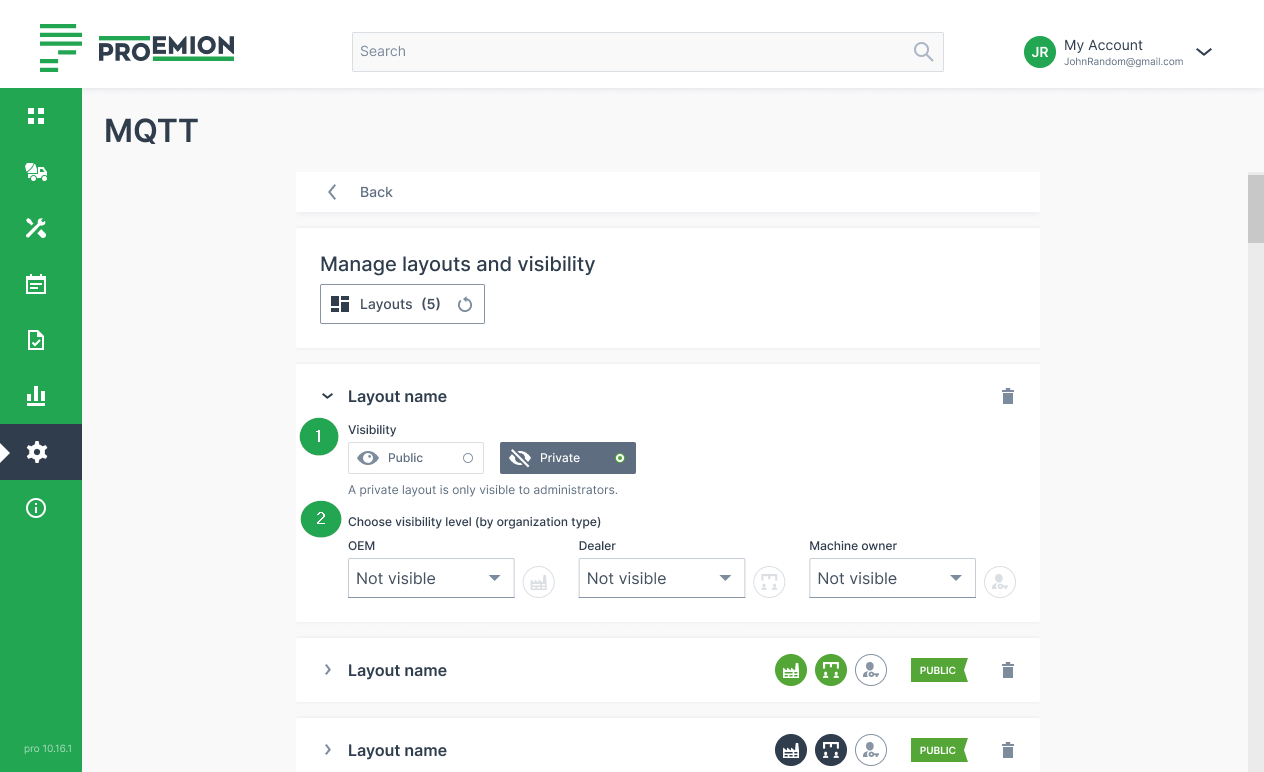
| # | Item | Description |
|---|---|---|
| 1 | Visibility | Specify the visibility of that layout |
| - Public: The layout is available for every organization that is allowed to use it. | ||
| - Private: The layout is only visible to the administrator. This is useful when drafting the layout. | ||
| 2 | Visibility level | Specify which the organization type is allowed to view the public layout: |
| - OEM | ||
| - Dealer | ||
| - Machine Owner | ||
| Specify how the organization type is allowed to view the public layout: | ||
| - Default view - layout is available for the organization type and is selected automatically as the first view when opening the Machine Page. | ||
| - Alternative - layout can be selected on the Machine Page via Machine Page Layout drop-down menu. | ||
| - Not visible - layout is not available. | ||
| 3 | Icons | When the visibility level is set for each organization type (OEM, dealer, machine owner), the icons are colored accordingly. |
| - Green icon: the layout is set as the default layout. | ||
| - Black icon: the layout is set as the alternative layout. | ||
| - No color: the layout is not available to the organization type. | ||
| - Yellow color: the organization type has no layout assigned. |
Create Layout
You create layouts by adding widgets that show the data.
Note
Note that you can't change the assigned layout but only the original one.
Consider that there is also the option to Duplicate Layout where you can adapt the copied layout and/or its widgets.
When a new model machine is added to the DataPortal, it will be assigned a default layout with the Master Data widget.
Note
When an organization type is not allowed to view a layout, the Master Data widget only is automatically shown to users when opening the Machine Page of the model machine. Note that only if tracking is activated in Machine Master Data, location tracking is visible for the time range. Note that Machine Master Data widget is also displayed in case of deleting all layouts assigned to a model, see Delete Layout.
The "create/edit" view can be accessed as follows:
-
In the Machine Page Layout, depending on the selected view (see Machine_Page_Layout_Views):
-
Select the model name and go to the context menu via the
3-dots icon > Edit layout -
Select the layout name and select the
pen icon.
-
-
Alternatively, in the Machine Page, select Manage Layout > Add widgets. The layout opens in edit mode with the configuration pane on the right side:
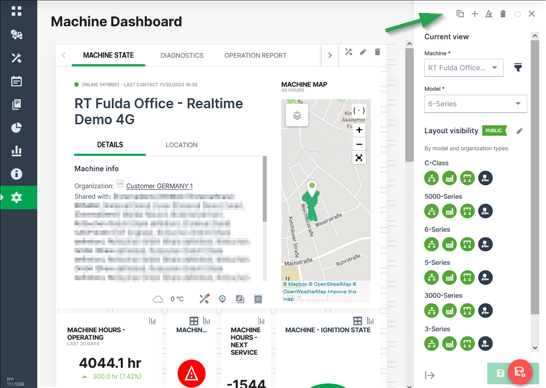
Figure 5: Edit Mode of layout
Add Widget
Note
Note that there is also the Tab Container widget for organizing the widgets in groups. Read Widget Catalog for a detailed description of each widget's configuration.
To add a widget, proceed as follows.
-
To add a widget, select the
add icon to open the widgets dialog with widgets listed from the Widget Catalog. -
Select and configure the widget as described in the Widget Catalog.
-
Once you have completed configuring the widget, save your settings. You can also see a Preview Layout.
While or after adding the widgets, you can resize or move them by drag-and-drop onto a grid that makes the most efficient use of space.
This is useful, because the display of widget information varies widely, from a single symbol to comprehensive graphs. Proceed as follows:
-
When editing the widget layout, the boundaries for a particular widget are shown as table cells within a broken line boundary.
-
Each widget type has a minimum size
-
There is a shadow under the widget that displays the footprint the widget will take up once you release the resize indicator. If you resize the widget over another widget it will shift to the next available space on the dashboard.
Preview Layout
You can view the layout of the widgets in a preview of the Machine Page. Note that you can only see a preview when the layout has been assigned to a model (see Manage Binding).
-
In the Machine Page Layout, depending on the selected view (see Machine Page Layout Views)
-
select the model name and open the context menu via the
3-dots > See layout. -
select the layout name and select the
view icon.
-
-
In the preview mode, you have the following options:
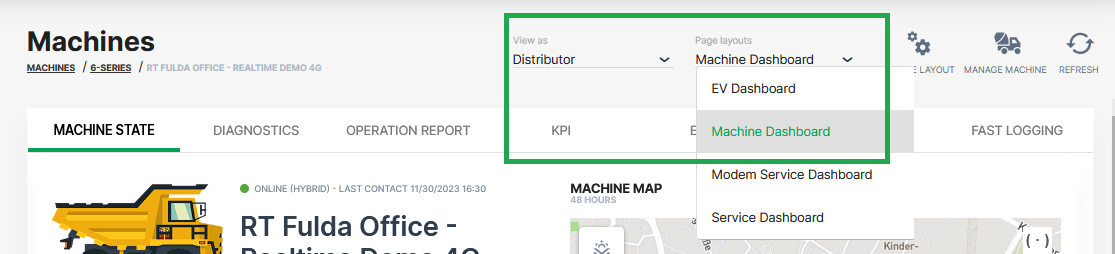
Figure 7: Preview Machine Page -
View as a different org types to see how users view the Machine Page.
-
Change between the Page layouts assigned to this machine model. You can also select private layouts for the preview.
-
Duplicate Layout
You can copy the layout of a model to use it as a basis for a new layout, see Create Layout. Note that also the layout's widgets and their configuration will be copied, too.
Note
Note that you can also assign a layout from a model to another model instead of copying it.
To duplicate a layout, proceed as follows.
-
In the Machine Page Layout, depending on the selected view (see Machine Page Layout Views):
-
select the model name and open the context menu via the
3-dots icon > Duplicate layout. -
select layout name and select the
duplicate icon.
-
-
Alternatively, in the Machine Page, select Manage Layout > Duplicate.
The layout has been now duplicated and in the layout name "copy" has been added to distinguish it from the original layout.
Consider to add a layout description to each layout (can only be seen by the administrator) as the layouts can have the same name.
Delete Layout
In the Machine Page Layout, you can delete layouts completely from the Machine Page Layout or remove only the binding to the model.
Warning
Deleting a layout will delete it for all organizations using it.
Consider the following when removing or deleting a layout that is in use by a model:
-
When the layout was the main layout by the model, the model's secondary layout becomes the main layout.
-
When no other layout exists for the model, basic information (which_is_the_Machine_Master_Data widget) will be shown to the users.
To remove the binding, proceed as follows:
-
In the Machine Page Layout, select the view View list by model name. You can remove a layout from the model only in this view. For more information on the views, see Machine Page Layout Views.
-
Open the context menu via the
3-dots icon and select Remove from model. You can also open the Manage Binding button and select the delete icon.
To delete a layout completely, proceed as follows:
-
In the Machine Page Layout, select the view View list by Layout Name. You can remove a layout from the model only in this view. For more information on the views, see Machine Page Layout Views. You can delete the layout only in this view.
-
Select the delete icon to remove the layout completely.
-
Confirm the deletion. A warning text will be shown when the layout is in use by a model.
Machine Data Management
Models Management
The DataPortal enables the management of machine models so that Admins, can categorize the machines in their organization.
The Models page is only visible to organizations that are tenants, typically the OEM.
For more information, see Tenant.
A model represents the type and class of a machine such as Digger 950L or Digger 1070XL. The machine on the DataPortal represents the individual real machine such as Digger 1070XL - S/N 190512
In this section we demonstrate the Model Management dialog.
Read also Model-Based Signals that have an impact on the model's visibility in the DataPortal.
The Models page also contains a link to Asset Types.
Note
Note that only models with assigned PDC, see Create Model - PDC are available for selection in the Provisioning dialog.
Note
The Settings > Administration > Organization Structure > Models tab is deprecated. Models can no longer be placed anywhere in the Organization Tree. Please use the new Model page in Settings > Machine Data Management > Models.
View Models
View the existing models in your organization as follows.
- Open Settings > Machine Data Management > Models.
This opens a list view of the models that are assigned ONLY to this organization in addition to the number of machines assigned to that model.
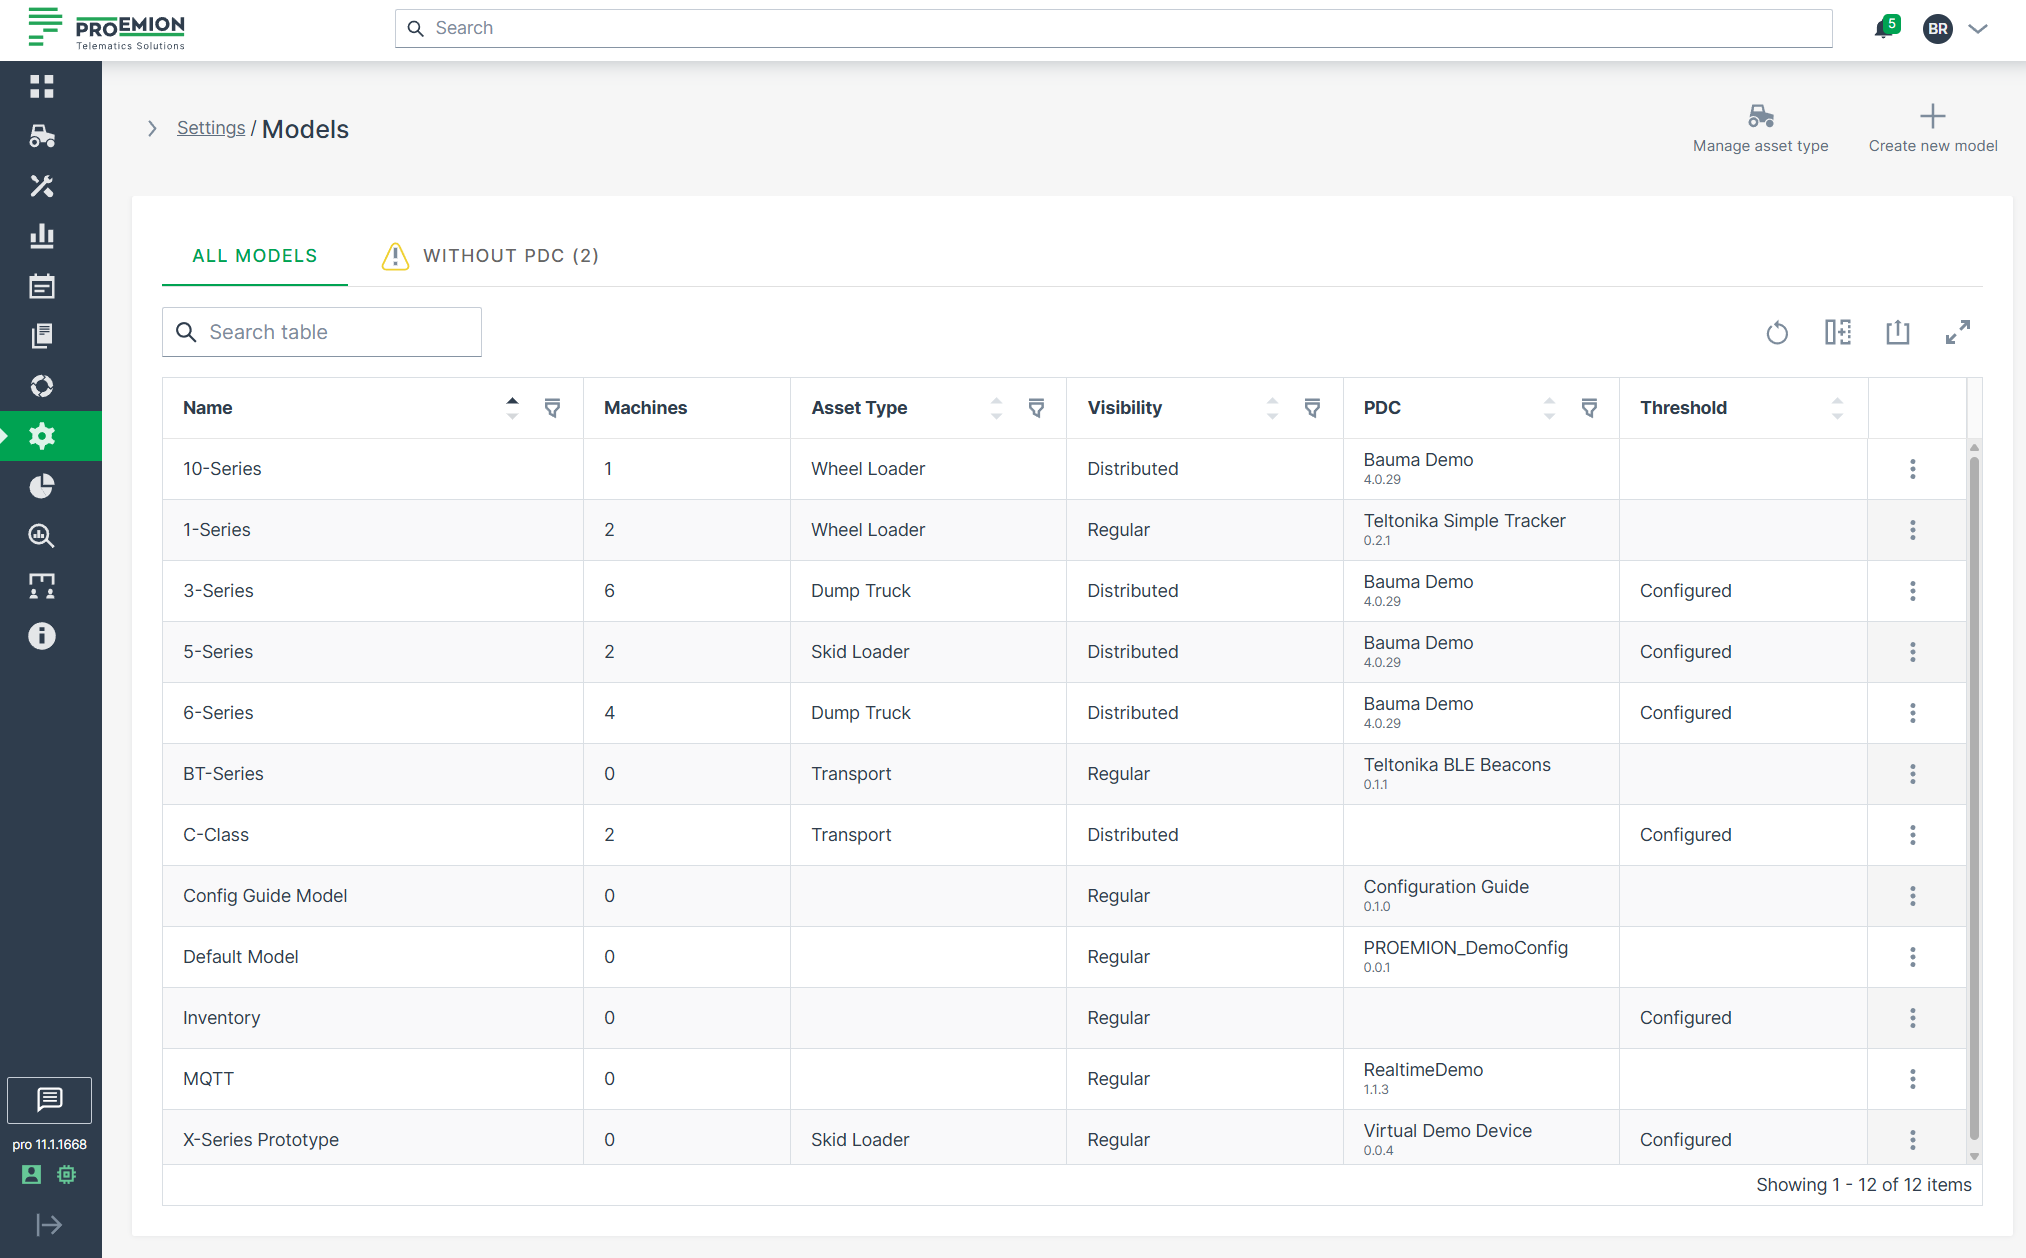
Create Model
-
Open Settings > Machine Data Management > Models.
-
Click the New Machine Model button on the upper right side of the models list to open the Create Model dialog:
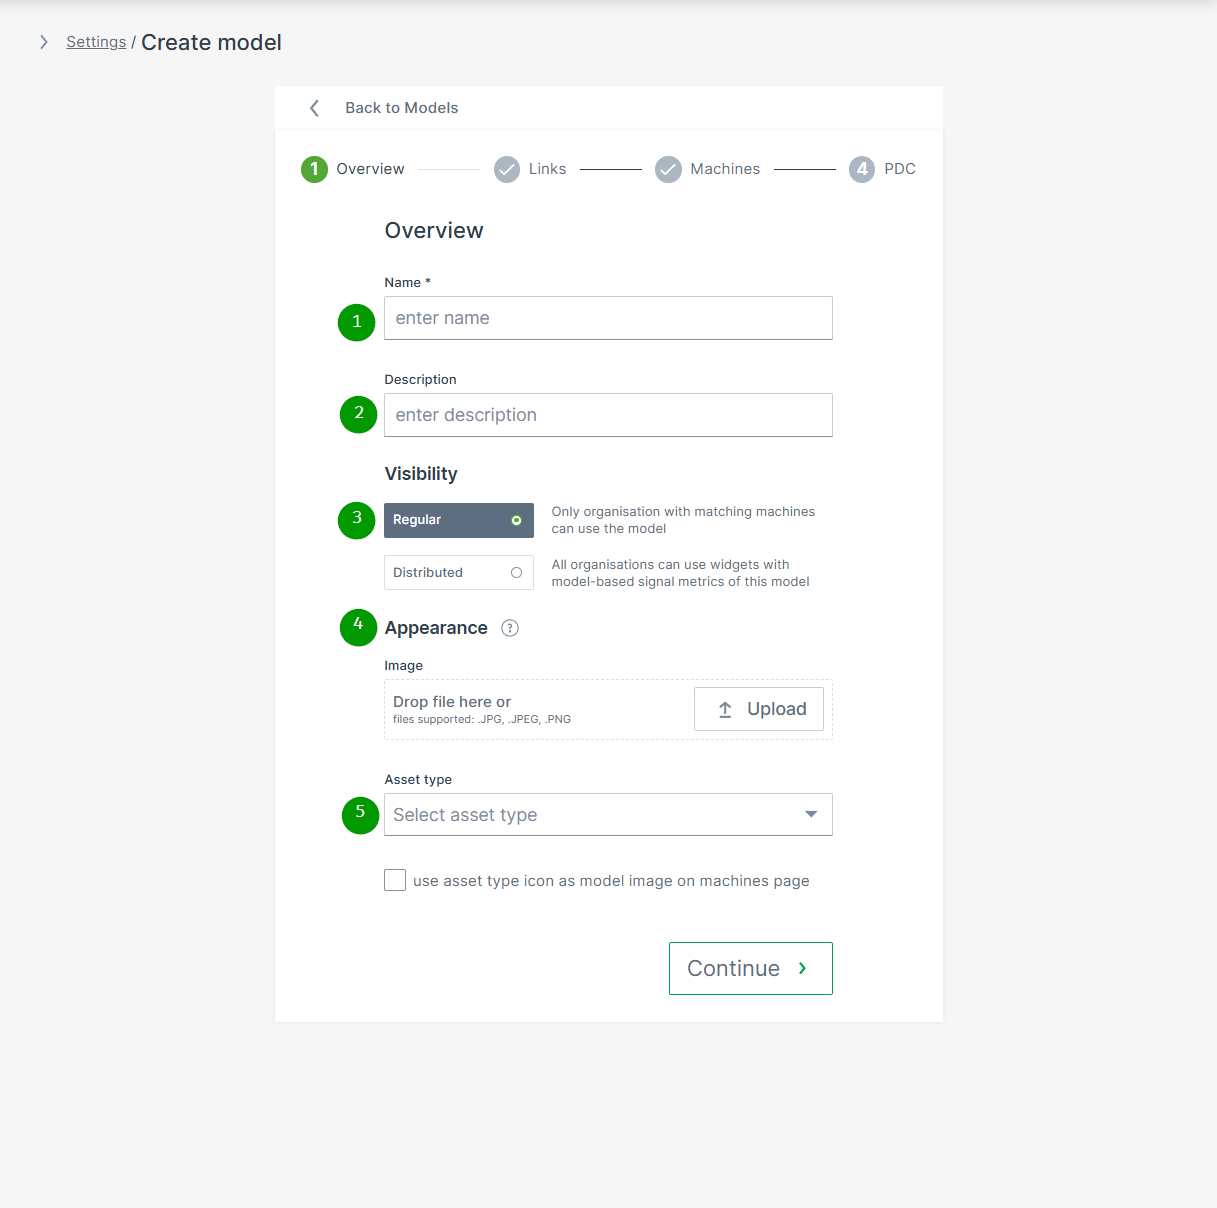
| # | Item | Description |
|---|---|---|
| 1 | Name | Model identification. |
| 2 | Description | Definition of the model. |
| 3 | Visibility | Defines the visibility of this model and its Model-Based Signals. |
| 4 | Appearance | The model picture will be shown for any machine assigned to this model. NOTE: In case that an individual image for a specific machine was uploaded, the individual machine image will be displayed instead. |
| 5 | Asset type for map and list view | Select the icon and label defined in Asset Types that will be displayed in the Machines Overview for the machines assigned to this model. You can then decide if the icon should be displayed instead of the uploaded image. |
Click Continue to assign links, machines and PDCs to the created model.
Create Model - Links
This option allows administrators the assignment of model-related service documentation and other external resources, which will be displayed in the Machine Master Data.
Note
Note that the Documentation Link feature must be enabled in the Feature Switch.
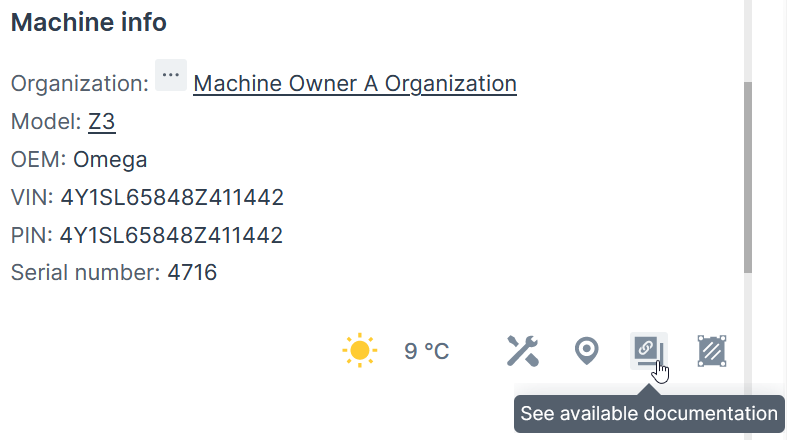
If the feature is not enabled, the Links tab does not appear, as illustrated in the following screenshot.
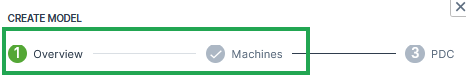
To add links to models, proceed as follows:
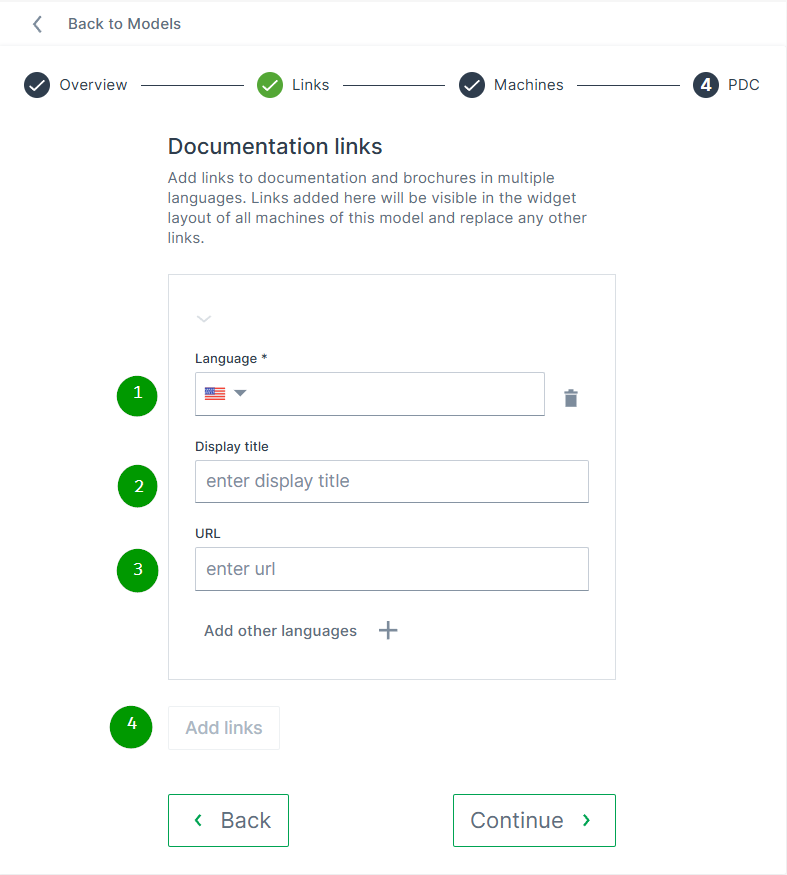
| # | Item | Description |
|---|---|---|
| 1 | Language | Choose the language for the Display title. Add additional languages using the + button. |
| 2 | Display titel | Enter the name that will appear in the Machine Master Data widget (see image above). |
| 3 | URL | Provide the web address of the documentation or other external resources. |
| 4 | Add links | Define additional links. |
Create Model - Machines
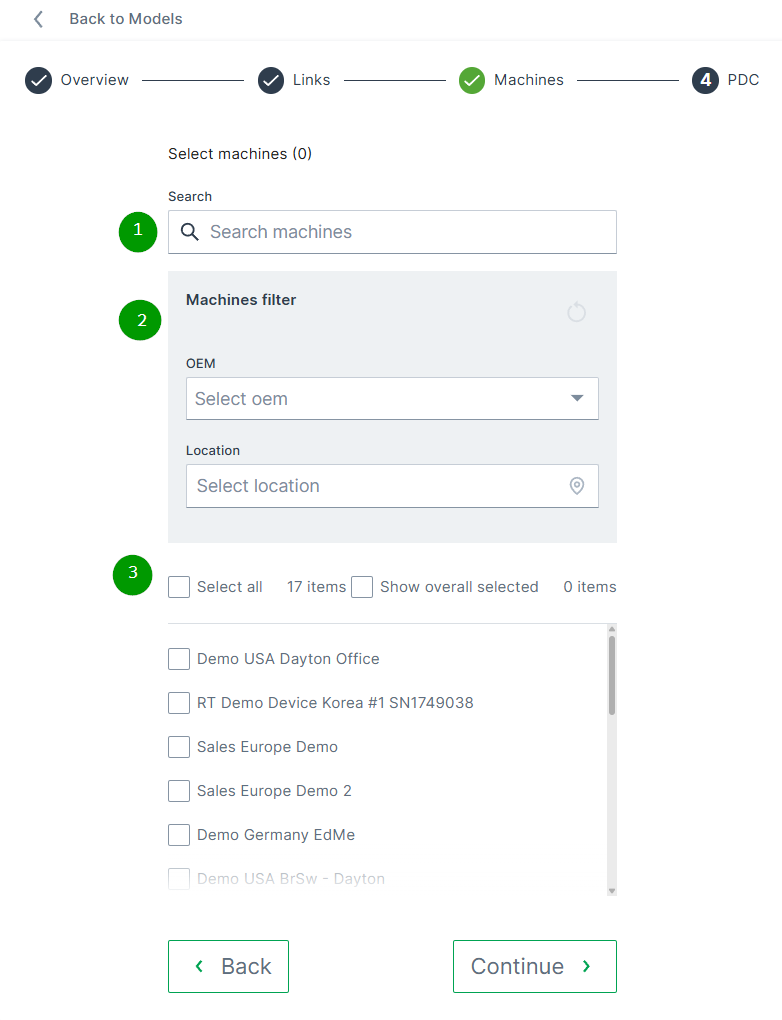
Search and select machine(s) to assign them to the model.
Create Model - PDC
For more information on PDCs, read PDC Management.
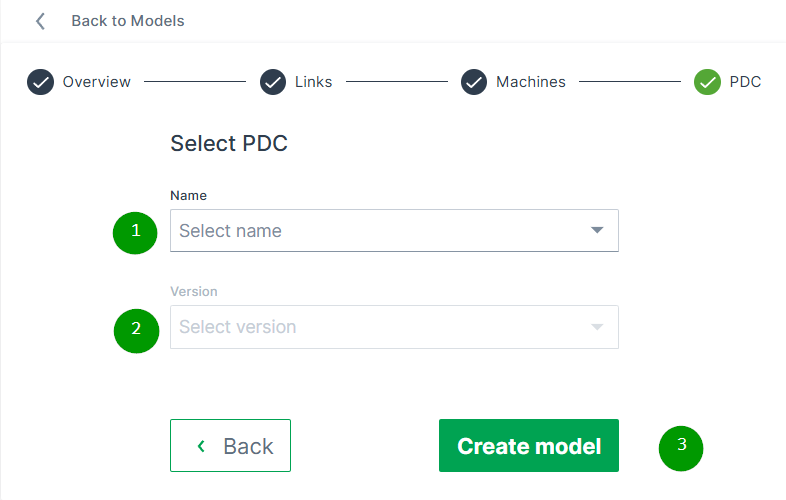
| # | Item | Description |
|---|---|---|
| 1 | Name | Shows the name of the selected PDC file. Open the dropdown menu to select one of the available PDC files. |
| 2 | Version | Select the required version of the uploaded PDC files. |
| 3 | Create model | Button to complete the configuration of the model. |
Edit Models
To Edit an existing model:
-
Open Settings > Machine Data Management > Models.
-
Open the 3-dots menu at the end of the model´s row and select Edit model.
The Edit model dialog opens:
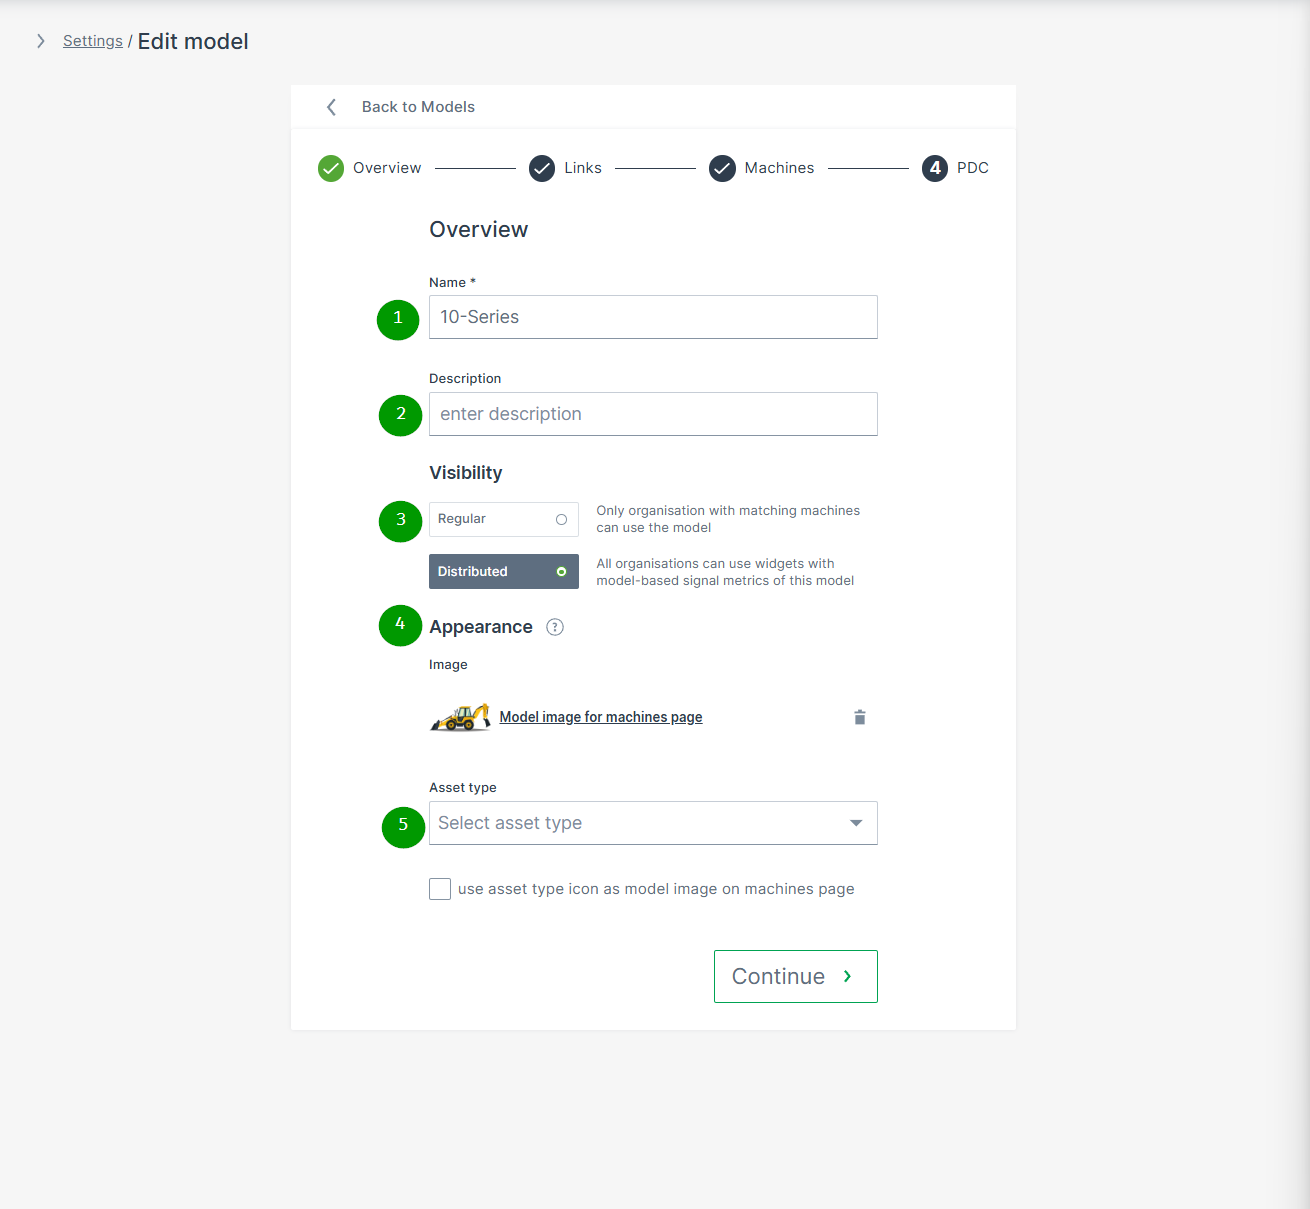
| # | Item | Description |
|---|---|---|
| 1 | Name | Model identification. |
| 2 | Description | Definition of the model. |
| 3 | Visibility | Defines the visibility of this model and its Model-Based Signals. |
| 4 | Appearance | The model picture will be shown for any machine assigned to this model. NOTE: In case that an individual image for a specific machine was uploaded, the individual machine image will be displayed instead. |
| 5 | Asset type for map and list view | Select the icon and label defined in Asset Types that will be displayed in the Machines Overview for the machines assigned to this model. You can then decide if the icon should be displayed instead of the uploaded image. |
Note
The trash icon next to the model is disabled if it has assigned machines.
Threshold Configuration
Model-based thresholds enable users to evaluate machine use via signal level thresholds. This feature allows you to apply thresholds to many machines with minimal effort.
The Model:Admin permission set is required to use this feature.
Further details about thresholds severity levels, configuration, notification and reporting can be found in the section Threshold Notification.
Users are also able to view signal threshold history in the following visualizations:
-
Custom DataPortal events
Configuration
Note
Thresholds are only available in the Models tab if the model and the user belong to the same organization. For each machine model, a set of thresholds can be configured per signal.
To configure a threshold for a model, proceed as follows:
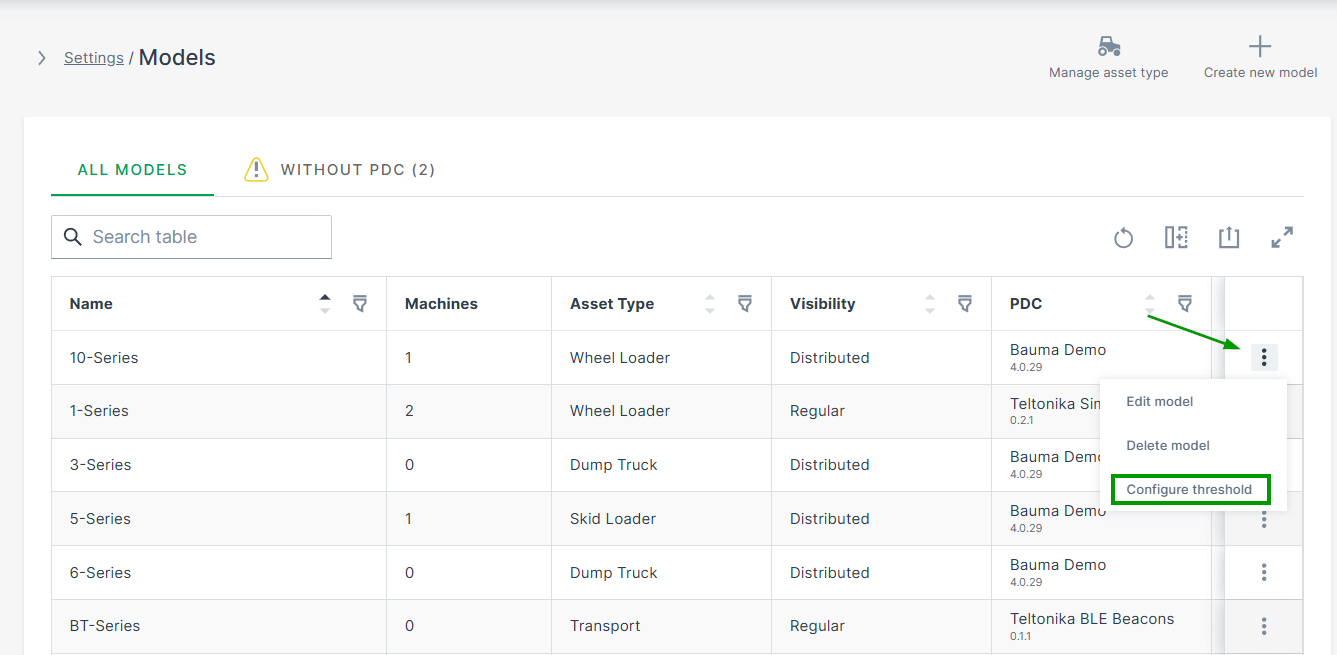
-
Open Settings > Machine Data Management > Models.
-
Open the 3-dots menu at the end of the model´s row and select Configure Thresholds. The Configure threshold page opens:
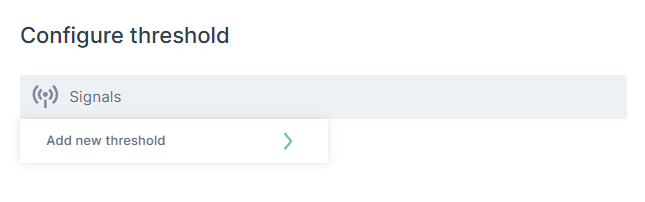
Figure 10: Signals field -
Click in the Signals field and Add new threshold
The list of signals opens.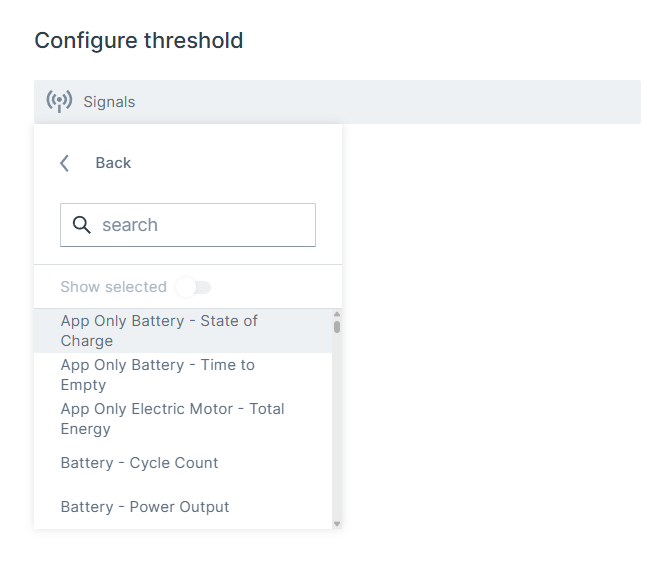
Figure 11: Signals list -
Select the signal from the list and configure its threshold.
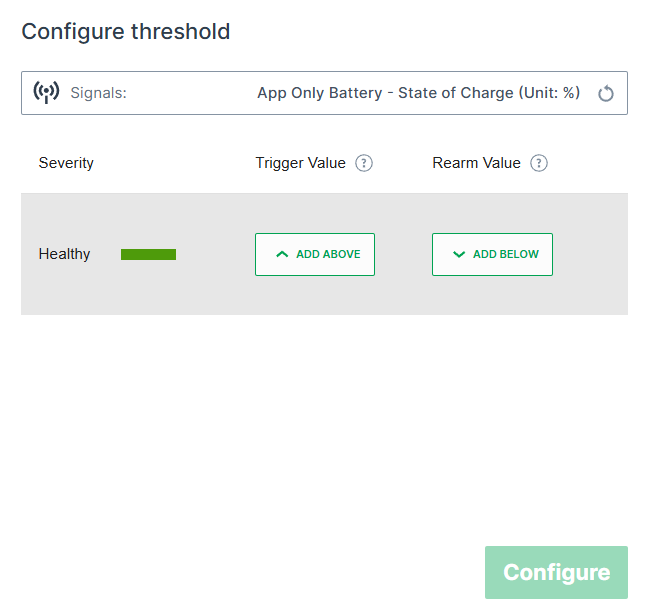
Figure 12: Configure threshold for selected signal
| Item | Description |
|---|---|
| Severity | Select the severity level outside the healthy signal value region. |
| Trigger Value | Set the signal value for a threshold. |
| Rearm Value | Set the value where the notification trigger is rearmed. |
Edit Threshold for a Single Machine
For testing or special circumstances it may be necessary to edit the threshold configuration for a single machine.
Since thresholds are designed for models, the procedure to test thresholds is as follows.
This procedure allows you to configure and view thresholds for a single machine.
-
Create a special test model without assigning it to a machine.
-
Assign the PDC to the test model.
-
Assign the model for testing purposes to a single machine and test the thresholds.
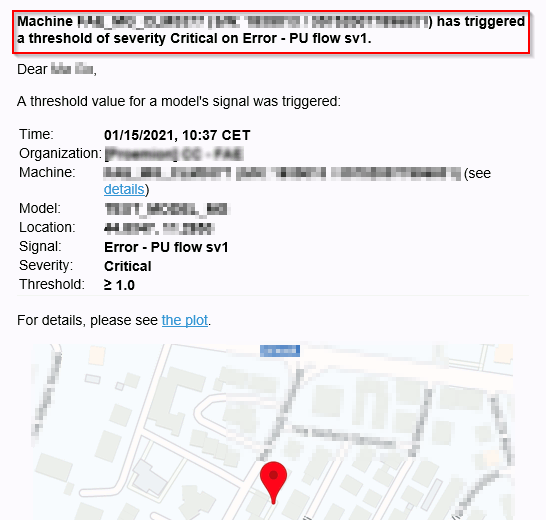 -->
-->
- Define the thresholds for this model.
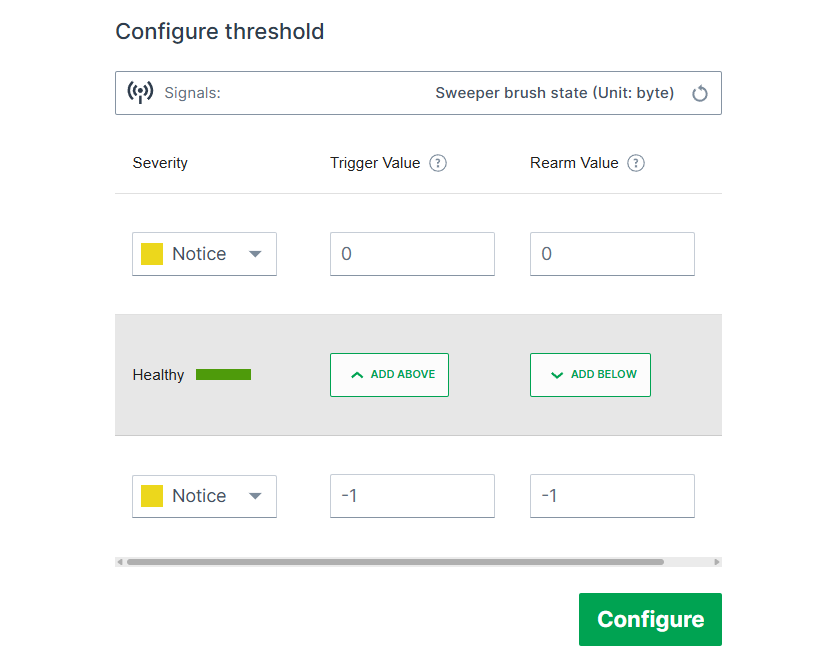
PDC Management
The Parsing Definition Configuration (PDC) is an XML file defining the signals to be displayed for specific machine types and their assigned models and/or machines.
Using the PDC file, the DataPlatform converts raw data from *.clf files into human-readable metrics.
Key Concepts
Assignment:
PDCs can be assigned to a model (applying to all machines within that model) or directly to a machine.
Direct machine assignments override model assignments - any changes to the model PDC will not apply to that machine.
Assigning a PDC to a model simplifies version control and ensures standardized metric selection for all machines of the same type.
Permissions:
User must have both the Machine:Admin and the Model:Admin permission set to assign a PDC to a Machine Model.
To edit, delete, or download PDCs, only the Model:Admin permission set is required.
Model Requirement:
Every model must have a PDC assigned; otherwise, it is unavailable in the Provisioning dialog.
Standardized Metrics:
To use Assignments and Maintenance Tasks, PDCs must include standardized and harmonized metrics.
Refer to the Signal Catalog, Proemion Standard Metrics, and PDC Manual for details.
Visibility:
The PDCs page is visible only to tenant organizations (typically OEMs). See Tenant for details.
Note
The Settings > Administration > Organization Structure > PDC tab is deprecated. Use the new PDC page under Settings > Machine Data Management > PDCs.
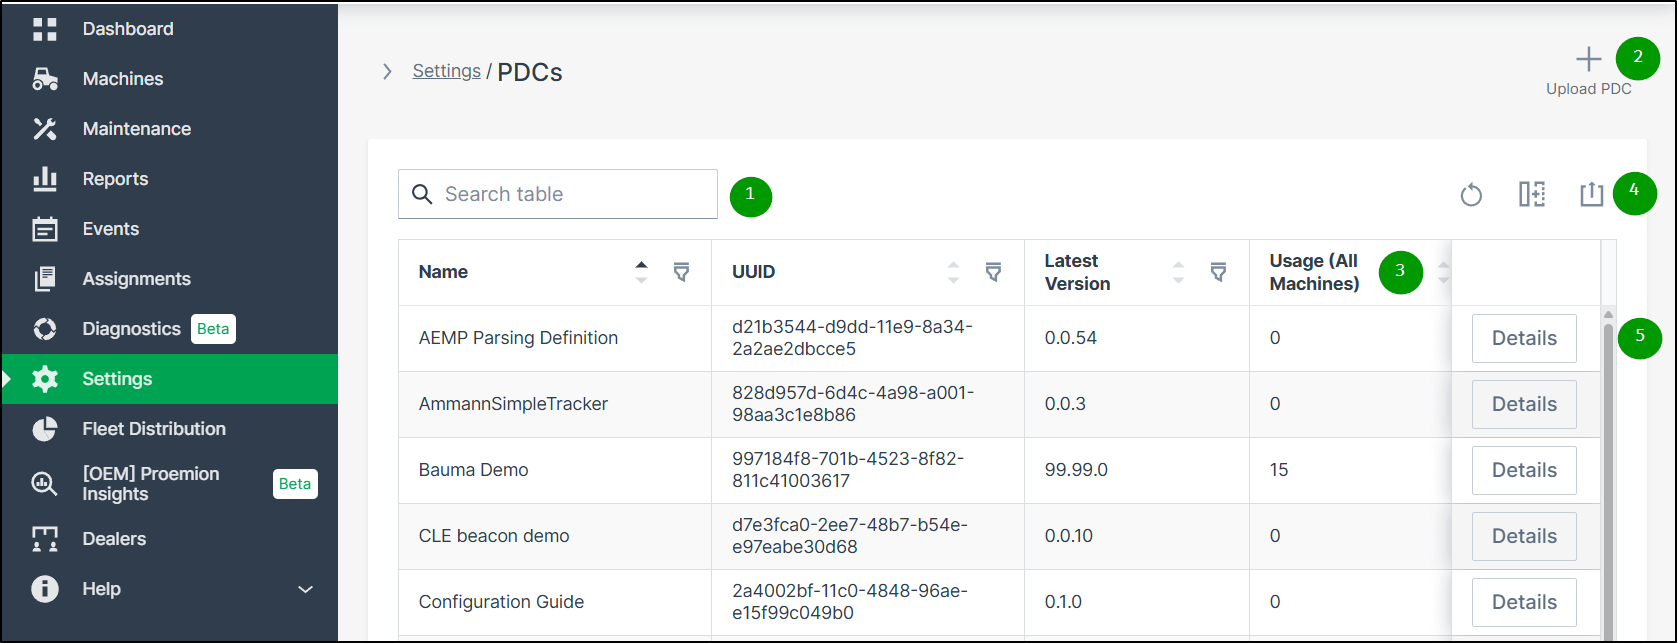
| # | Item | Description |
|---|---|---|
| 1 | File Search / Sort / Filters | Search for a PDC file in your organization by: - Name - UUID - Latest Version You can also sort the list of PDCs by clicking the column arrows to toggle between ascending and descending order. |
| 2 | PDC Upload | Upload a PDC file to your organization to make it available for your models and machines. |
| 3 | Usage (all machines) | Displays the number of machines which have this PDC assigned (directly or via model) PDCs with no usage are listed with the value 0. |
| 4 | Export table | Export the complete table via the |
| 5 | Details | Click the Details button to open the overview page of the selected PDC.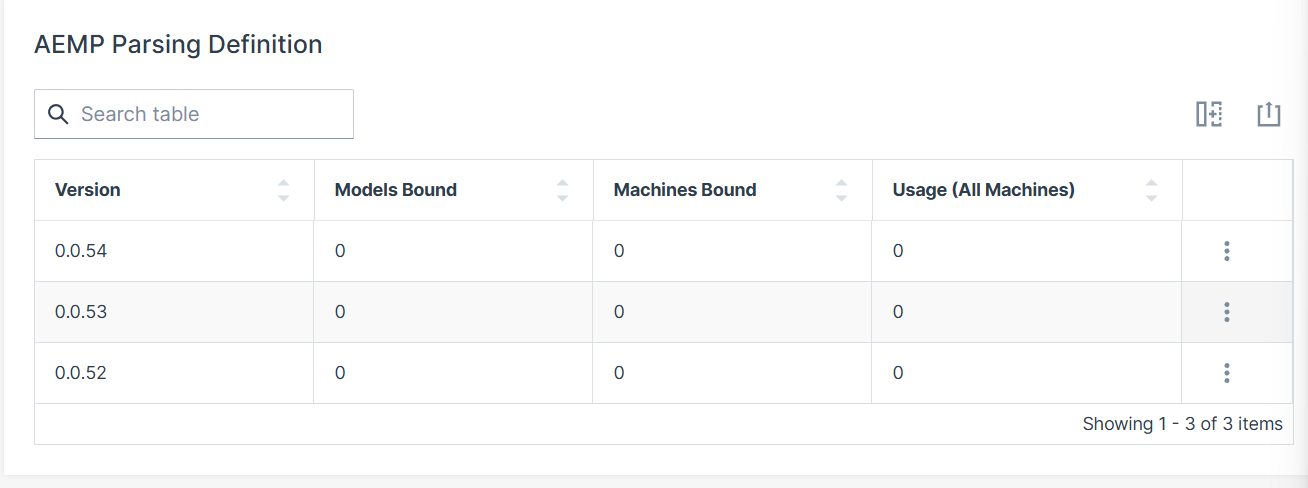 |
This chapter is aimed to explain the most typical use cases with the following workflow:
| # | Section | Workflow |
|---|---|---|
| 1. | PDC Upload | Shows how to upload a new PDC file or a new version of a PDC file. |
| 2. | PDC Assignment | Shows how a new PDC or new version of a PDC can be assigned to a model or to a machine. |
| 3. | Edit PDC Assignment | Shows how the assignment of the PDC can be changed. |
| 4. | PDC Download | Shows how the file can be downloaded for further processing. |
The following table shows an overview of the required permission sets in relation to the various PDC management tasks:
| Permission Set | Level | PDC Management Task |
|---|---|---|
| Models | Admin | View PDCs. |
| Models | Admin | Manage PDCs. |
| Models | Admin | Assign a PDC to a machine. |
| Models | Admin | Assign a PDC to a model. |
| Models | Admin | Upload a PDC. |
| Models | Admin | Edit PDC to machine or model assignment. |
| Machines | Admin | View PDCs. |
| Machines | Admin | Manage PDCs. |
| Machines | Admin | Assign a PDC to a machine. |
| Machines | Admin | List available PDCs. |
| Machines | Admin | Edit PDC to machine assignment. |
PDC Upload
To upload a PDC, proceed as follows:
-
Navigate to Settings > Machine Data Management > PDCs.
-
Click UPLOAD PDC in the upper right corner.
-
Select or drag and drop the PDC file.
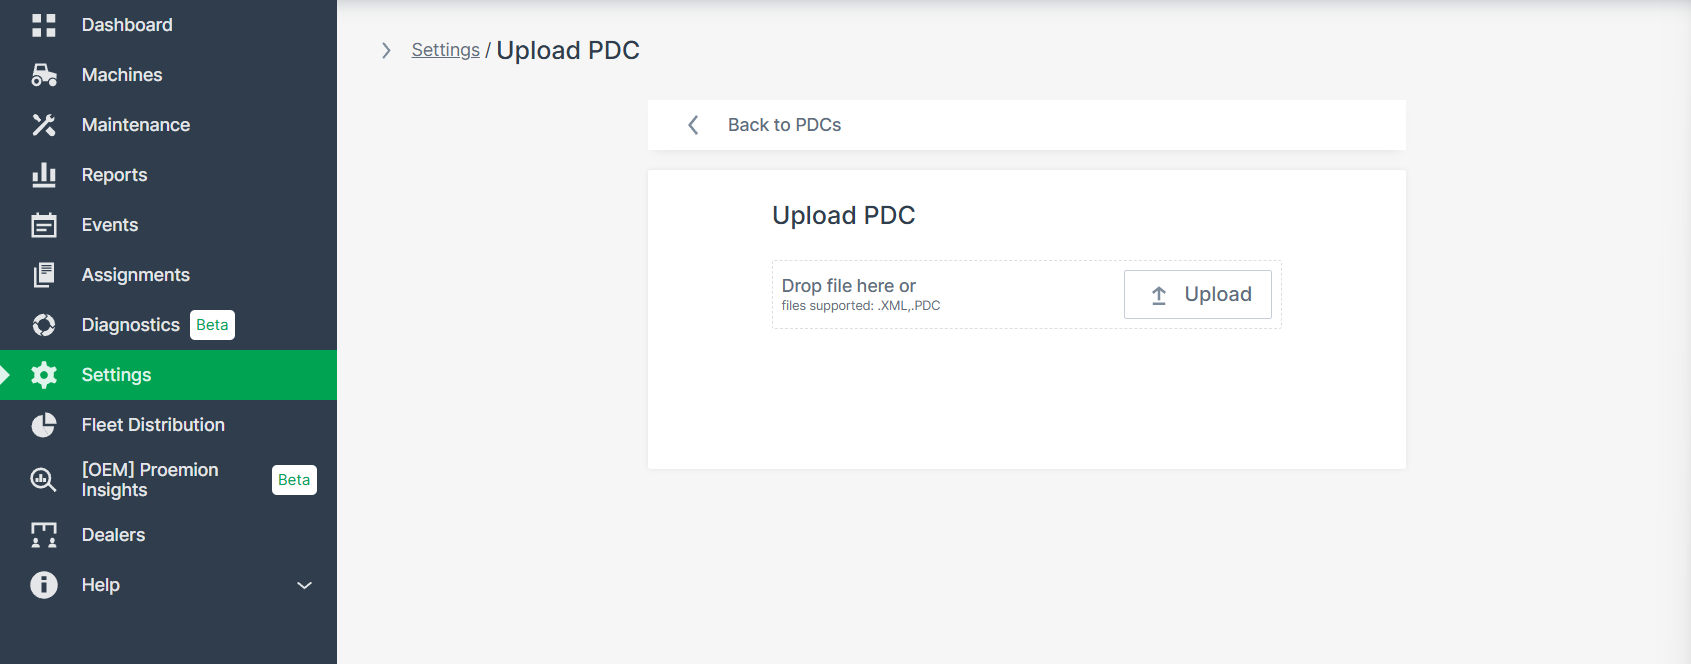
Figure 2: PDC Upload -
Click Upload.
PDC versioning is managed via UUID, major, minor and patch numbers. For updates, increment patch and keep UUID; for new PDCs, use new UUID and version.
PDC Assignment
PDCs must be assigned to models or machines to take effect.
Assign PDC to Model(s)
To assign a PDC to specific model(s), proceed as follows:
-
Navigate to Settings > Machine Data Management > PDCs.
-
Click the Details button at the end of the row of the desired PDC to open the details page.
-
Via the
at the end of the line of the desired version of the corresponding PDC file, select Manage version in the dropdown menu: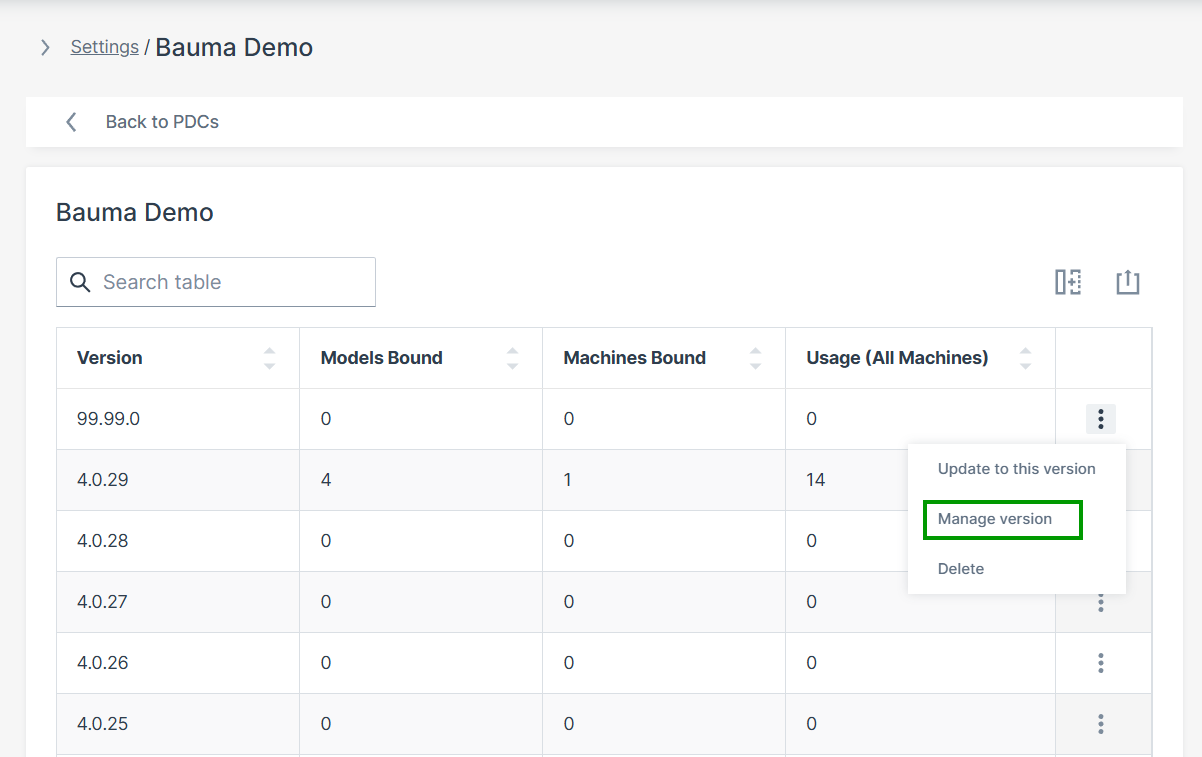
Figure 3: Manage version The overview page of the PDC file in the selected version opens:
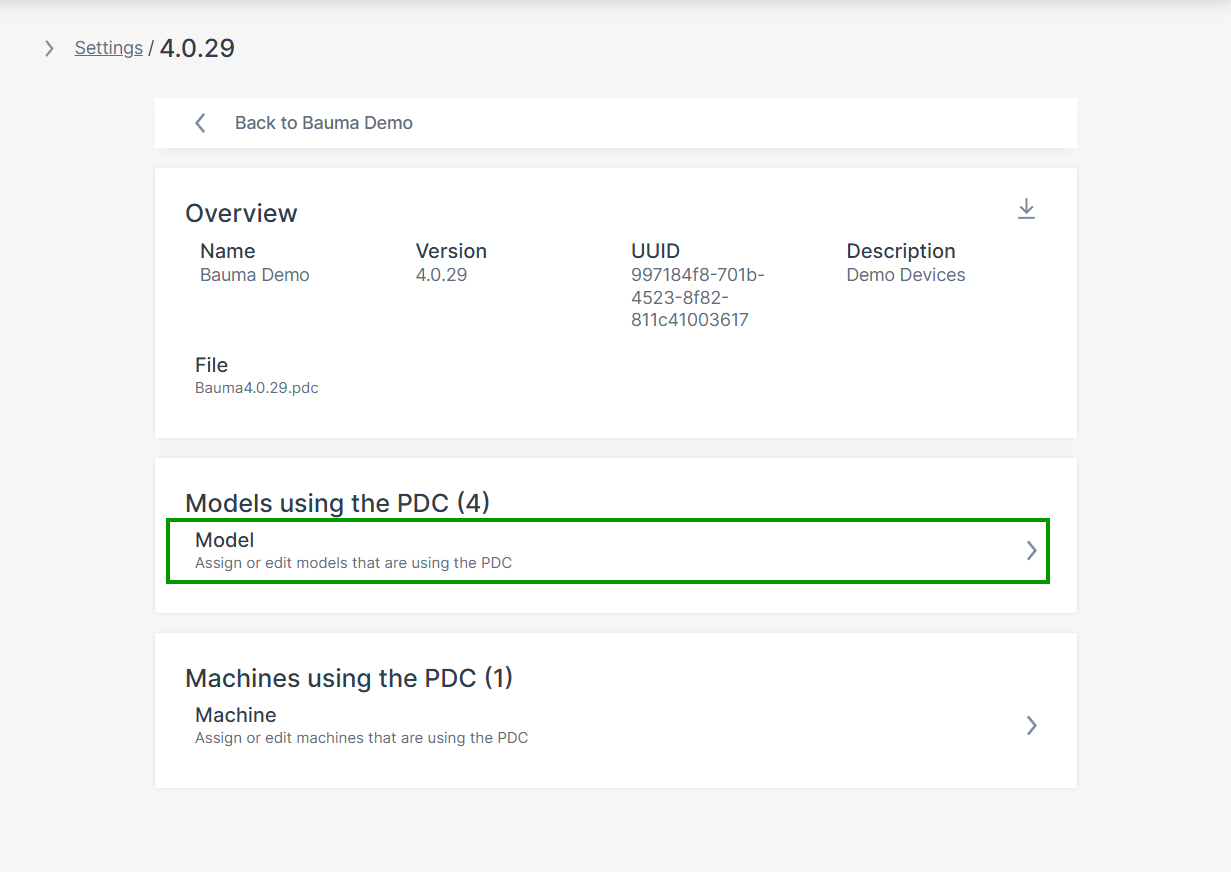
Figure 4: PDC version overview page -
Click the Model field. The Models using PDC page opens, showing the table of already assigned models.
-
Click Assign/Unassign model to assign the selected version of the PDC to a new model.
The dropdown menu with the available models opens: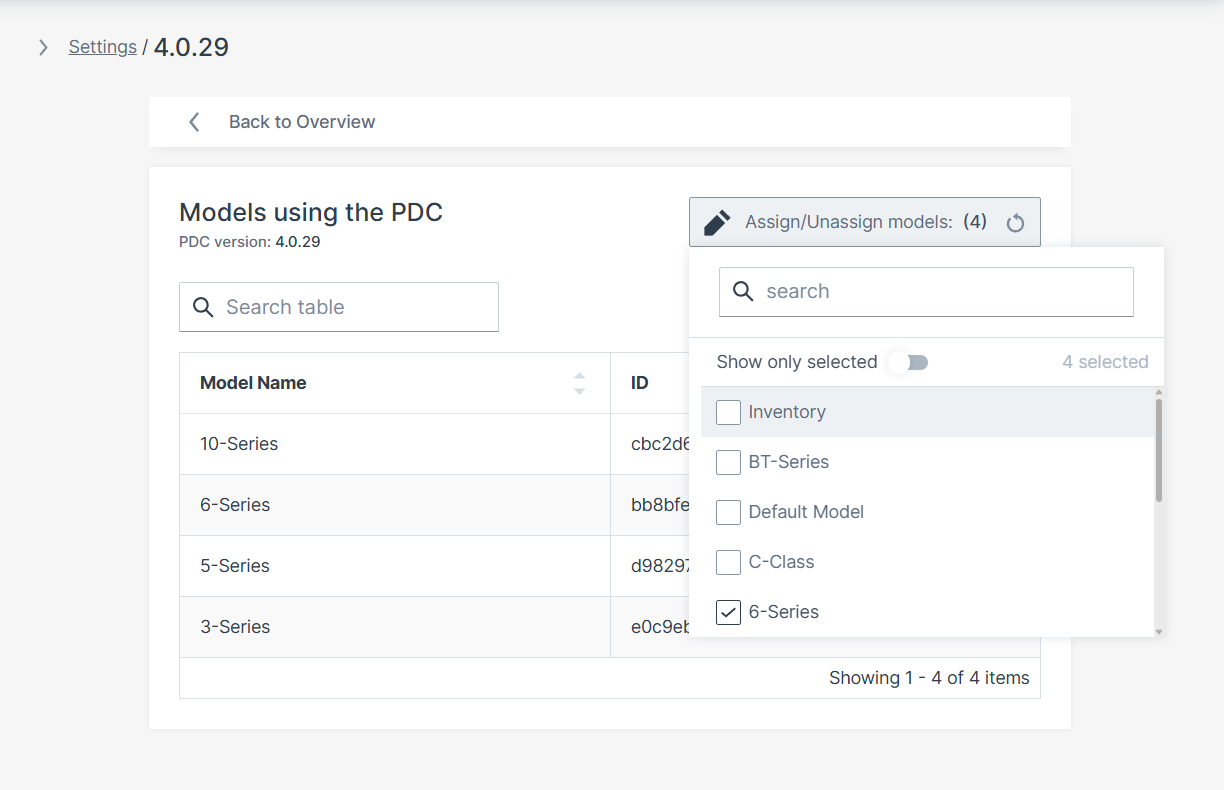
Figure 5: Models using PDC overview -
Select the corresponding model(s).
Assign PDC to Machine(s)
Note
It is recommended to use direct machine assignment only for testing. Afterward, assign to the model for standardization.
-
Navigate as above and open the Manage version option in the dropdown menu.
-
Click the Machine input field to open the Machine selector.
-
Search and select the desired machine(s) to assign the selected PDC version.
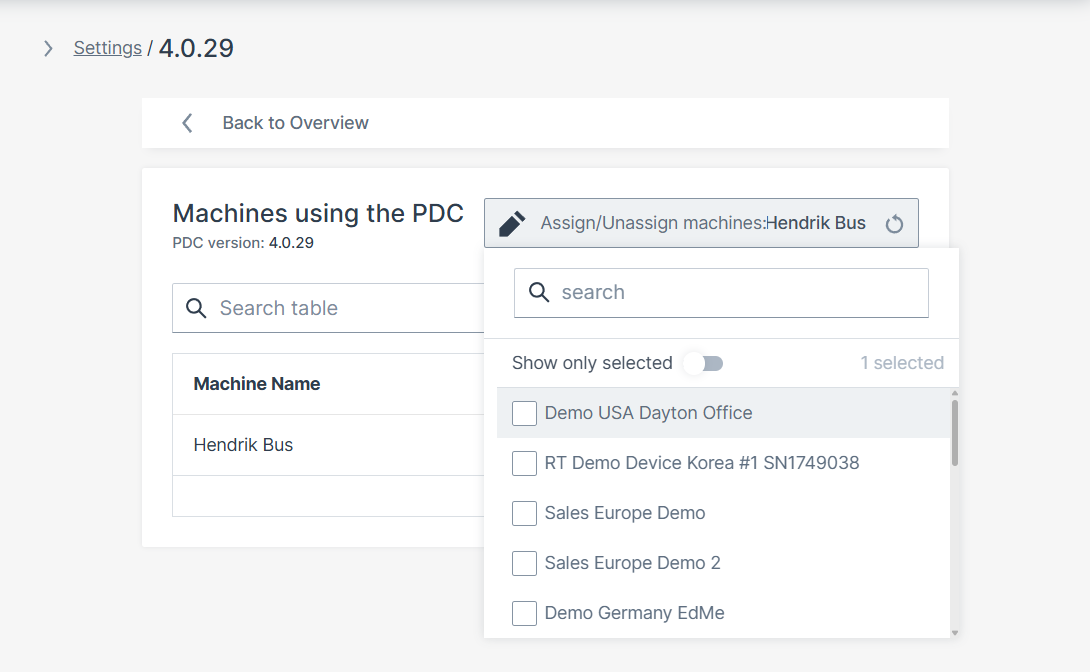
- Select the corresponding machine(s).
Update PDC Versions for Assigned Machines
To update all machines with a common PDC to a new version, proceed as follows:
-
Navigate as above and open the Update to this version option in the dropdown menu.
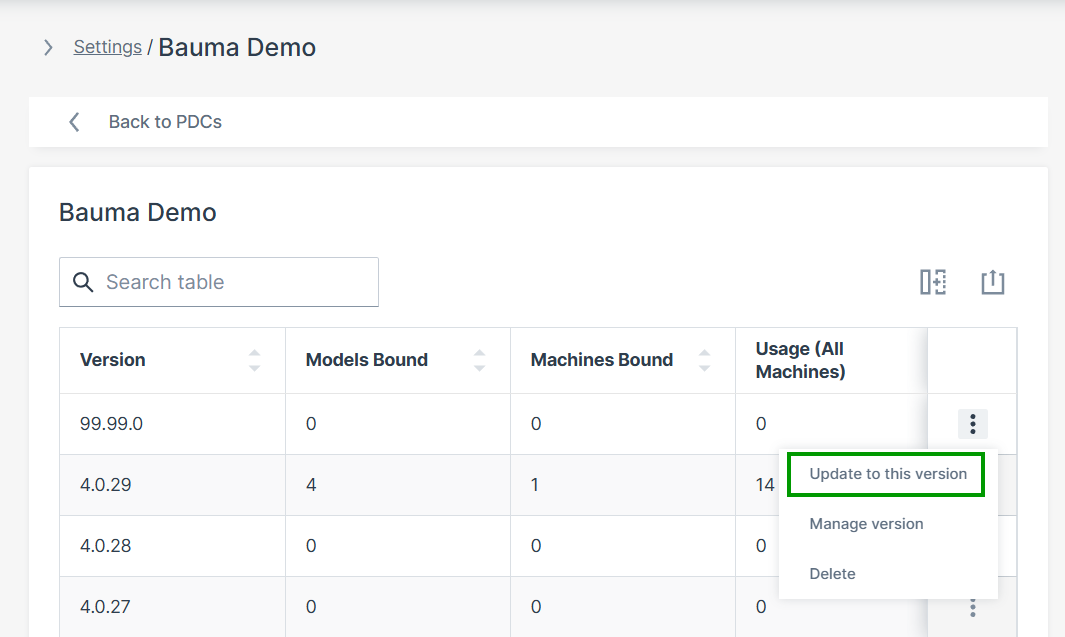
Figure 7: Update Machines to new version of PDC -
Select the PDC version(s) to update.
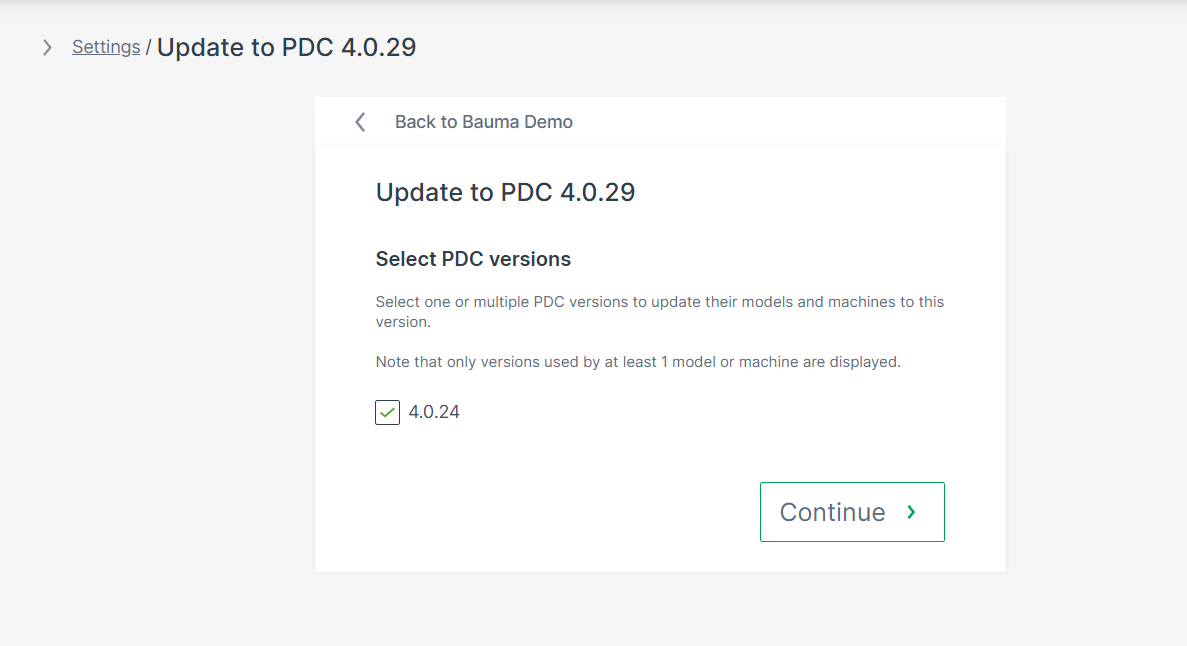
Figure 8: Update Dialog - Select PDCs for Update -
Click Continue.
-
Review summary.
-
Click UPDATE to apply. A confirmation message appears.
Edit PDC Assignment
Assignment changes can be done via:
-
Manage version dialog (see above).
-
EDIT MODEL dialog. Refer to Models Management and adapt the PDC assignment accordingly.
-
Manage Machine dialog:
On the Machine Page, select the machine you want to manage and click the Manage Machine vehicle button in the top-right corner.
This opens the Manage Machine window.
PDC Download
If an existing PDC version needs to be modified, it can be downloaded for further editing.
To download a PDC file, proceed as follows:
-
Navigate as above and open the Manage version option in the dropdown menu.
-
Click on the download sign in the upper right corner.
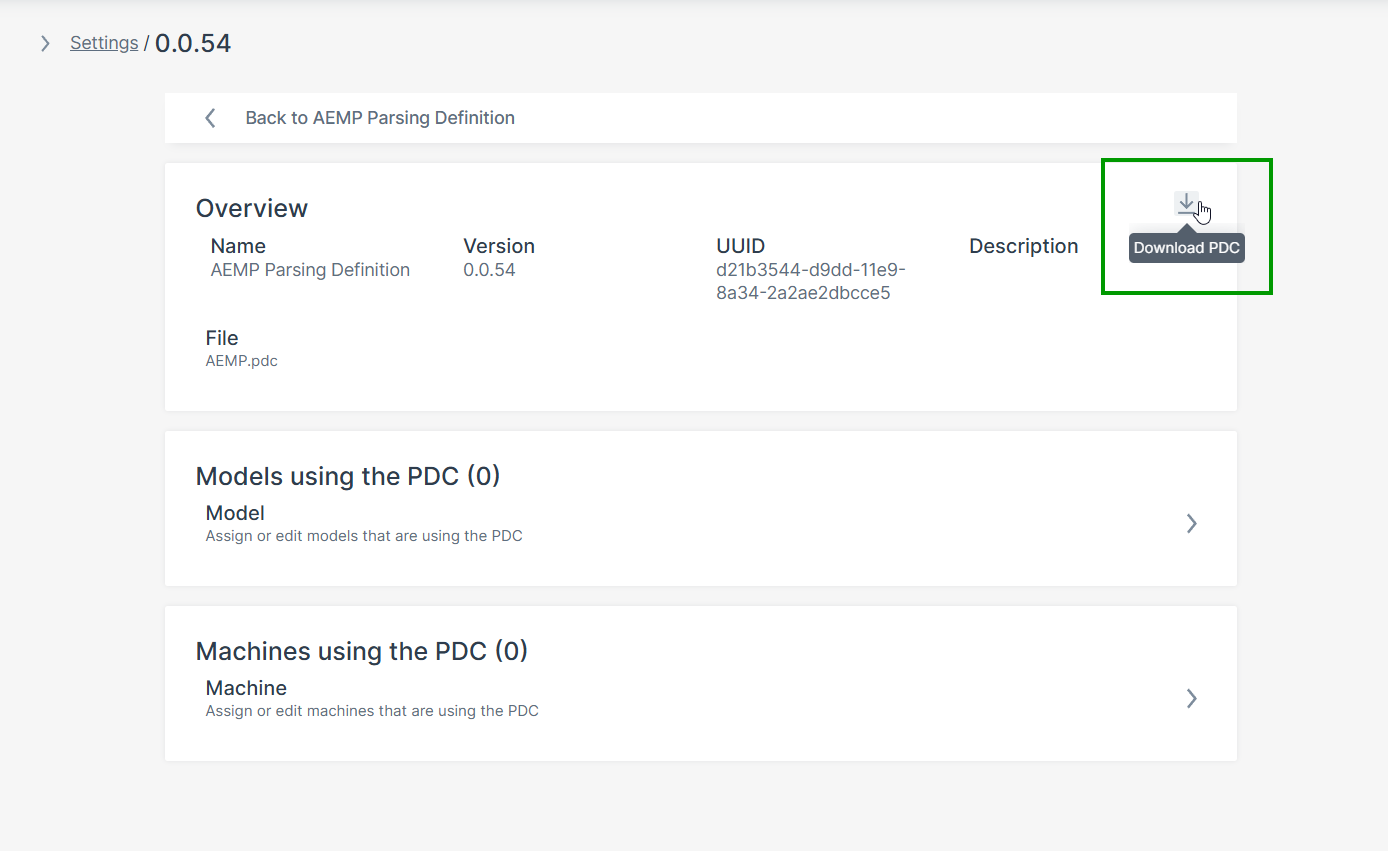
Delete PDC
Note
PDC versions assigned to models or machines cannot be deleted; the delete option is disabled.
To remove assigned PDCs, contact your Proemion representative.
To delete a PDC with unused version, i.e. with 0 Usage, proceed as follows:
-
Navigate as above and open the Delete option in the dropdown menu.
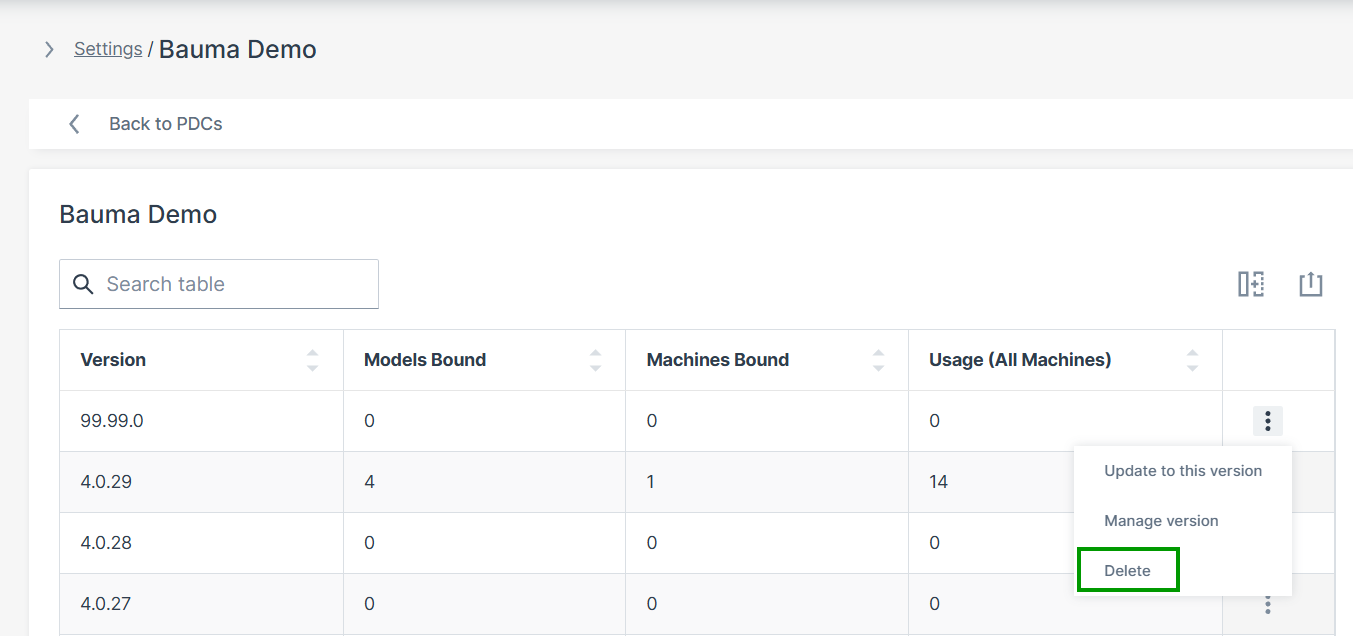
Figure 10: Delete PDC -
Click on Delete this version. A confirmation message appears.
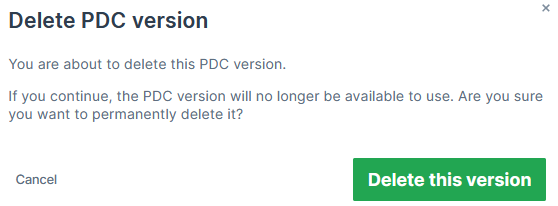
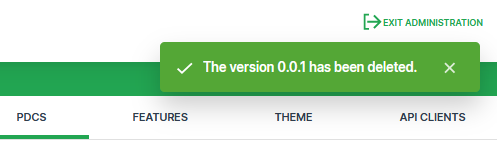
Figure 11: Delete PDC Confirmation
Asset Types
Asset Types is a combination of a label and icon used to categorize machine models based on their functionalities, e.g. dumper, excavator, etc.
This allows to filter models by the assigned labels, e.g. on the map, and to have an overview of the available asset types throughout the entire organization/fleet in the Settings > Machine Data Management > Asset Types menu:
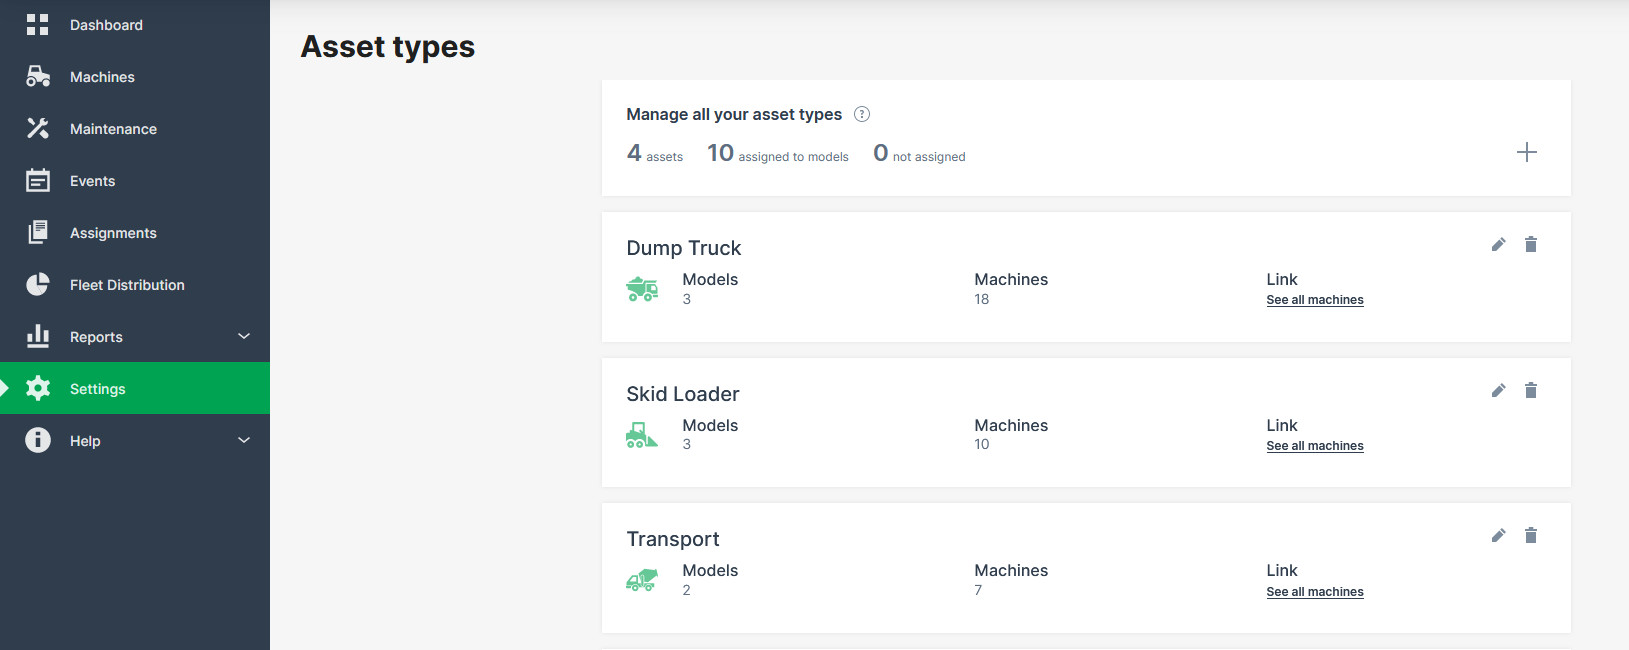
Clicking the link See all machines leads you the Machines Overview with the filter already set for the selected asset type.
The Asset Types together with its label and icon is defined by a tenant, typically the OEM (see also Tenant), while the assignment of the asset type to models can be done by any user with Model:Admin permissions, see Requirements.
Requirements
The required permission sets are following:
-
Model:Admin to define asset types only by users within tenant organizations, e.g. OEM organizations.
-
Model:Admin to assign models to asset types in the Asset Type menu only by users within tenant organizations.
-
Model:Admin to assign or edit models to asset types in the Model menu (by any user).
-
No specific permission required to view the assigned asset types on the map or where included within the DataPortal.
Define Asset Types
To define a new asset type, proceed as follows.
-
Open Settings > Machine Data Management > Asset types. Here you can view the already existing asset types, if available.
-
Click the add icon
to open the Asset type details dialog: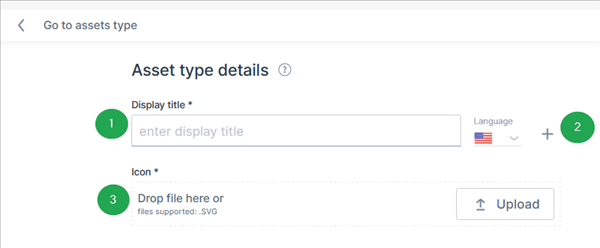
Figure 2: Asset type details # Item Description 1 Display title The label which will be displayed in the Asset Types overview and on the Machines Overview, both Map and List views. 2 Language Add a new label for each language. 3 Icon Upload an icon for the asset type.
Now you can proceed with assigning asset types to models.
Assign Asset Types to Models
There are two ways to assign models to an asset type. Consider the Requirements.
Assign asset type in Asset Type menu:
-
Open Settings > Machine Data Management > Asset types.
-
Click the link See all machines. This opens the Asset type details dialog:
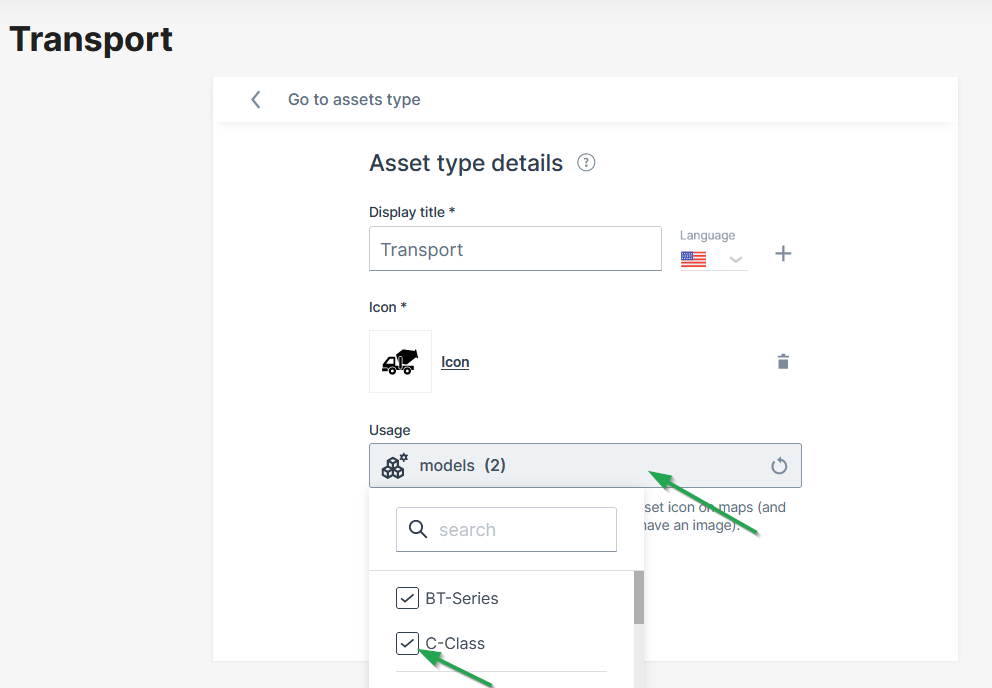
Figure 3: Assign asset type menu -
Click the field Usage to open the drop-down menu of available models.
-
Select the models you want to assign to the asset type.
✓ The model is now assigned to the asset type.
Assign asset type in Models dialog:
You can assign asset types to models in the Create Model and/or Edit Models dialogs and also change or remove them.
Guidelines for Creating Icons
The following guidelines are useful when providing asset icons for the DataPortal to make sure they are rendered correctly.
Assets icons are used in the format 24px x 24px on:
- map pins in white over contrast backgrount
- navigation contrast colour over brand colour background
They are used on a machine model page in a larger format if there is no model image for the machine.
Creating assets
When creating your artwork, ensure it conforms to the following:
Recommended size: 24px X 24px, 48px X 48px, 72px X72px
Shape: Full square with no round corners
Format: SVG
Vector: unified shape
Color: unified color (preferably all black)
Padding: leave 2px internally around the image
Background: transparent
If the asset icon is not squared, center its position vertically and/or horizontally (img 2 and 3).
Signal Catalog
The Signal Catalog offers a centralized management of the signals and their definitions, i.e. signal properties, e.g. the signal key, label, unit and format.
The Signal Catalog summarizes and compares value definitions for repeated signals of the active PDC files within the entire organization's fleet.
You can use the Signal Catalog to standardize and unify the value definition of your PDC files and thereby enable a seamless analysis of the signals across the entire fleet.
Also, some DataPlatform standard functions such as Maintenance Tasks and Assignments rely on harmonized signals.
Read in the following chapter how to get an Overview of all Signals, Create Signal, View and Edit or Delete Signal Details and Resolve Conflicts and find a link to the Migration Guide for the Signal Catalog.
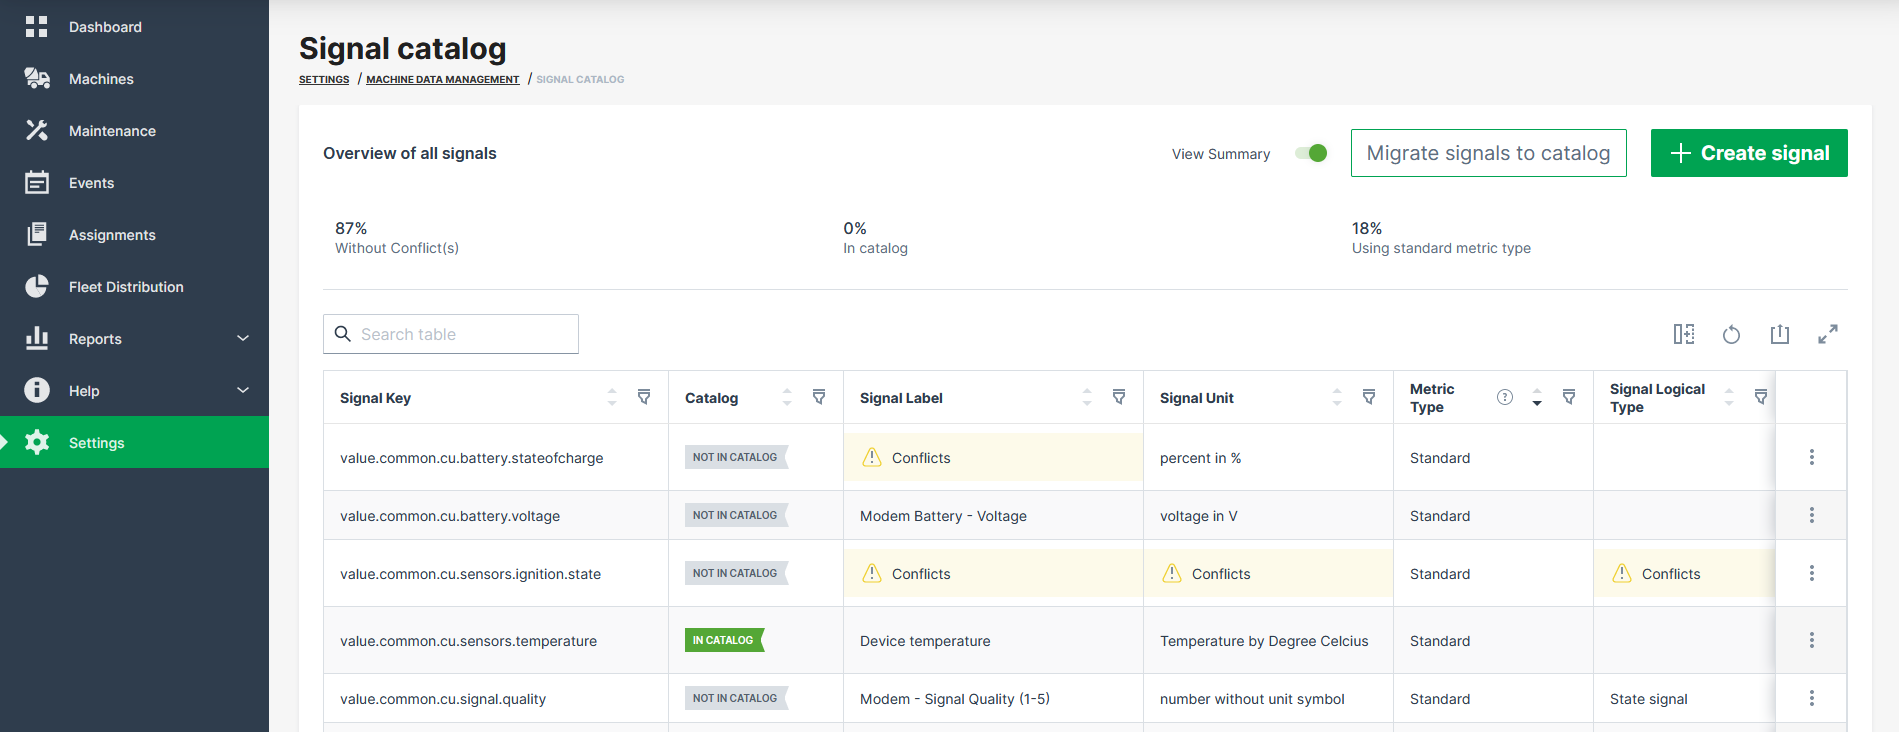
Note
The Signal Catalog only compares the identical signal keys within the value definition of the active PDC files. Similar signal keys but with differences in their spelling are not compared.
Requirements for the PDCs
-
The Signal Catalog only includes signals of PDC files which are assigned to a model or a machine. These are hereinafter referred to as active. Unassigned PDC files are not considered within the Signal Catalog verification.
-
Make sure that the user has access to all assigned PDC files within your organization tree.
-
Further information regarding the PDC content and functions can be found in the PDC Manual.
Migration Guide for the Signal Catalog
Before you can edit all the signal properties, you may migrate all or specific signals of the active PDCs to the Signal Catalog.
For information on how to migrate signals, read the Migration Guide for the Signal Catalog. Click here for the migration guide PDF: Migration Guide for the Signal Catalog PDF.
Overview of all Signals
To access the signals in the DataPortal Signal Catalog, open Settings > Machine Data Management > Signal catalog.
Note
The Signal Catalog is available to users with the Model:Admin permission set.
A table opens that lists all signals and their definitions in the organization. For each signal, you can open the Signal Details and view each signal definition in a separate view. If there is a conflicting definition, a conflict icon shows up; you can go to the Signal Details to view the conflict message.
For general information on signals and their definition, read the Proemion Standard Metrics.
The Signal Catalog table shows the following information on the signal definitions, see also image above:
| Item | Description |
|---|---|
| Signal key | The unique signal keys of all active PDC files are listed within this column. The value definitions of identical signal keys are checked for variations. Signal keys with a unique name and usage in only a single PDC file have by default a number of conflicts = 0. For the signal names numbers, letters and the characters - and _ are supported; for more information on the syntax, read Standard Metrics Syntax definition. |
| Catalog | In Catalog means that the signal key has been added to the Signal Catalog and can be managed in DataPortal. |
| Signal Label | For every signal key, a label can be defined, i.e. the name or translation of the signal key. If there is no label, a conflict message shows up. For signal labels unicode characters are supported. |
| Signal Unit | The (predefined) unit the metrics are measured in. If there is no unit defined for the unit, a conflict message shows up. |
| Metric Type | Shows whether the signal is a Standard or Custom metric. For the list of standard metrics, see Proemion Standard Metrics. |
| Signal Logical Type | Shows whether the signal is a measurement, state or counter metric. |
| Bound To | Shows whether the signal is bound to a Machine or Model. |
| Organization Type | Shows which organization type may view the signal: OEM, Distributor, Dealer or Machine Owner. |
| Models | The number of models using this signal key. Note that both standard or custom signal keys may be used by one specific machine only, but 0 models. |
| Machines | The number of machines using this signal key is displayed here. |
| PDCs | The number of active PDC files using this signal key is displayed here. |
| Conflicts | The number of various conflicts across the definitions of the different PDC versions for a common signal key is displayed here. |
Note
Currently, differences regarding the min and max value of the value definition for a specific signal key are not checked and displayed in the signal catalog.
Create Signal
You can create a new signal and its signal definition in the Signal Catalog and later reference it in a PDC to bind it to a model. That means, after creating the signals, you then need to upload a PDC referencing those signal keys to bind them to models, see Bind Signal to PDC.
Note
You mustn't define any details on the value definitions in the PDC as you will define them during the creation of the signal.
To create a new signal, proceed as follows. It is recommended to add as many details as possible to create a valid signal definition.
-
Open Settings > Machine Data Management > Signal catalog.
-
Click Create signal in the upper-right corner.
Figure 2: Create signal button The New signal dialog opens which will guide you through the signal definition.
-
In the Signal Declaration, select the following signal properties:
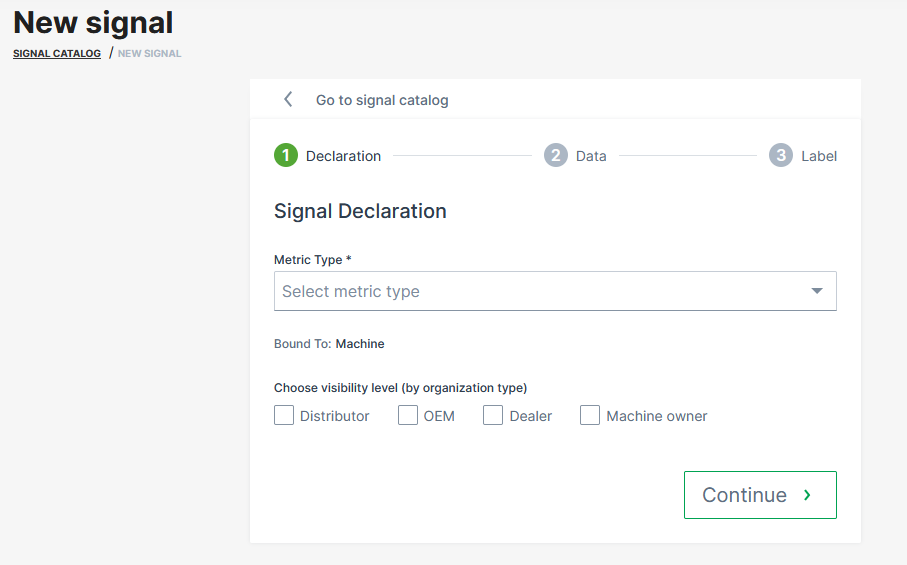
Figure 3: Signal Declaration -
Metric Type: Select the metric type: Standard or Custom.
-
Signal Key: Depending on the metric type, select the standard signal key from the list or enter a custom signal key.
-
Bound to: Shows the signal source of the signal, i.e. whether it is provided per "model" or "machine".
-
Visibility level: Select which Organization Type may view the signal.
-
-
In the Signal Data, select the following signal properties:
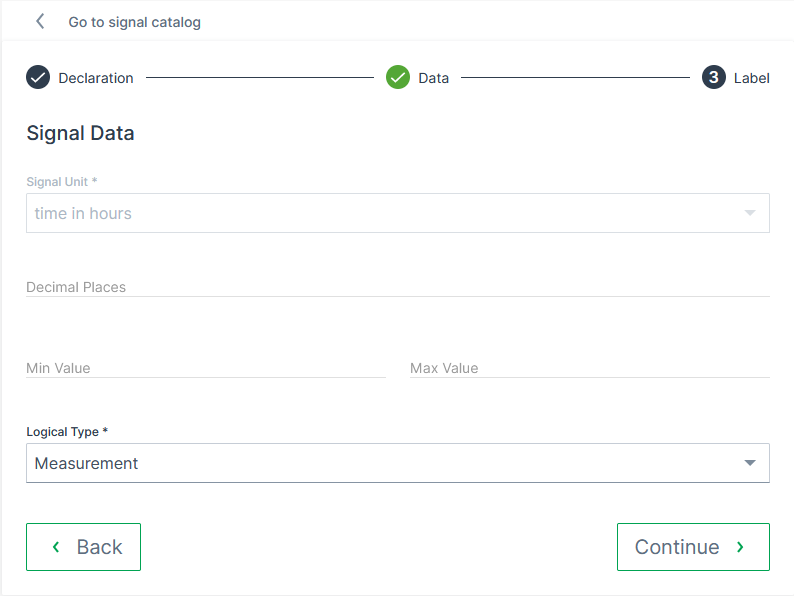
Figure 4: Signal Data -
Signal Unit: Shows the standard signal unit for the selected signal key, e.g.
percent in %ortime in hours. In case of a custom signal key, you must select the unit from the list. -
Decimal places: Enter a number of decimal places to be displayed for the unit.
-
Min. value and Max. value: Enter the valid value range of the signal data.
-
Logical Type: Select how the signal data is represented: Measurement, Counter or State.
-
For Counter, additionally define the Direction.
-
For State, select whether the state value is
enumorboolean. Additionally, define the different states (Label and Value) and in case it represents a Machine error, define the AEMP identifier together with the AEMP Code.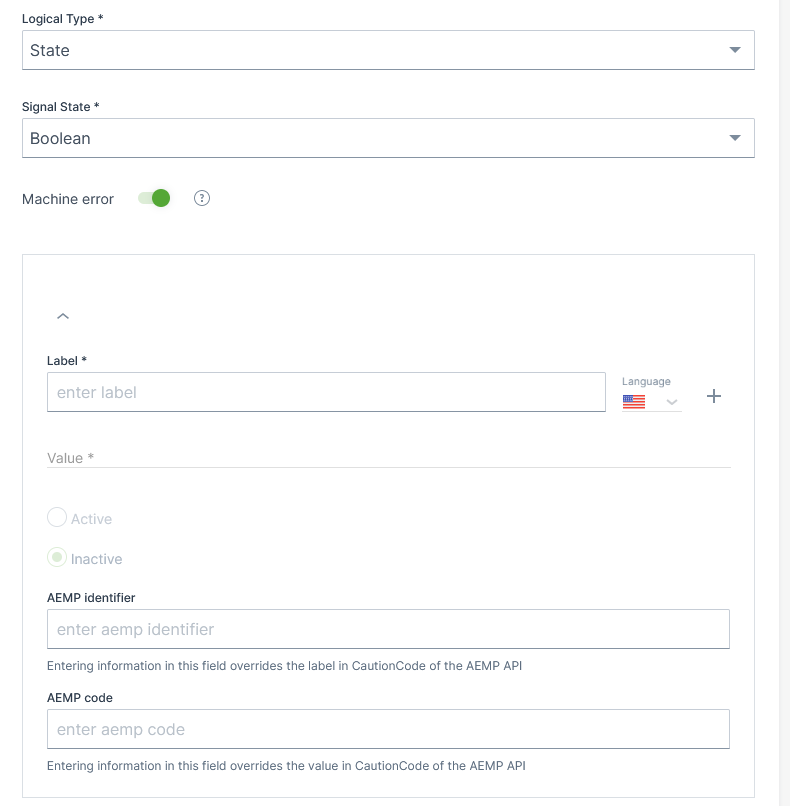
Figure 5: Signal State For information on State Signals, see
<category>in PDC Value Definition.
-
-
-
In the Signal label, enter the translations for Signal label.
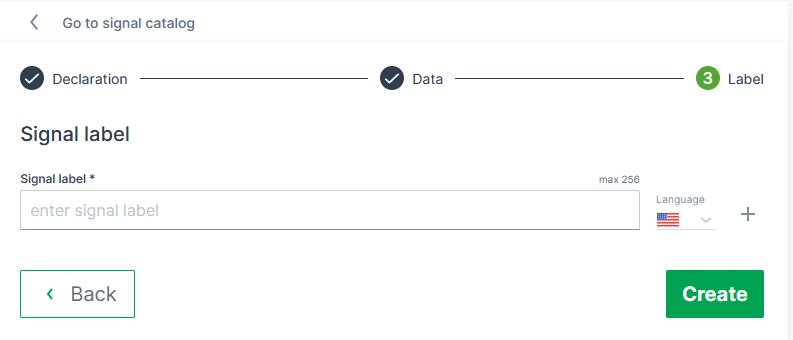
Figure 6: Signal Label -
When finished, click Create to add the signal to the Signal Catalog.
Bind Signal to PDC
In order to bind the created signal to the model, see Create Signal, i.e. to make the signal active, you must add a reference of the signal key in the PDC:
-
Download the PDC file for the respective model as described in PDC Download.
-
Add the reference to the new signals to the
<ValueDefinitions>section by pasting the following line to the tag:<ValueDefinition key="[New Signal Key]" managedByDataPlatform="true"/> -
Add the parsing definitions for the new signals to the PDC, see PDC Parsing Definition.
-
Upload the PDC to the model again as described in PDC Upload.
-
Assign the new version of the PDC to the machines as described in Update machines to a new PDC version.
Adapt PDC
If you intend to make manual changes to the PDC, first download the latest version from the DataPortal. On download, the DataPortal will replace all <ValueDefinition> for signals from the catalog with <ValueDefinition … managedByDataPlafrom=true />. Then you can apply your changes and upload it again.
Note
PDCs with <ValueDefinition> for signals from the catalog instead of <ValueDefinition … managedByDataPlafrom=true /> will be rejected upon upload.
Add new PDC
In case you want to create an entirely new PDC, you may download the PDC Template. In that case add and adjust the required information like uuid, version, Name, Transformers, ParsingDefinition, etc. See PDC Manual.
Warning
Please note that the PDC Builder software is deprecated and no longer working for PDCs with migrated signals. You need to edit the parsing definitions, etc. directly in the PDC file using an XML or text editor software.
View and Edit or Delete Signal Details
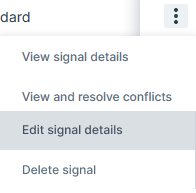
When you open Settings > Machine Data Management > Signal catalog, in the Signal Catalog table, by the end of each signal row the drop-down menu offers the options to:
-
View signal details:
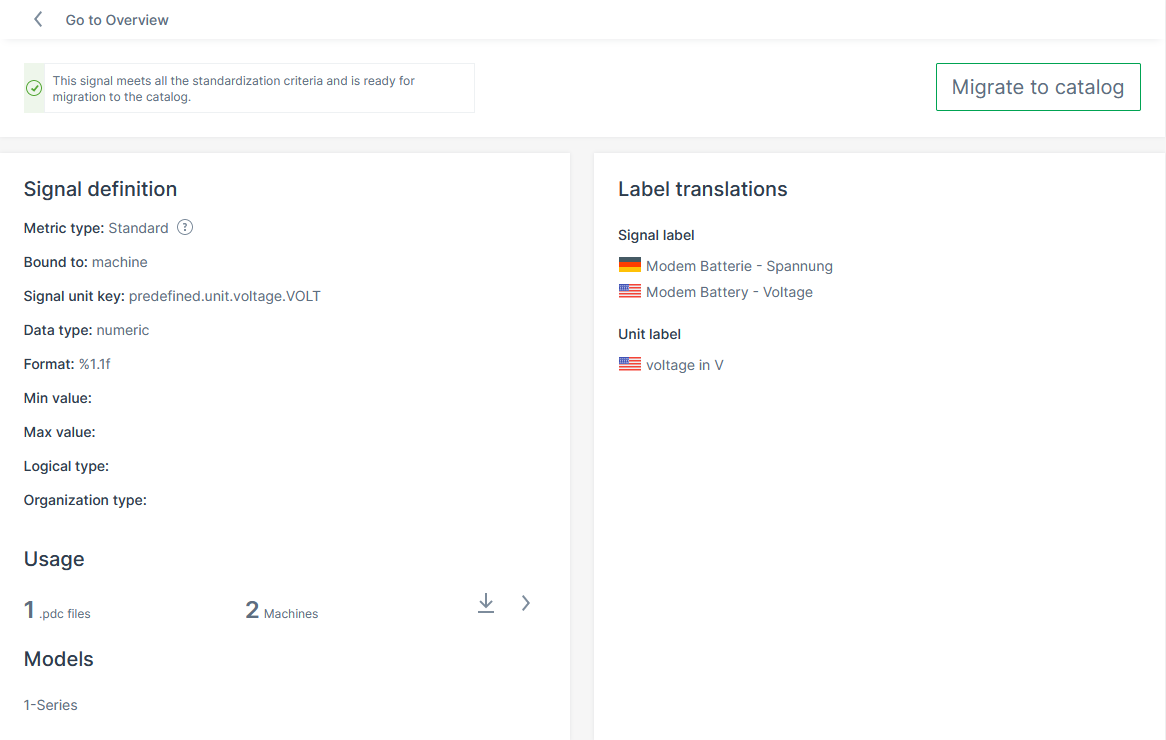
Figure 8: Signal definition details Summarizes the signal properties of the selected signal (for descriptions of the properties, see Create Signal). You can also download the PDCs that include this signals. The following signal properties are also displayed in the signal details:
-
Data type:Shows the type of the signal, e.g.
numeric. -
Format: Shows the defined format for DATETIME, e.g.
HH:MM:SS. -
Permissions: Shows which Organization Type is enabled to view this signal, e.g. "Distributor", "OEM", "Machine Owner".
-
Label translations for Unit label.
-
-
View and resolve conflicts: See Resolve Conflicts.
-
Edit signal details: Allows you to edit the signal definition fields described below, see "Signal details" list below. The Edit signal page offers searchable drop-down menus or selectable check boxes that ensure to select only valid values for the signal key label, unit and format and other options.
-
Delete signals: The Delete signal option is disabled (greyed out) if the signal is currently in use by one or more PDCs, or if it is not present in the catalog. Please verify the signal's usage and catalog status before attempting to delete it. A corresponding message is displayed in the DataPortal when attempting to delete a signal, see screenshot:
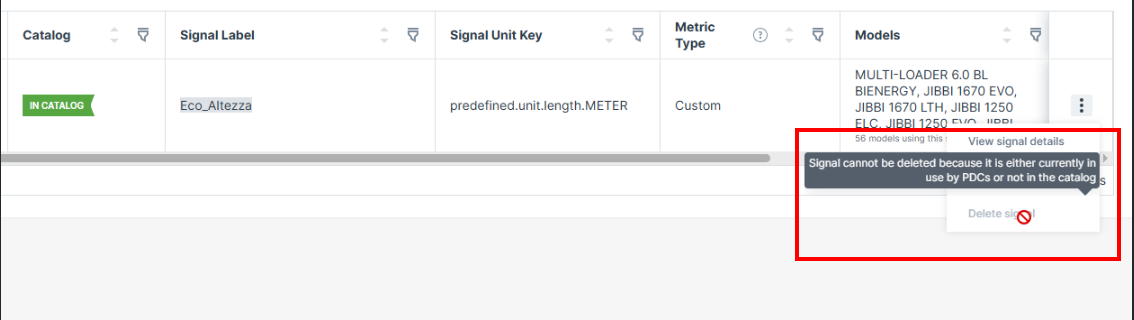
Figure 9: Delete Signal
Resolve Conflicts
Signals that have conflicts cannot be migrated immediately, for example, when the same signal uses different units in different PDCs, e.g. meter and kilometer. The conflict icons in the Signal Catalog table and details indicate the signal definition values with conflicts:
You can migrate the signals with conflicts by resolving the conflicts as described below. A summary of frequently occurring migration conflicts and how to resolve them is described in Migrate signals with conflicts in the Migration Guide for the Signal Catalog.
How to Resolve Conflicts - Sample
To resolve the conflict(s), proceed as follows.
-
Click the View and resolve conflicts button to open the Conflicts View.
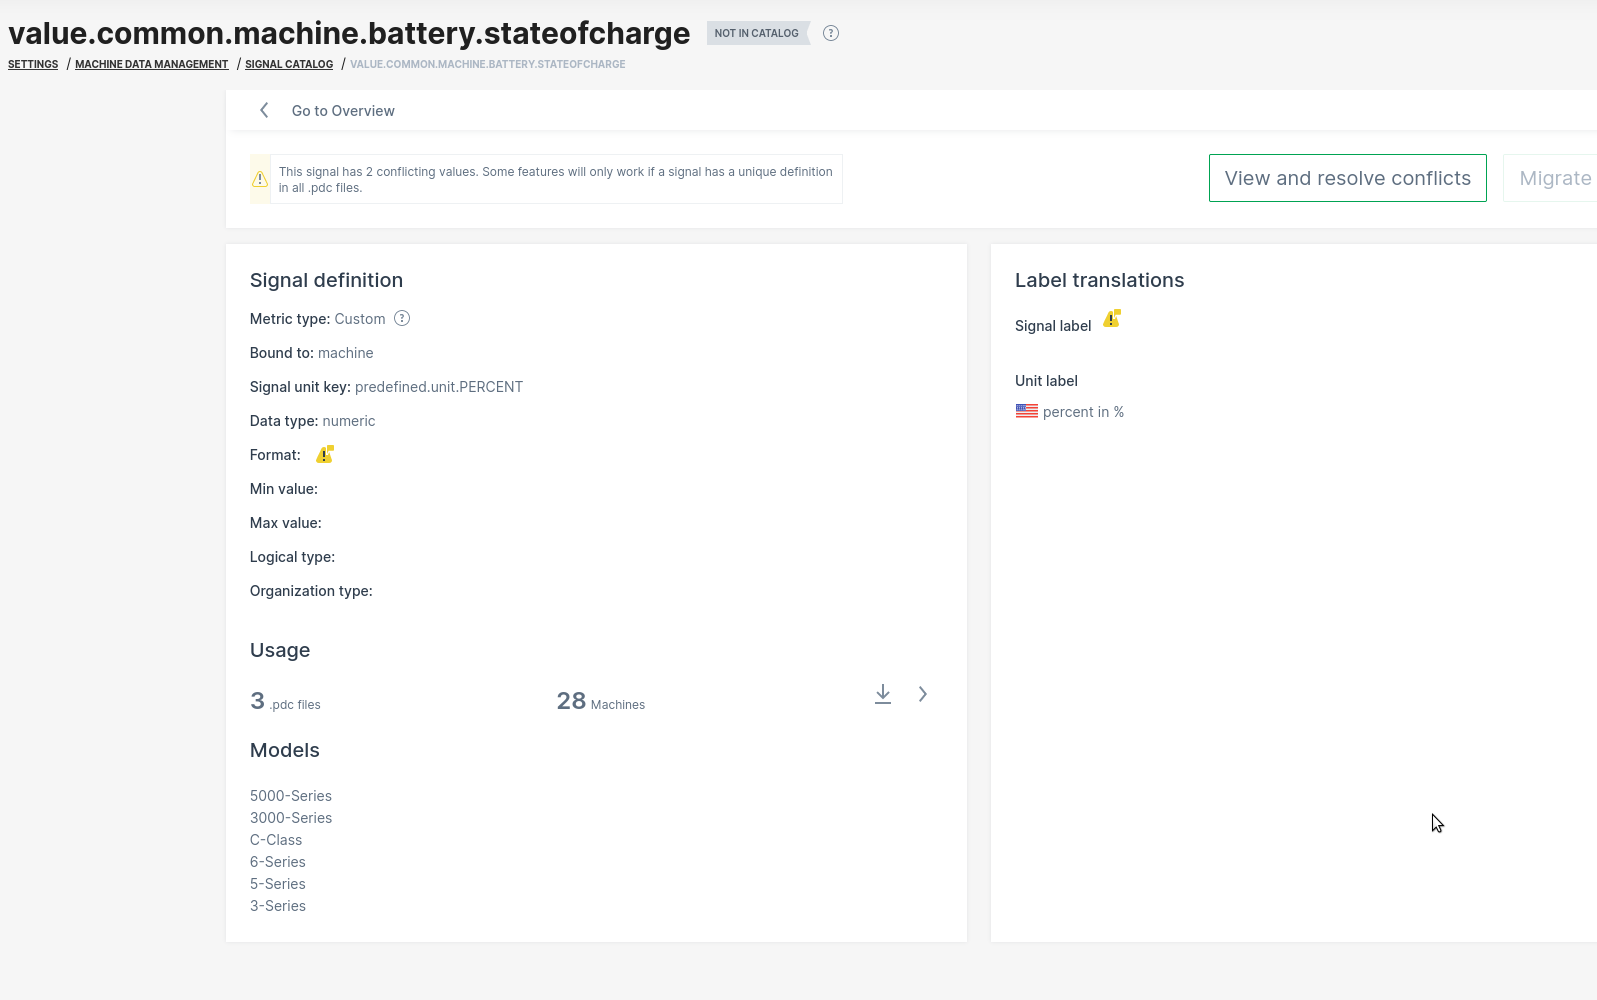
Figure 12: Signal conflict details -
In the Conflicts View, a "Summary of conflicting values" is shown. Click on the Resolve conflicts to start the conflict resolution.
Note
This is only available for signals without states.
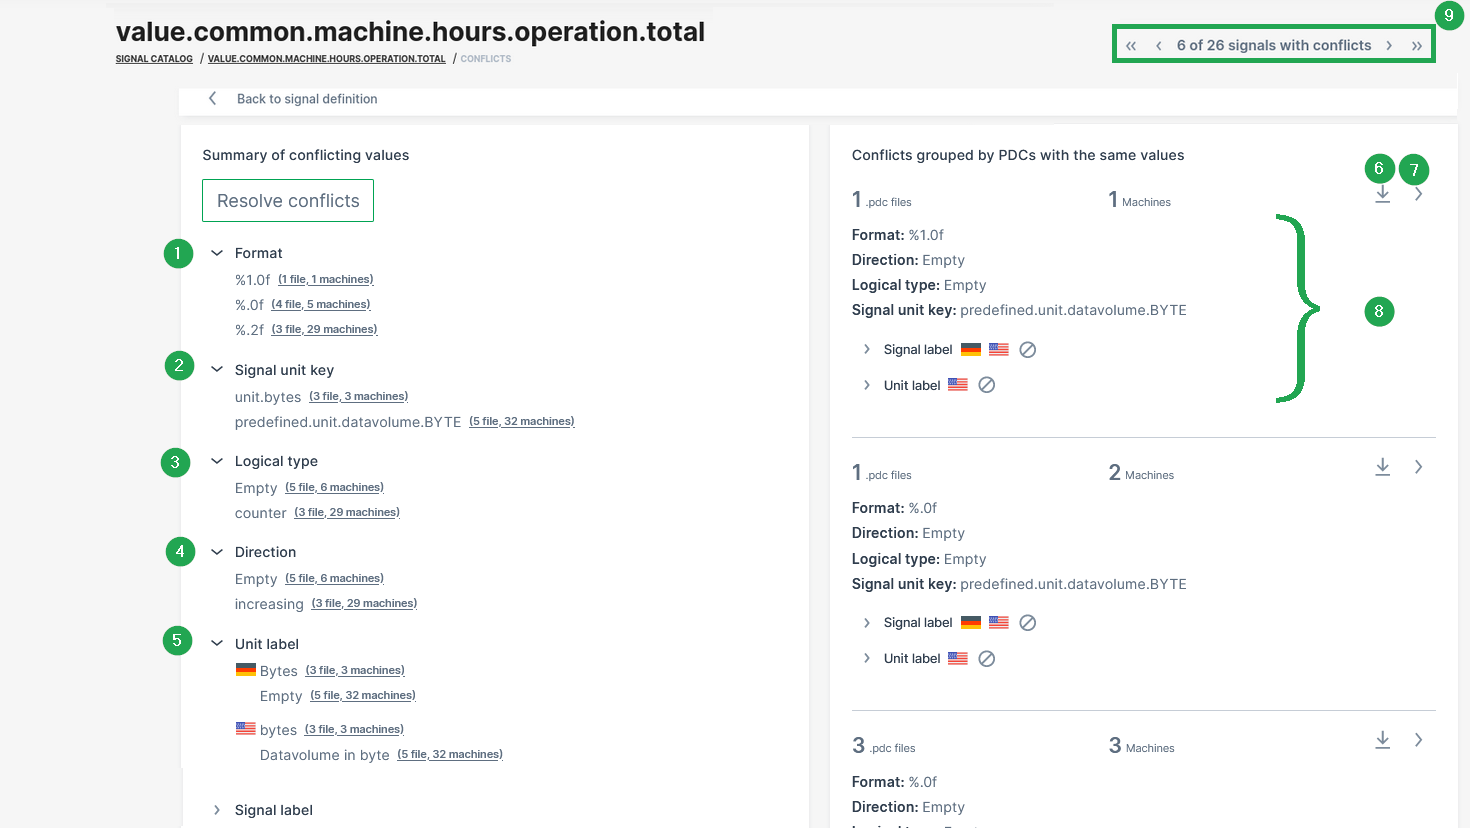
Figure 13: Conflict details # Item Description Summary of conflicting values 1 Format Maximum number of decimals is different across the PDCs. 2 Signal unit key The signal unit key is different across the PDCs. 3 Logical type There are 3 PDCs with no logical type defined. 4 Direction There are 5 PDCs with no direction defined. 5 Unit label There are 5 PDCs with not signal unit label defined and there is a variation with the spelling. Other conflicting values might be: Signal label There is a wrong unit label configured. Custom Units There is a conflicting custom unit. Resolve it by selecting one of the predefined units from the list of standard signals (not from PDC). Permissions The assigned access permissions for this signal are not aligned. Conflicts grouped by PDCs with the same values 6 Conflicts per PDC Summary of the conflict related parameters for the specific PDC file. 7 Download of PDC Option to download the affected PDC file in xml format. 8 Details See further version details of this PDC. 9 Navigation Navigation through all signals with a conflict. -
In the Resolve conflicts view, select the correct value for each signal property that is listed in this conflict view, e.g. "Signal unit key", "Format", "Signal labels" as shown in the following image.
Note
The selected values are stored in the signal catalog and effectively overriding all conflicting definitions in PDCs.
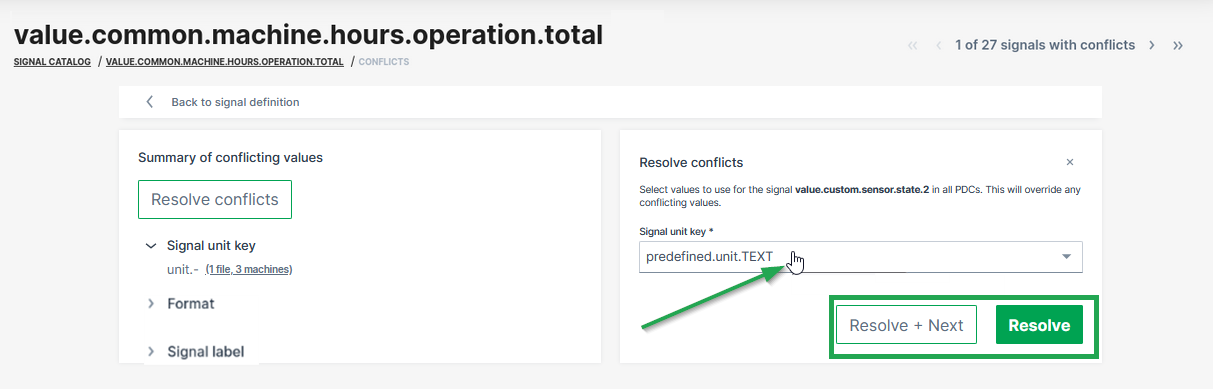
Figure 14: Resolve conflicts -
Proceed as follows:
Resolve + Next Resolve Click Resolve + Next to resolve this signal and go to the next conflict. A new dialog window opens to confirm this update and automatically migrate the signal to the catalog and proceed with the next conflict: Click Resolve to resolve the current conflict. A new dialog window opens to confirm this update and automatically migrate the signal to the catalog: 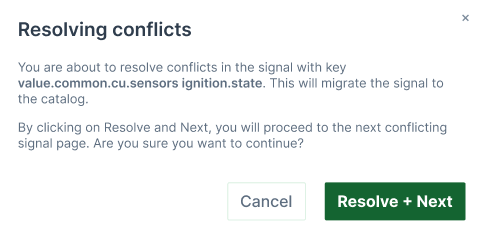
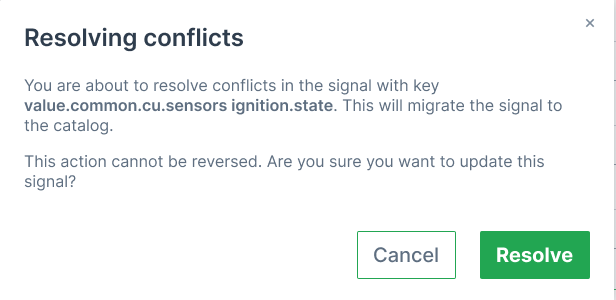
You will be then forwarded to the next signal. Note that you can navigate through the signal conflicts using the navigation buttons in the top-right corner. You will be then forwarded to the Overview of all Signals.
Efficiency Definitions
Note
The functionality explained here is an enhancement of the Efficiency widget that has been deprecated, resp. reworked to Efficiency Snapshot and Efficiency History widgets.
Efficiency enables machine owners to calculate and track efficiency for individual machines or for your fleet. The functionality enables the following:
-
Compare efficiency for individual machines or an entire fleet
-
View efficiency for an individual machine or an aggregated set of machines (i.e. organization)
-
Visualize the data as a chart, graph or table.
Note
This feature requires the availability of counter values of work and idle signals/keys on the machine
The total time of these signals is used for calculating the efficiency
More information about the signal keys can be found in the chapter Counter Guard Signals within the Standard Metrics Documentation.
Requirements
The Efficiency Definition can be configured by a tenant, typically the OEM
For more information, see Tenant.
The required permission set is Organization:Admin to edit and delete sets of metrics used in efficiency definitions, see Organization Subject.
Configure Efficiency Definitions
We begin by creating an efficiency definition. You can do this by selecting Settings > Machine Data Management> Efficiency Definitions and clicking on the Create New button in the top right corner to open the configuration dialog.
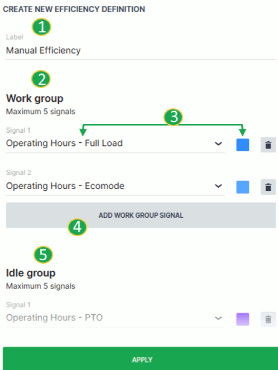
| # | Item | Description |
|---|---|---|
| 1 | Label | Definition title. |
| 2 | Work Group | Signal group that will be calculated for the active operation state of the machine. |
| 3 | Signal and Color | Signals chosen as part of the work group. Color designation of the signal. |
| 4 | Add Signal | Increase the number of signals used in the group. |
| 5 | Idle Group | Signal group that will be calculated for the inactive operation state of the machine. |
Once you have configured the efficiency definition, click the Apply button at the bottom of the dialog. You can now see the newly created definition available from the Efficiency control panel.
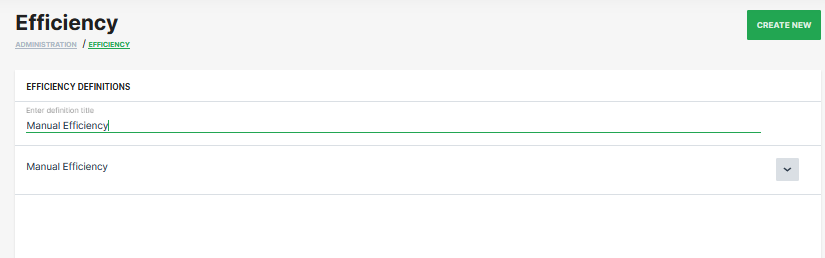
Machine Share Definitions
Machine Share Definitions allow you to categorize the machine shares. In the Machine Share Definitions page you find an overview of the Shares count.
Requirements
The Machine Share Definitions can be configured by a tenant, typically the OEM. For more information, see Tenant.
The required permission set is Organization:Maintain to use the Machine Share Definitions feature, see Organization Subject.
Note
The Machine Share Definitions feature is only available if the feature to share a machine is enabled. To share a machine, read Share Machine functionality.
Configure Machine Share Definitions
To create a Machine Share definition, open Settings > Machine Data Management > Machine Share Definitions and click Create New.
To edit Machine Share Definitions, click in the row of a Machine Share Definition.
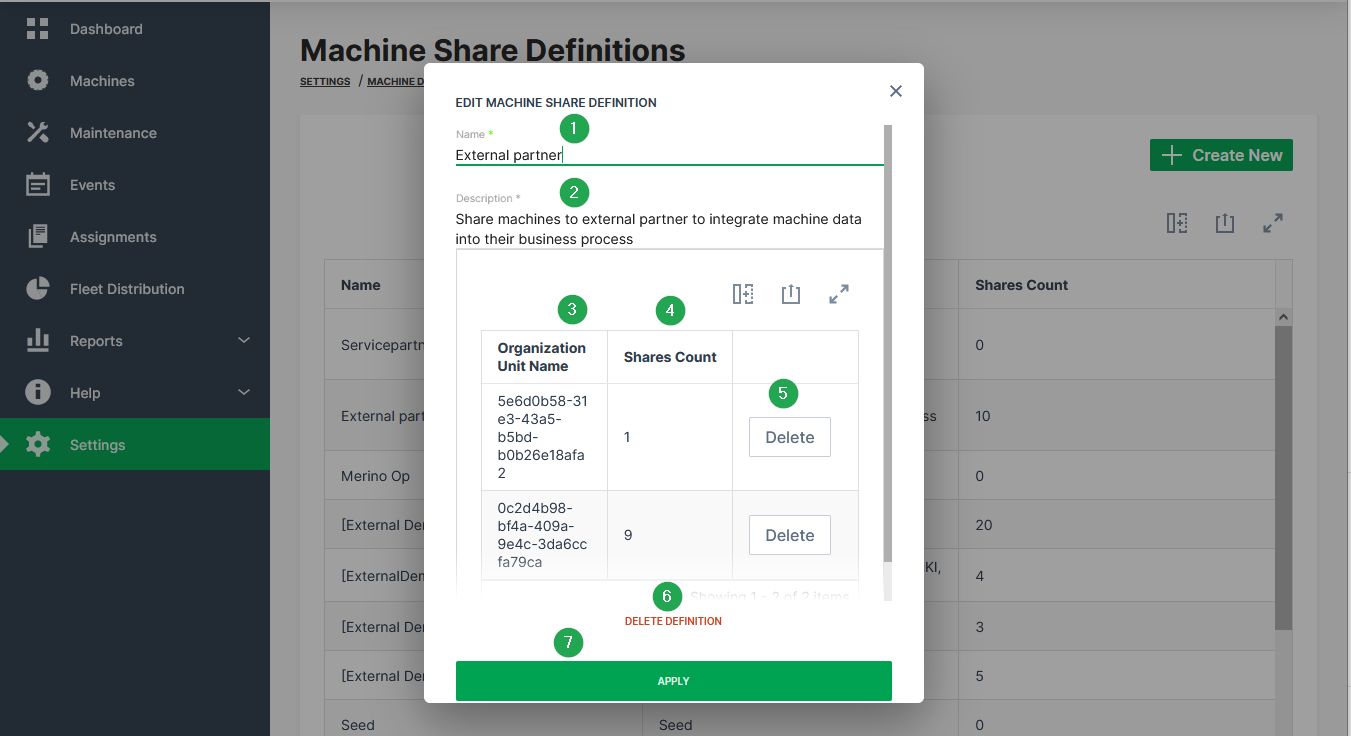
| # | Item | Description |
|---|---|---|
| 1 | Name | The label for the share definition. |
| 2 | Description | The description of why the share exists. |
| 3 | Organization Unit Name | These are the organization units where machines with the open share definition are shared to. |
| 4 | Shares Count | The number of shares within the organization unit. That means the number of times the definition has been applied to a machine. |
| 5 | Delete Definition | Remove the definition from the DataPortal and cancel all Machine Shares that use this definition. |
| 6 | Waste Basket | Remove all share permissions for the organization unit at once. |
| 7 | Apply | Save the share definition and add it to the list. |
Commission Date
The Commission Date is the date when the machine is handed over to the owner who will operate the machine. It can be edited within the Manage Machine window and can be displayed in the table of the Organization Structure Overview if you have added the column to your table.
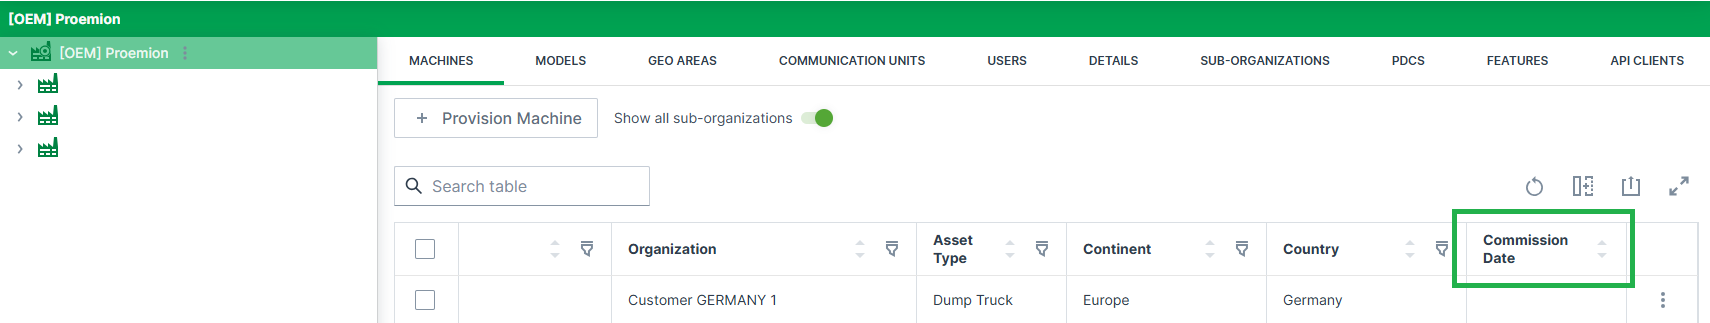
To edit the Commission Date the Machine:Admin Permission Set is required.
To do so, proceed as follows:
On the Machine Page, select the machine you want to manage and click the Manage Machine vehicle button in the top-right corner.
This opens the Manage Machine window.
-
Select Commission Date from the menu.
-
Select a Commission Date and click Set.
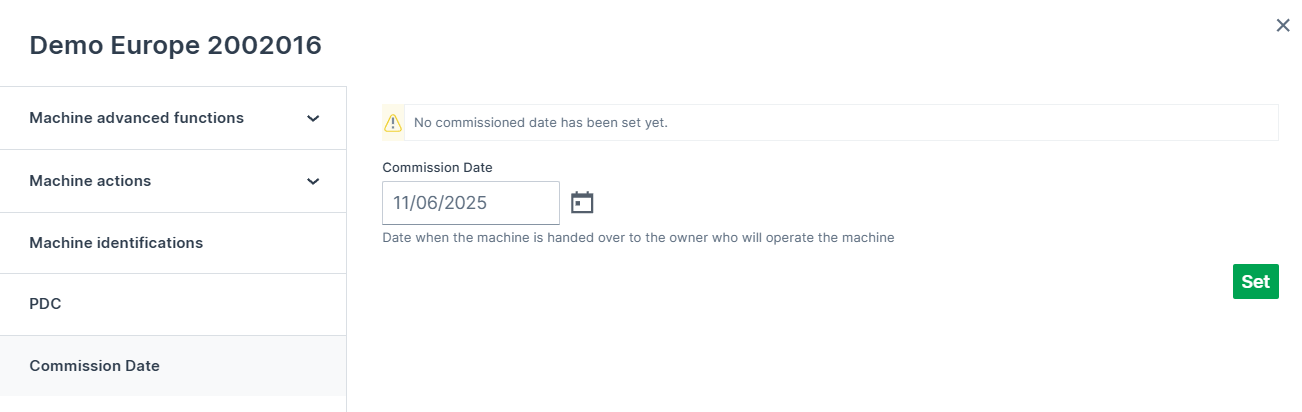
Figure 2: Edit Commission Date
The defined Commission Date will now be displayed in the table.
Communication Units Management
Firmware and Configuration Updates
In the Firmware and Configuration Updates menu, you can monitor the installed firmware and configuration versions of the communication units (CUs) within the entire organization tree and update them.
Go to Settings > Communication Unit Management > Firmware and Configuration Updates.
The Machine Status Update table shows you the CUs and their firmware/configuration version and update status, their machine model and organization and other information.
The table is the starting point for:
-
(1) Summary of the percentages of communication units updated to the latest available firmware version, grouped by machines from the same device family.
Note
The summary only applies to communication units that have been updated within the DataPortal. Manual updates outside the DataPortal are not covered.
-
(2) Firmware Updates/Mass FOTA (firmware-over-the-air)
-
(3) Configuration Update/Mass COTA (configuration-over-the-air)
-
(4) CODESYS Update/COTA (for CANlink® mobile 10000 devices)
-
(5) It allows to search, sort and filter to identify machines.
You may toggle different columns in the table, see Filters for an overview of all columns.- In the column Firmware Version, you can view the communication units updated to the latest firmware version (highlighted cells).
-
(6) The Details allow to view details of a selected CU and perform single Firmware Updates and Configuration Updates.
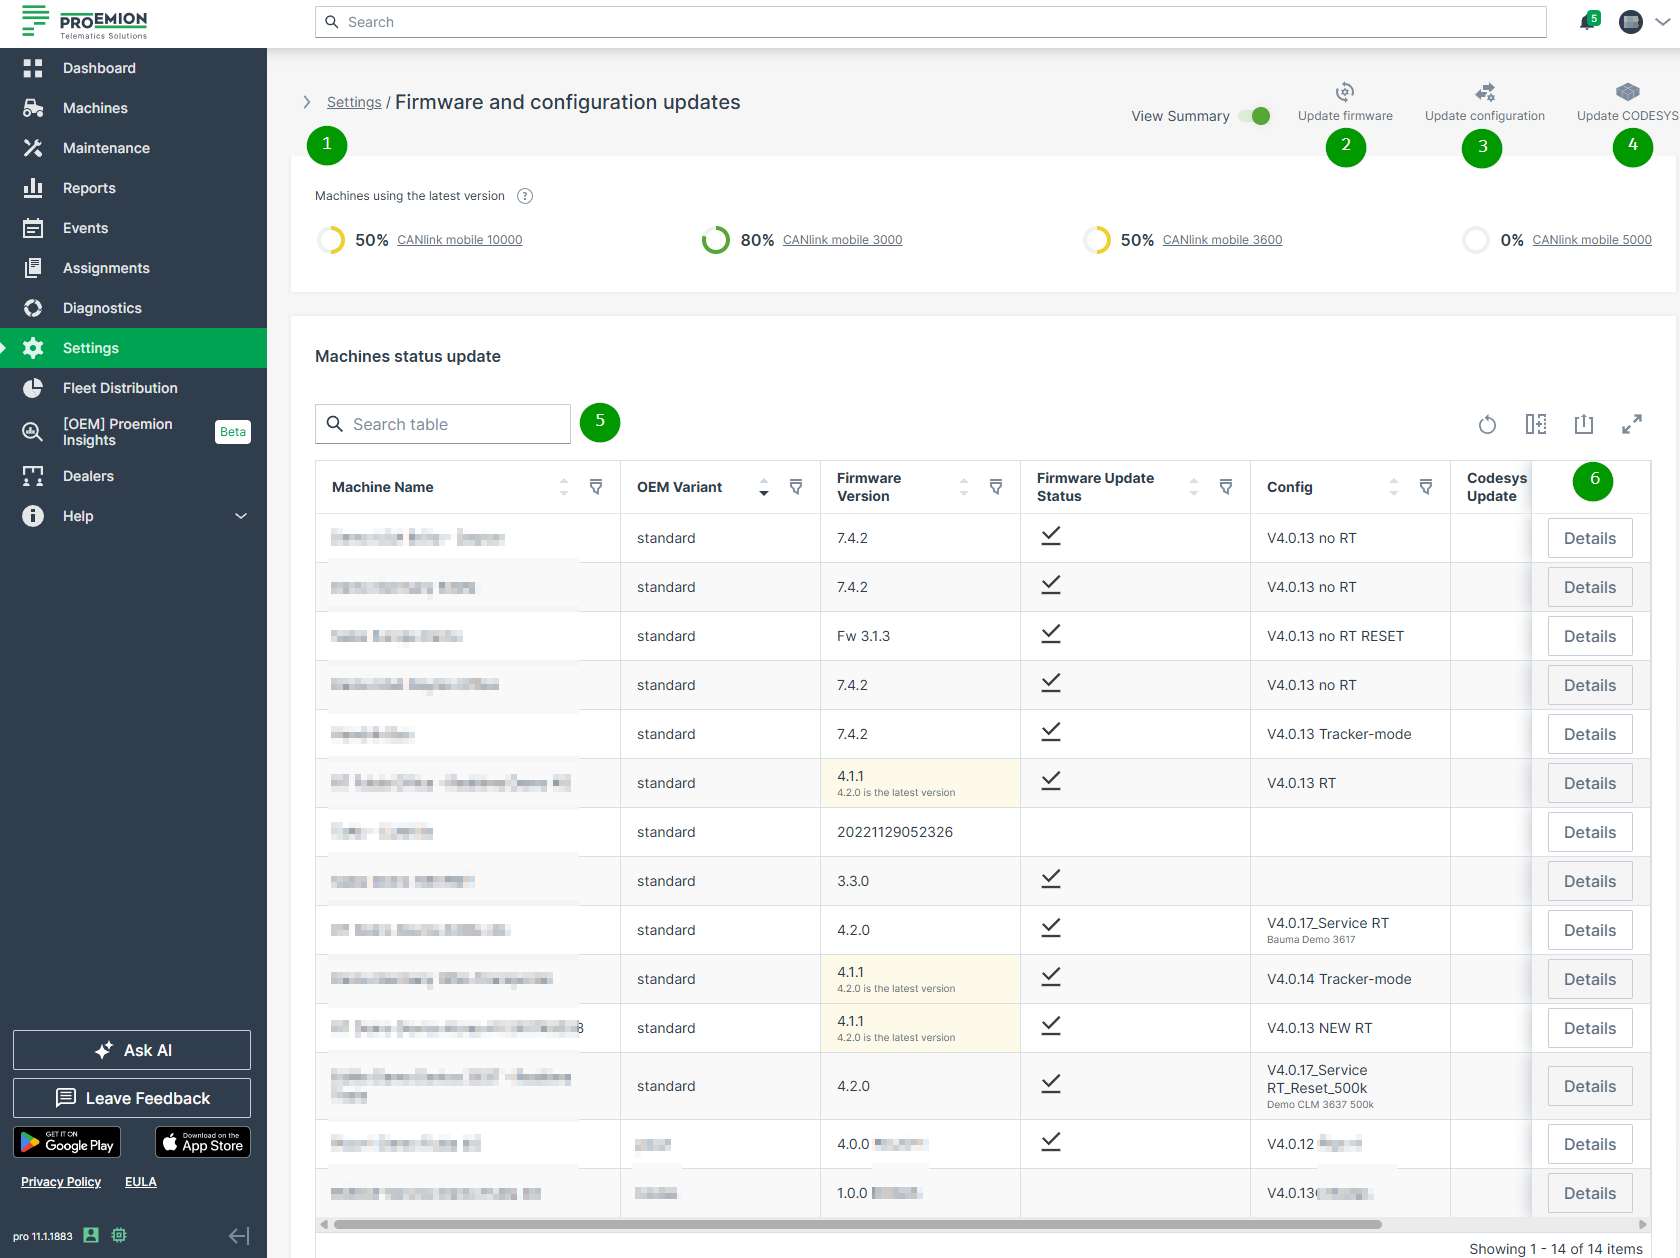
Requirements
In order to access Settings > Communication Units Management > Firmware and Configuration Updates within the DataPortal, the following permissions are required, see also permission sets:
-
Admin:Machine (to view the Firmware and Configuration Updates table)
-
Maintain:Models
-
Maintain:Organizations
Note
Before performing a remote firmware or configuration update, refer to Safe Remote Updates Guideline first.
Filters
To filter the Machine Status Update table, use the ![]() filter icon displayed in each column header.
filter icon displayed in each column header.
You can export the table via the ![]() export icon. When filters are set, they will be applied also for the exported content.
export icon. When filters are set, they will be applied also for the exported content.
Note
In the table, all parameters are displayed. In order to keep the table as compact as possible, you can toggle the columns as desired which will be saved for the next session.
| Table Column | Description |
|---|---|
| Machine name | Machine names. |
| Serial number | Serial number of the machine. |
| Model | Display of the model name. |
| Product code | The product codes of the communication units. |
| CU Series | The type of the commumnication unit (CU). |
| OEM Variant | The variant type of the CU. Example values: standard, plus1, bodas, noFota |
| Organization | The organization unit the machine is assigned to. |
| Firmware Version | Shows the currently installed firmware version and if it is the latest available version. |
| Firmware Update | The firmware version that is in process according to its Firmware Update Status. |
| Config Update | The configuration version that is in process according to its Configuration Update Status. |
| Firmware Update Status Configuration Update Status CODESYS Update Status |
The current status of the update is shown here The following states are possible shown with different icons regarding the installation process of the update |
Pending (Transfer Pending)  The transfer for the new version was requested for the selected machine and is ready to be transferred. When the machine is online, the transfer then starts and runs automatically in the background. When the machine is offline, the transfer remains pending |
|
Updated (Success)  The new version was deployed successfully |
|
In Progress (Flash pending)  The transfer for the new version was successful, but the device hasn't confirmed the deployment yet. |
|
Cancelled  The transfer for the new version was cancelled |
|
Error  The transfer for the new version failed. This status may also appear when the selected machine was updated already. |
|
| Config | Current configuration version. |
| CODESYS Update | The CODESYS version that is in process according to its CODESYS Update Status. |
| Details | Click in the last column to open the Machine Updates Details. |
Firmware Updates/Mass FOTA
The DataPortal allows to update one or more CUs via FOTA.
-
Go to Settings > Communication Unit Management > Firmware and Configuration Updates.
-
Click
 Update firmware.
This enables the selection of machines. -
Select the desired Machine:
Note
Only machines that can be updated together can be selected in the table, i.e. if they are of the same type, of the same OEM variant and have a similar product code; others are greyed out.
You can use the Filters for the Machines Status Update table to narrow down the selection of available machine(s):
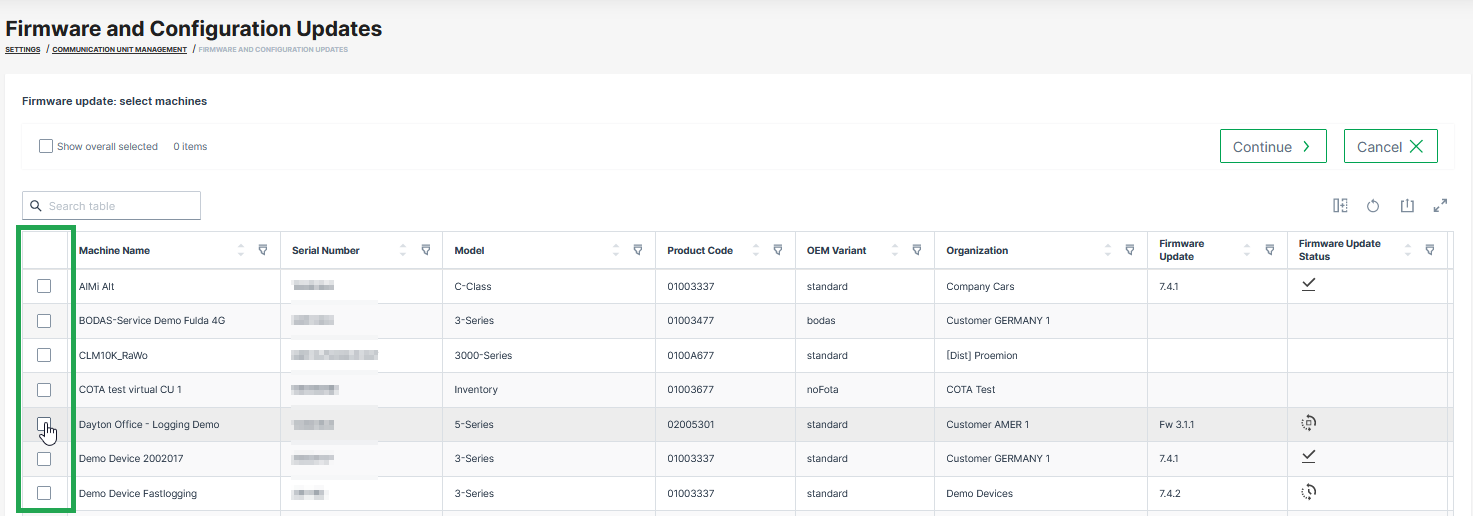
Figure 2: Select machines for firmware updates When selecting a machine, the selection will be narrowed down to other eligible machines that can be updated together with the selected machines, too:
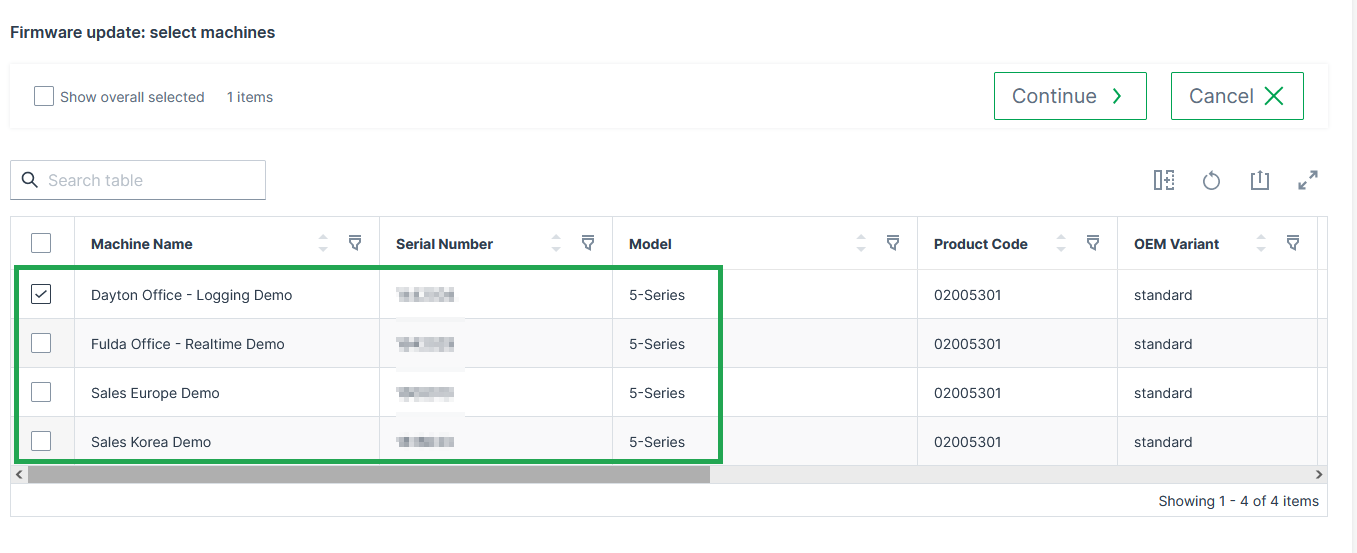
Figure 3: Select other machines for firmware update -
Select Continue.
The Select firmware page opens. -
Select the desired firmware version to be installed.
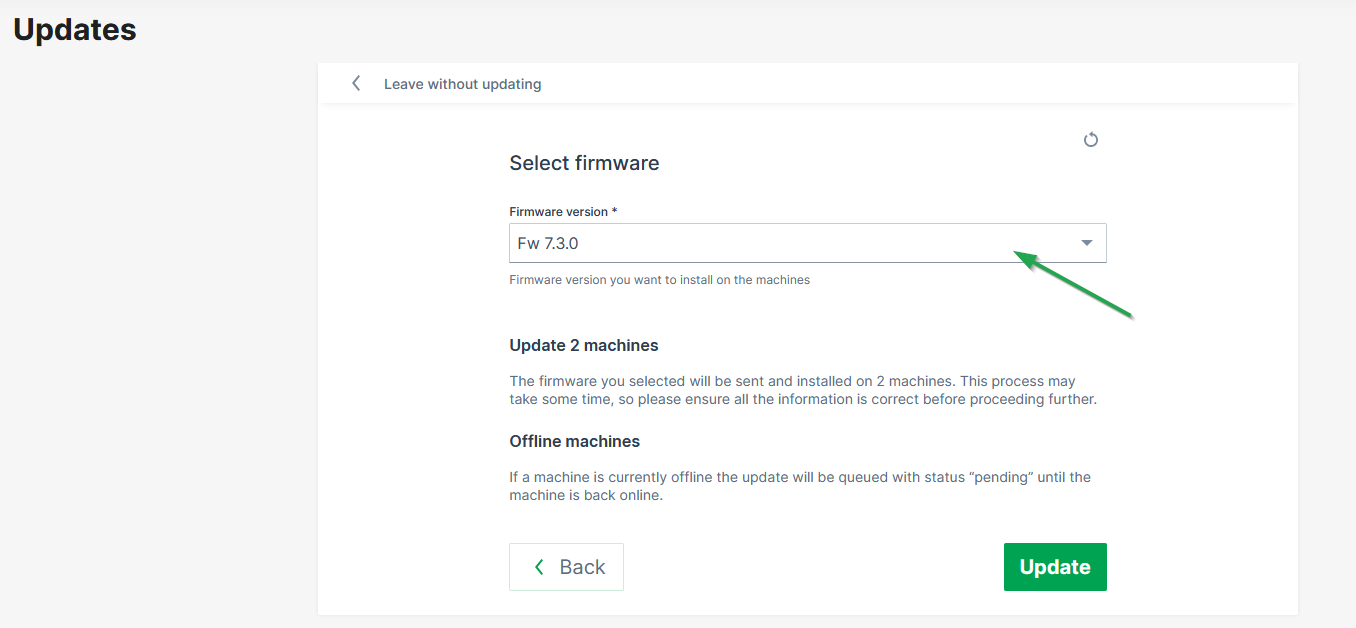
Figure 4: Select firmware versions Note
If a machine is currently offline the update will be queued with status "pending" until the machine is back online.
The firmware update will be cancelled after 120 days if machine stays offline. -
Click Update to start the update of the firmware on the selected devices.
✓ The firmware update runs in the background. When successful, the firmware update status (icon) will be updated.
Configuration Update/Mass COTA
The DataPortal allows to update one or more CUs via COTA.
Use the Filters for the Machines Status Update table to narrow down the selection of available machine(s):
-
Go to Settings > Communication Unit Management > Firmware and Configuration Updates.
-
Click Update configuration
 .
.
This enables the selection of machines. -
Select the machines where the new configuration needs to be installed.
Note
Only machines that can be updated together can be selected in the table.
You can use the Filters for the Machines Status Update table to narrow down the selection of available machine(s).
-
Click on Continue.
Note
In case that there is no configuration bundle with a matching product code available, the following message will be displayed: There are no configurations matching the product code of these machines. You can upload a new configuration from the communication unit configuration page.
-
Select a Bundle and Configuration Version.
-
Read the summary carefully and click on Update.
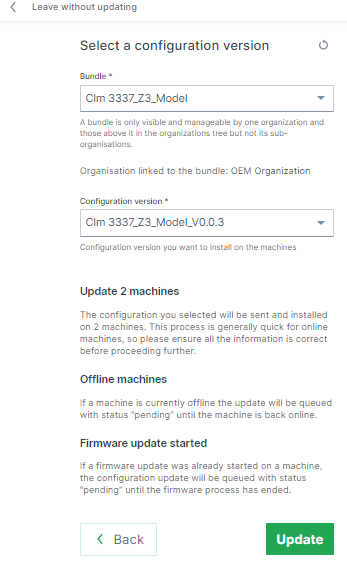
Figure 5: Summary Note
If a machine is currently offline the update will be queued with status "pending" until the machine is back online
The configuration update will be canceled after 120 days if machine stays offline.
✓ The new configuration file is uploaded to the communication unit.

Warning
If a configuration update failed, the value cota_update_failed may appear in the configuration version.
Machine Updates Details
In the Firmware and Configuration Updates menu you can also obtain details on a specific machine, or start the firmware update for the selected machine
-
Go to Settings > Communication Unit Management > Firmware and Configuration Updates.
-
Click Details by the end of each machine row in the Machine Status Update table
The following information will be displayed: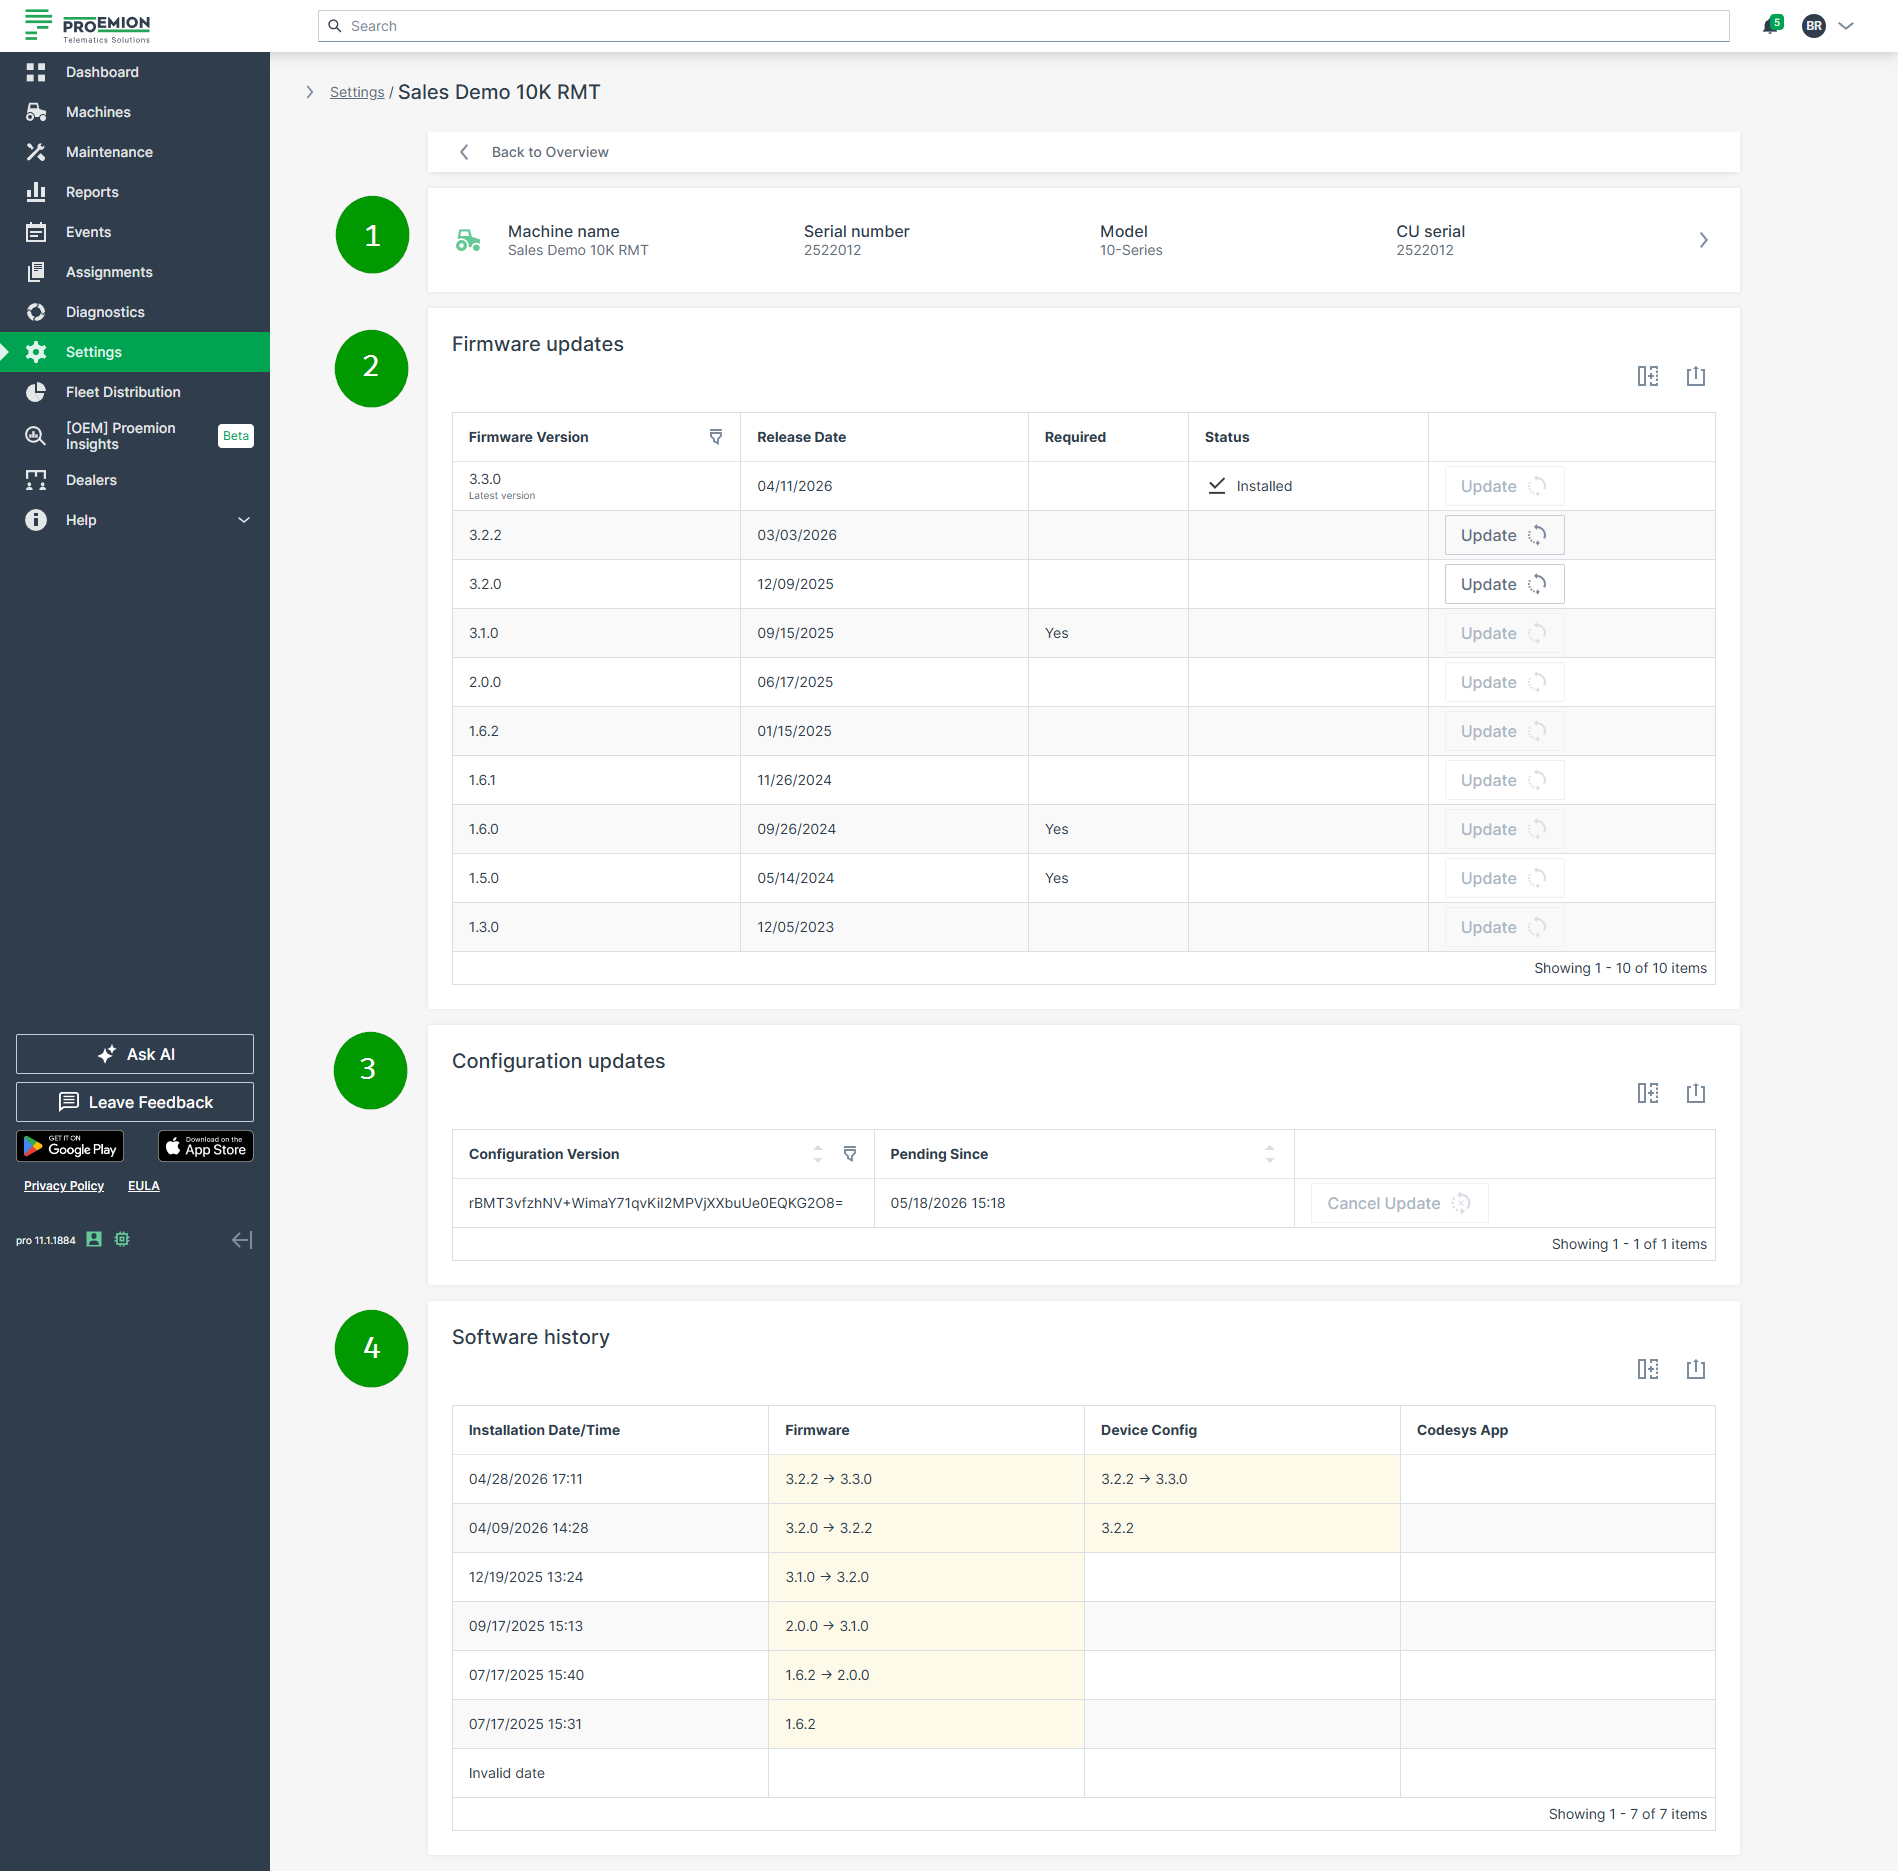
Figure 7: Firmware and Configuration Updates Details for selected machine Item Description 1 CU details. The link forwards you to the Machine Page. 2 Firmware Updates show the available and/or required firmware versions for the selected machine.
NOTE: If a configuration update failed, the valuecota_update_failedmay appear in the configuration version.3 Configuration Updates show the available configuration versions for the selected machine. 4 Software history for both the last firmware and configuration versions. For CANlink® mobile 10000 devices the Codesys App column is also available for display the app version history.
Firmware Updates
To update the selected CU with a specific firmware version in the Details view, select Update in the row of the desired firmware version
(Go to Settings > Communication Unit Management > Firmware_and_Configuration_Updates > Details > Firmware Updates to the view the Update button.)
In case that the latest firmware is already installed, the message No updates available will be displayed in the Firmware Updates section:

Required Firmware Versions
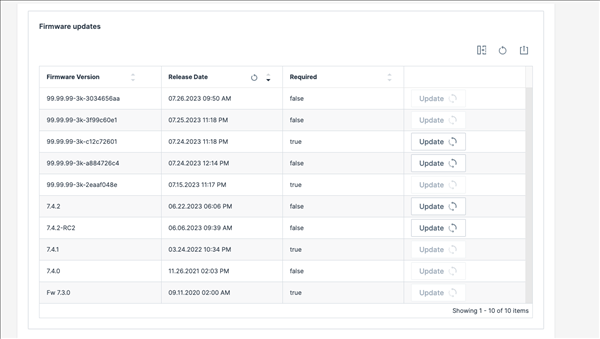
The Update button is shown only for allowed firmware versions.
In case a firmware version is marked as "Required", you have the following options:
-
Update to the "Required" firmware version first, then you may update the subsequent versions.
-
Update to the Firmware version after a required version, if the required version is already installed (up to the next required one).
-
Update to the Firmware version before a required version, if the required version (or a higher version) is not installed yet.
- Example: If the firmware versions "2" and "5" are marked as required, updating from firmware version "1" to "3" (optional) won't work because "2" is required
But updating from firmware version "2" to "3", "4" or "5" will work.
- Example: If the firmware versions "2" and "5" are marked as required, updating from firmware version "1" to "3" (optional) won't work because "2" is required
-
Downgrade from a version marked as "required" to an earlier version is not possible, e.g. from "2" (required) to "1".
For an update of the machines by selecting the firmware versions first, refer to Firmware Management.
Configuration Updates
To update the selected CU with a specific configuration version in the Details view, select Update in the row of the desired configuration version.
(Go to Settings > Communication Unit Management > Firmware_and_Configuration_Updates > Details > Configuration Updates to view the Update button.)
Cancel Configuration Update
As long as the status of the transfer is still pending, it is possible to cancel the update
Proceed as follows
-
Click Cancel Update (the Update button changes to Cancel Update):
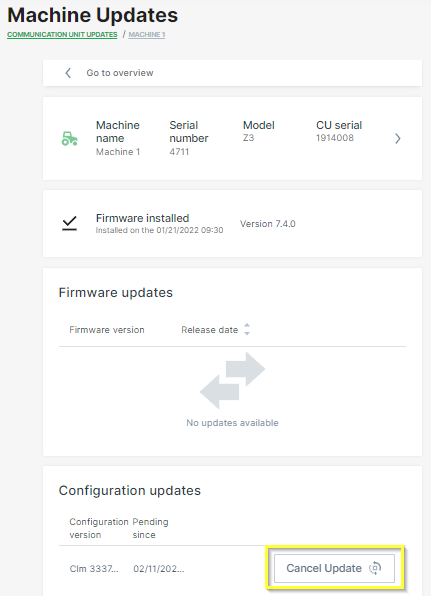
Figure 10: Machine Updates details page -
Read the notification and confirm by clicking again Cancel Update.
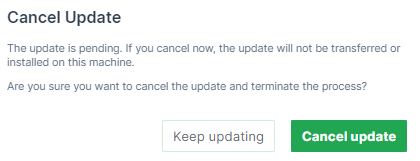
Figure 11: Cancel Confirmation ✓ The configuration update is cancelled. To double-check, refer to the Communication unit Updates overview.
Software Version History
The Software Version History section provides a combined overview of firmware and configuration changes that were installed on the selected communication unit over time.
The table displays the firmware, configuration and CODESYS application history of the selected communication unit in chronological order.
The following information is displayed:
| Column | Description |
|---|---|
| Installation Date/Time | Date and time when the update was installed on the communication unit. |
| Firmware | Shows the firmware version change history. |
| Device Config | Shows the configuration version change history. |
| CODESYS App | Shows the CODESYS application version change history for CANlink® mobile 10000 devices. |
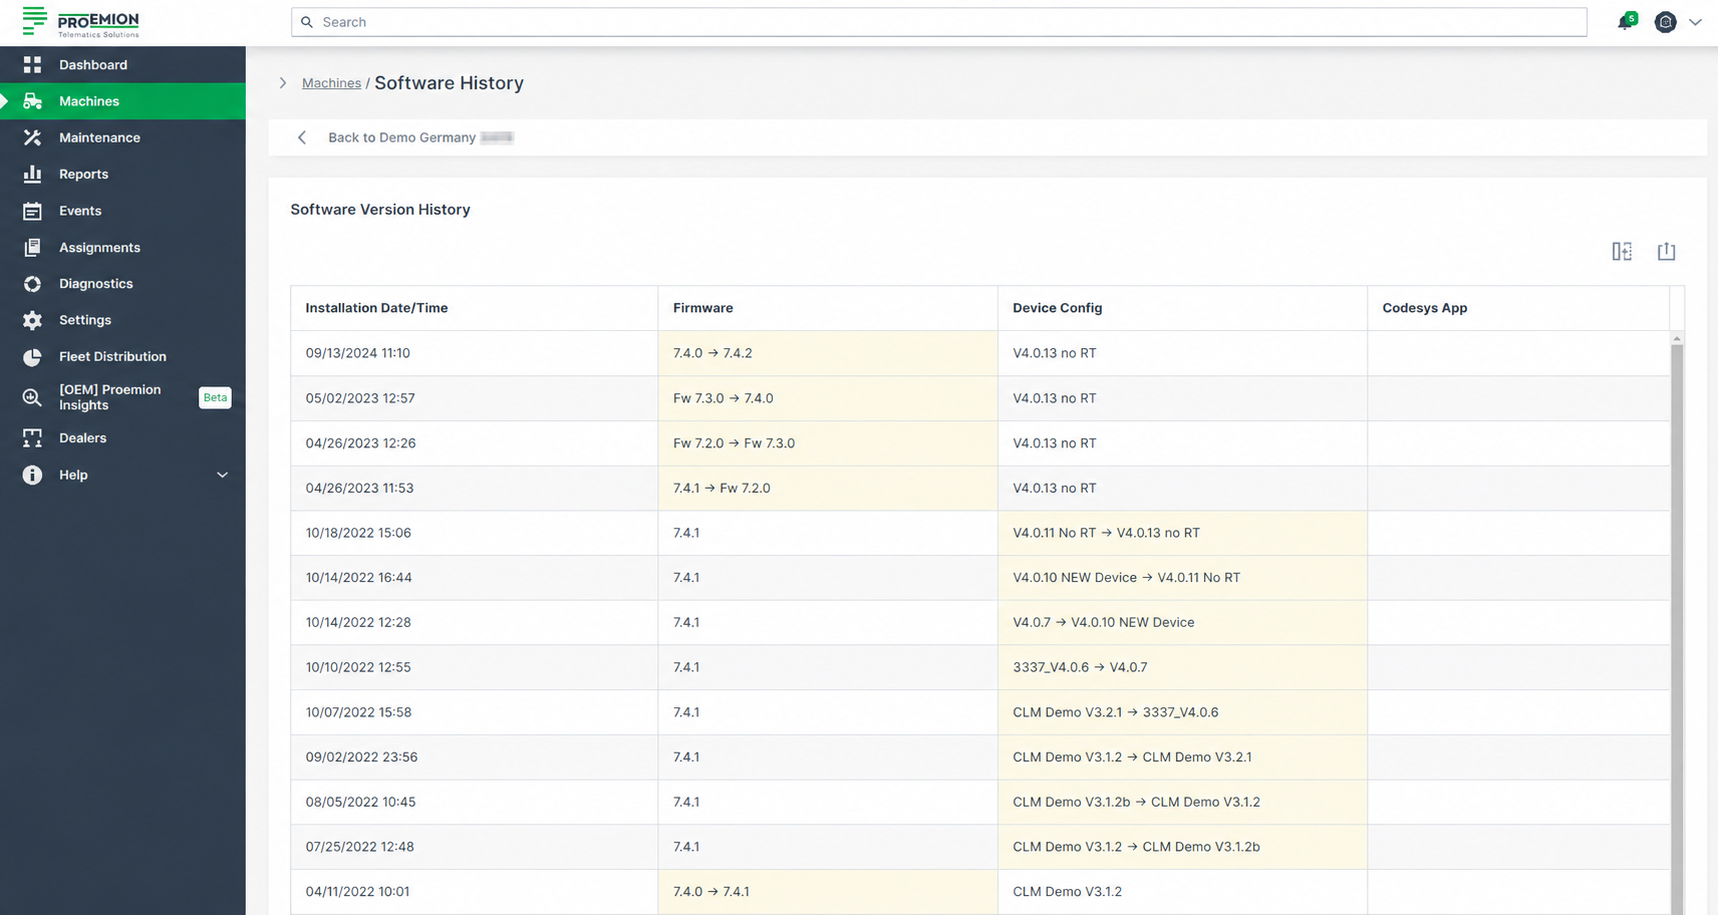
Firmware Management
The Firmware menu lists the currently available firmware versions for your machines and allows to update the new firmware versions (firmware over the air - FOTA).
Go to Settings > Communication Unit Management > Firmware.
Note
You can check the status of the firmware version for each machine in the Firmware and Configuration Updates:

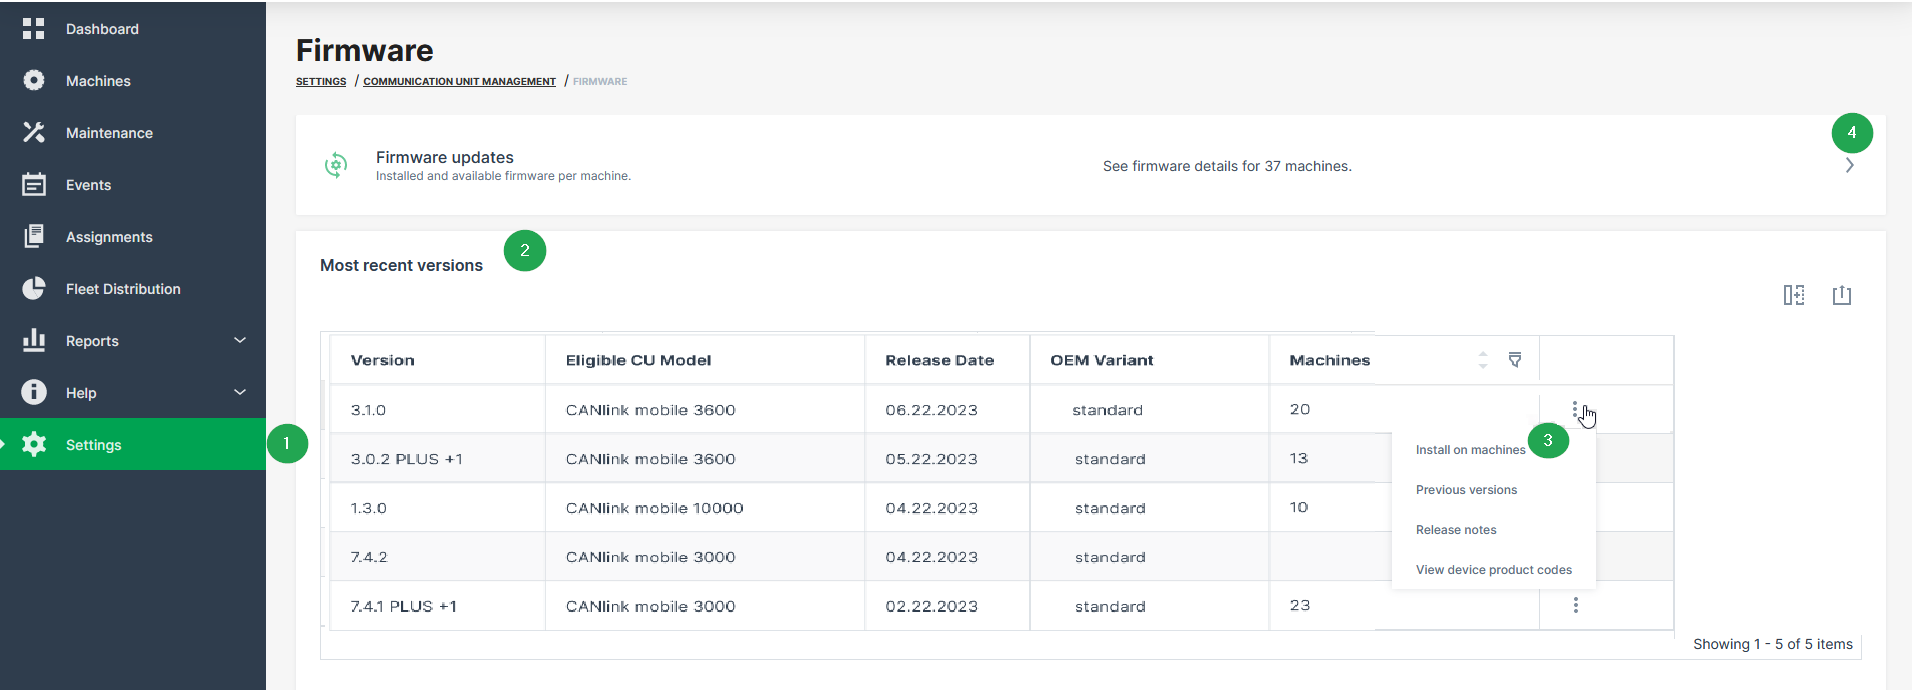
| # | Description |
|---|---|
| 1 | Firmware menu in the sidebar to be opened via Settings > Communication Units Management. To activate the menu, see Requirements. |
| 2 | View the latest official firmware release for the eligible CU models within the organization tree. The Machines column shows the count of machines that are updated to the firmware version. |
| 3 | Update the communication units by the selected firmware version. |
| 4 | Check status of installed and updated firmware versions for each communication unit in the Firmware and Configuration Updates menu. |
Requirements
In order to have the firmware update option available within the DataPortal, the following preconditions must be fulfilled:
| Permission Set Name | Level |
|---|---|
| Machines | Admin |
| Models | Admin |
| Feature Name | Status |
|---|---|
| Firmware Management | ON |
Note
For more information on requirements refer to Available Features and Permissions.
Select Firmware Version for Update
You can select the specific firmware version to update all eligible machine(s):
-
Go to Settings > Communication Unit Management > Firmware.
-
In the Communication unit - Firmware, open the context-menu via the
3-dots by the end of the line of the desired firmware version. -
Select Install on machines.
Note
When there are no eligible machines for this update, the Install on machines option will not be displayed.
The Select machines page opens in the Firmware and Configuration Updates menu.
-
Choose all or specific machines for the firmware update and Continue.
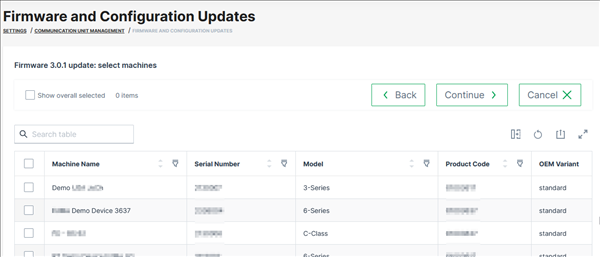
Figure 3: Choose machines The Firmware update page opens. In case there are conflicts for the selected machines, e.g. pending firmware update, the information is displayed here, too:
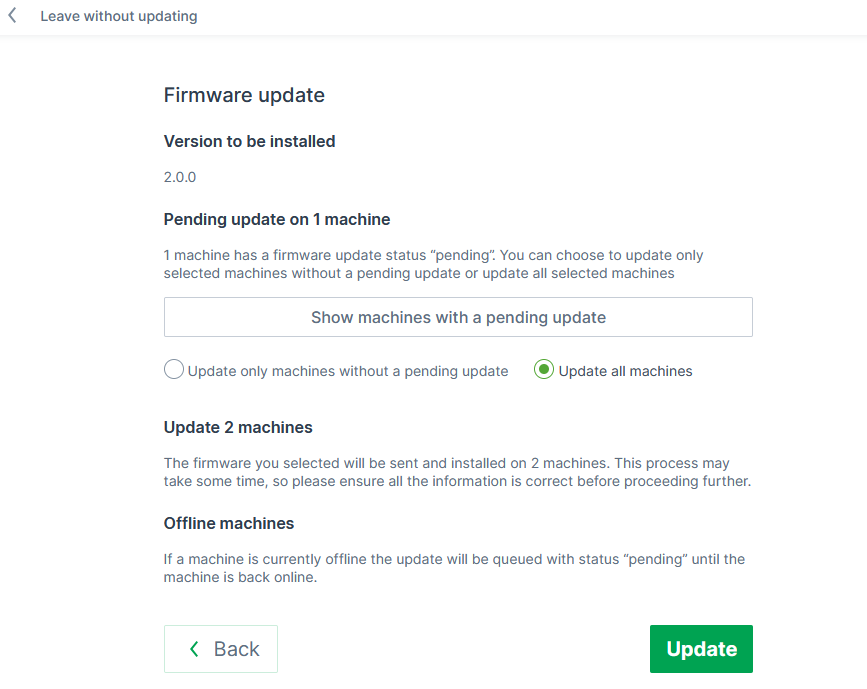
Figure 4: Firmware update information page You can then proceed with the firmware update for all machines or only those without a pending update.
-
Click Update to start the update of the firmware on the selected devices. ✓ The firmware update runs in the background.
Configuration Management
The DataPortal enables remote configuration updates of communication units (configuration over the air - COTA). Configuration updates are managed using configuration bundles, which allow version control and provide transparency regarding the installation status of selected machines.
Configuration bundles are visible only within the respective tenant organization (typically the OEM). Users belonging to the tenant, including its child organizations, can view and assign configuration bundles according to their Permission Set. Users outside of the tenant cannot see or assign configuration bundles. See Tenant for further details.
A remote configuration update of a communication unit consists of two steps:
-
In the first step, the Create Configuration Bundle procedure must be completed.
-
In the second step, the transfer of the configuration update to the device must be triggered, either by selecting one or more CUs for the Configuration Update/Mass COTA or by selecting the configuration bundle first, see Select Configuration Bundle for Update.
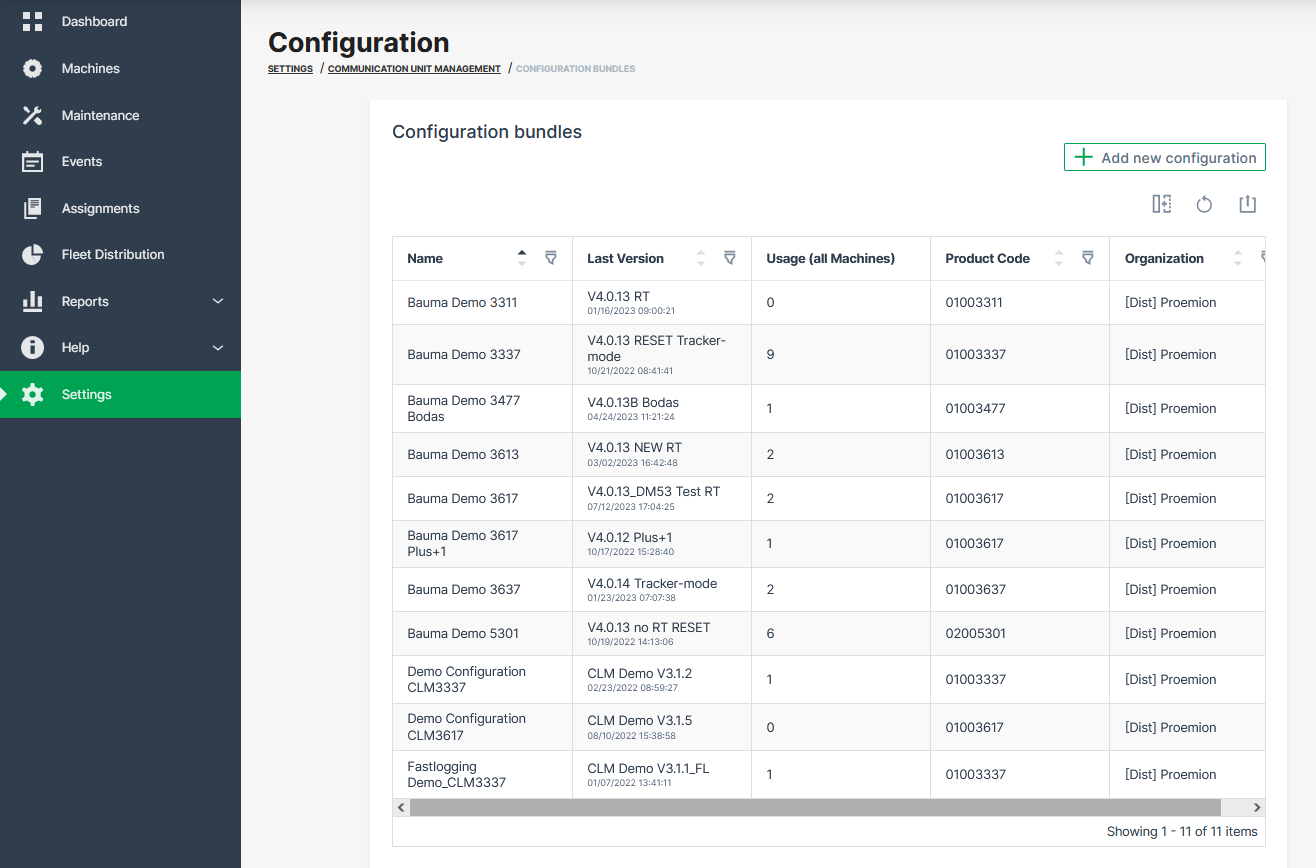
Requirements
In order to have the configuration update option available within the DataPortal, the following preconditions must be fulfilled:
| Feature | Permission Set Name | Level |
|---|---|---|
| Upload/Deletion of Configuration into the Configuration Management Repository | Models | Admin |
| Triggering or Cancelling of Remote Configuration, either of | Models | Admin |
| Machines | Admin |
| Feature Name | Status |
|---|---|
| Configuration Management | ON |
Software Update Use Cases
A: As telematics OEM manager with Models Admin permission set I need to be able to manage configurations and configuration bundles to provide them for updating existing machines or configuring new machines.
| Permission Set | Level | Description |
|---|---|---|
| Models | Admin | Is allowed to manage configurations and bundles. |
| Models | Admin | Is allowed to download configuration files. |
B: As telematics OEM manager with Models Admin permission set I need to be able to start/stop COTA/FOTA requests for machines and models so I can test and rollout fleet wide software updates.
| Permission Set | Level | Description |
|---|---|---|
| Models | Admin | Is allowed to view configurations and bundles. |
| Models | Admin | Is allowed to view current and historical COTA requests of a machine. |
| Models | Admin | Is allowed to create a COTA request for a machine. |
| Models | Admin | Is allowed to view current and historical FOTA requests of a machine. |
| Models | Admin | Is allowed to create a FOTA request for a machine. |
C: As an OEM end-of-line worker with Machines Admin permission set I need to be able to start/stop COTA/FOTA requests for machines to be able to install the latest software version into a new machine.
| Permission Set | Level | Description |
|---|---|---|
| Machines | Admin | Is not allowed to manage configurations and bundles. |
| Machines | Admin | Is not allowed to download configuration files. |
| Machines | Admin | Is allowed to view configurations and bundles. |
| Machines | Admin | Is allowed to view current and historical COTA requests of a machine. |
| Machines | Admin | Is allowed to create a COTA request for a machine. |
| Machines | Admin | Is allowed to view current and historical FOTA requests of a machine. |
| Machines | Admin | Is allowed to create a FOTA request for a machine. |
Create Configuration Bundle
Note
The configuration management in the DataPortal requires a combination of a .dod* and its corresponding .bin files. This will be considered as a configuration bundle. A .bin file can be created when having the new *.dod open with the Proemion Configurator software.
-
Open Settings > Communication Units Management > Configuration Bundles.
✓ The table with the available configuration bundles opens.
-
Click on the + icon in the top right corner to add a new configuration.
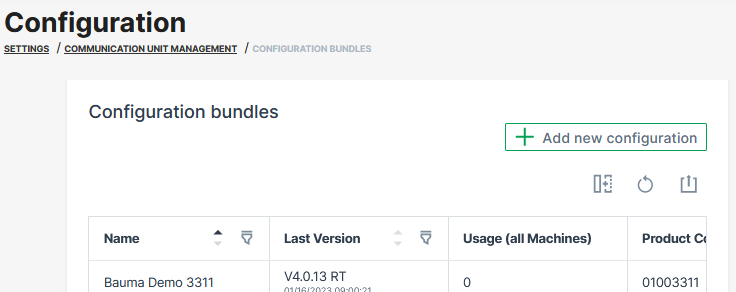
Figure 2: Add new configuration -
In the NEW CONFIGURATION dialog click on Upload .dod file button to select the new *.dod file.
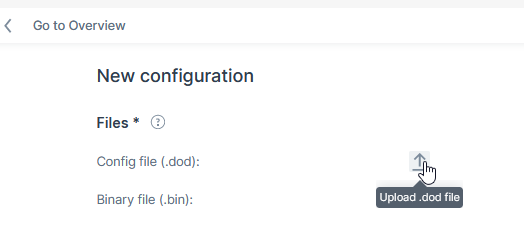
Figure 3: Upload .dod file Note
The uploaded .dod file will be validated for consistency. In case of an error, the upload will be cancelled and a specific error message will be displayed. To detect the root cause of the error and resolve it, contact the Service and Support.
-
Click on Upload .bin file button to select the corresponding *.bin file.
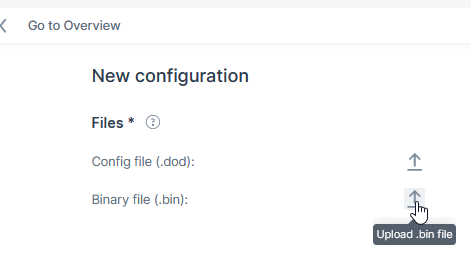
Figure 4: Upload .bin file Note
The product code and the device configuration version string must be same in both the .dod* and .bin* files.
The New Configuration section opens.
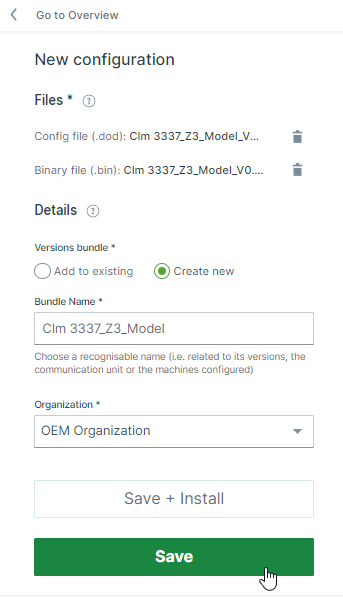
Figure 5: Upload Details -
Regarding the Versions bundle, you may choose Add to existing or Create new files.
-
Enter a proper Bundle Name.
-
Select the Organization.
-
Click on Save.
✓ After saving, the Configuration Overview with the available configuration bundles opens and the new configuration bundle is available now.
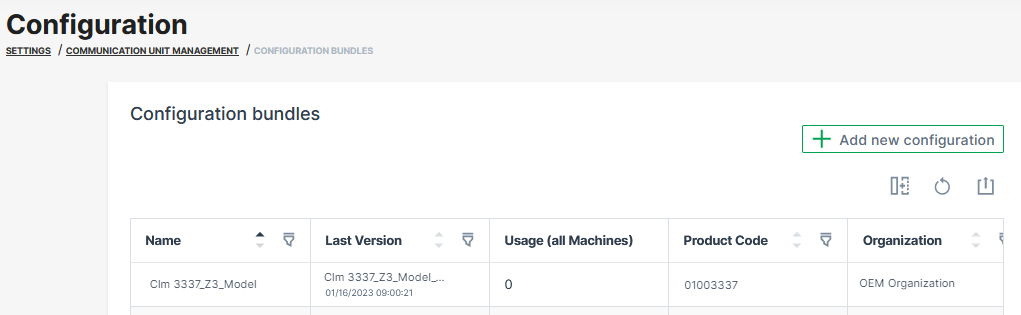
Download Configuration File
Users can download the *.dod or *.clm file from a configuration bundle for further use.
-
Open Settings > Communication Units Management > Configuration Bundles.
-
Click the Details button of the specific configuration bundle.
-
Click the
3-dots to open the context menu. -
Select Download .clm file.
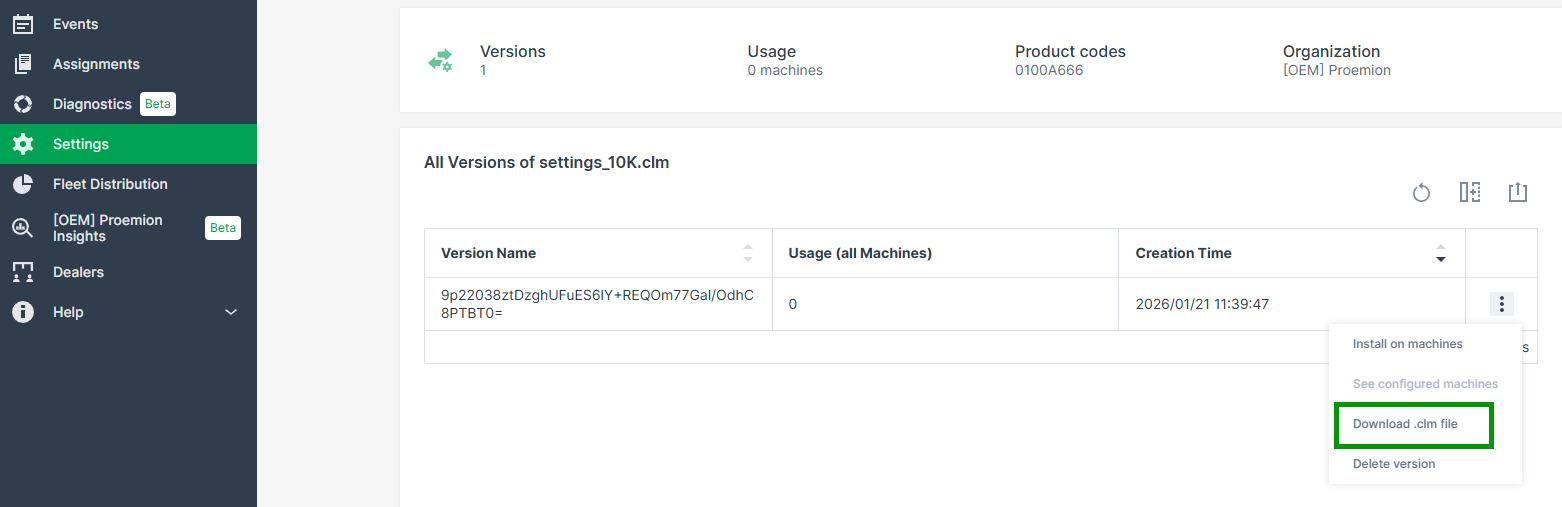
Figure 7: Download .clm file
Select Configuration Bundle for Update
-
Open Settings > Communication Units Management > Configuration bundles.
-
Select the desired Configuration bundle to open it.
-
By the end of the line of the desired configuration version, open the context-menu via the
3-dots. -
Select Install on machines.
Note
When there are no eligible machines for this update, the Install on machines option will not be displayed.
The Select machines page opens in the Firmware and Configuration Updates menu.
-
Choose all or specific machines for the configuration update and Continue. The Configuration update page opens. In case there are conflicts for the selected machines, the information is displayed here, too:
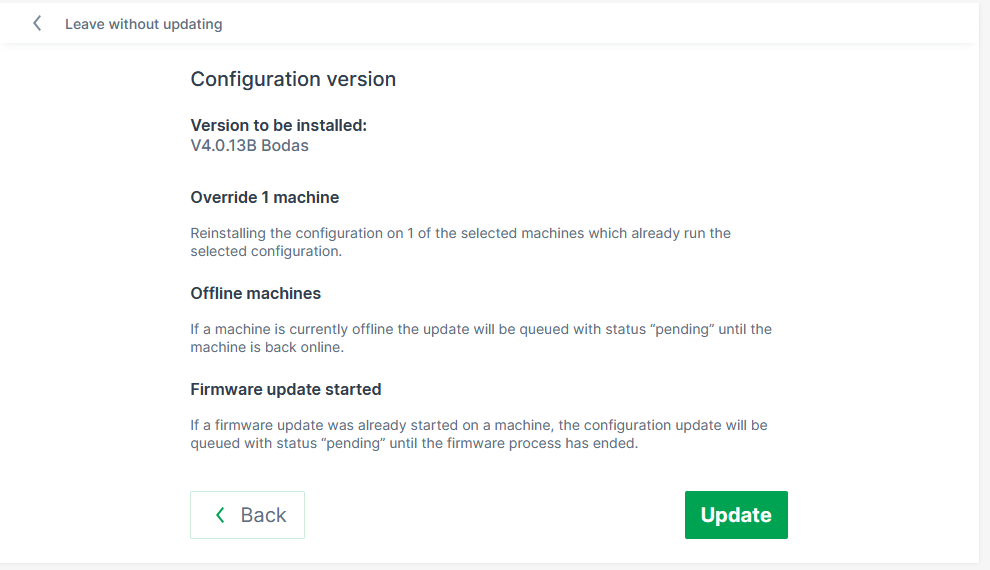
Figure 8: Configuration update information page You can then proceed with the firmware update for all machines or only those without a pending update.
-
Click Update to start the update of the firmware on the selected devices. ✓ The configuration update runs in the background.
Delete Configuration Bundle
In case that an already uploaded version of a configuration bundle needs to be deleted, go to Administration > Communication unit Configuration, open the specific bundle and delete the versions which are not required anymore.
Note
Consider that only versions without machine usage can be deleted.
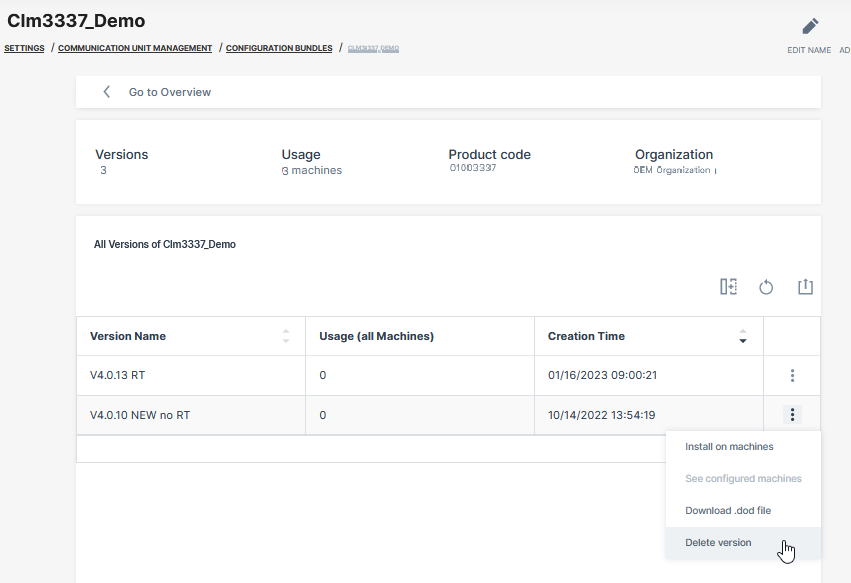
File Transfer
The DataPortal features file transfer to and from the machine via browser. You can also view basic history of the transferred files. The Machine:Admin permission set is required to use this feature.
Note
All operations intentionally do not allow files for special purposes, which are either platform-internal or represent use cases outside of general "data transfer". Note that configuration files regarding communication units can be maintained in Configuration Management.
DataPortal Transfers Overview
To view and transfer files to and from the DataPortal, open Settings > Communication Units Management > File Transfers.
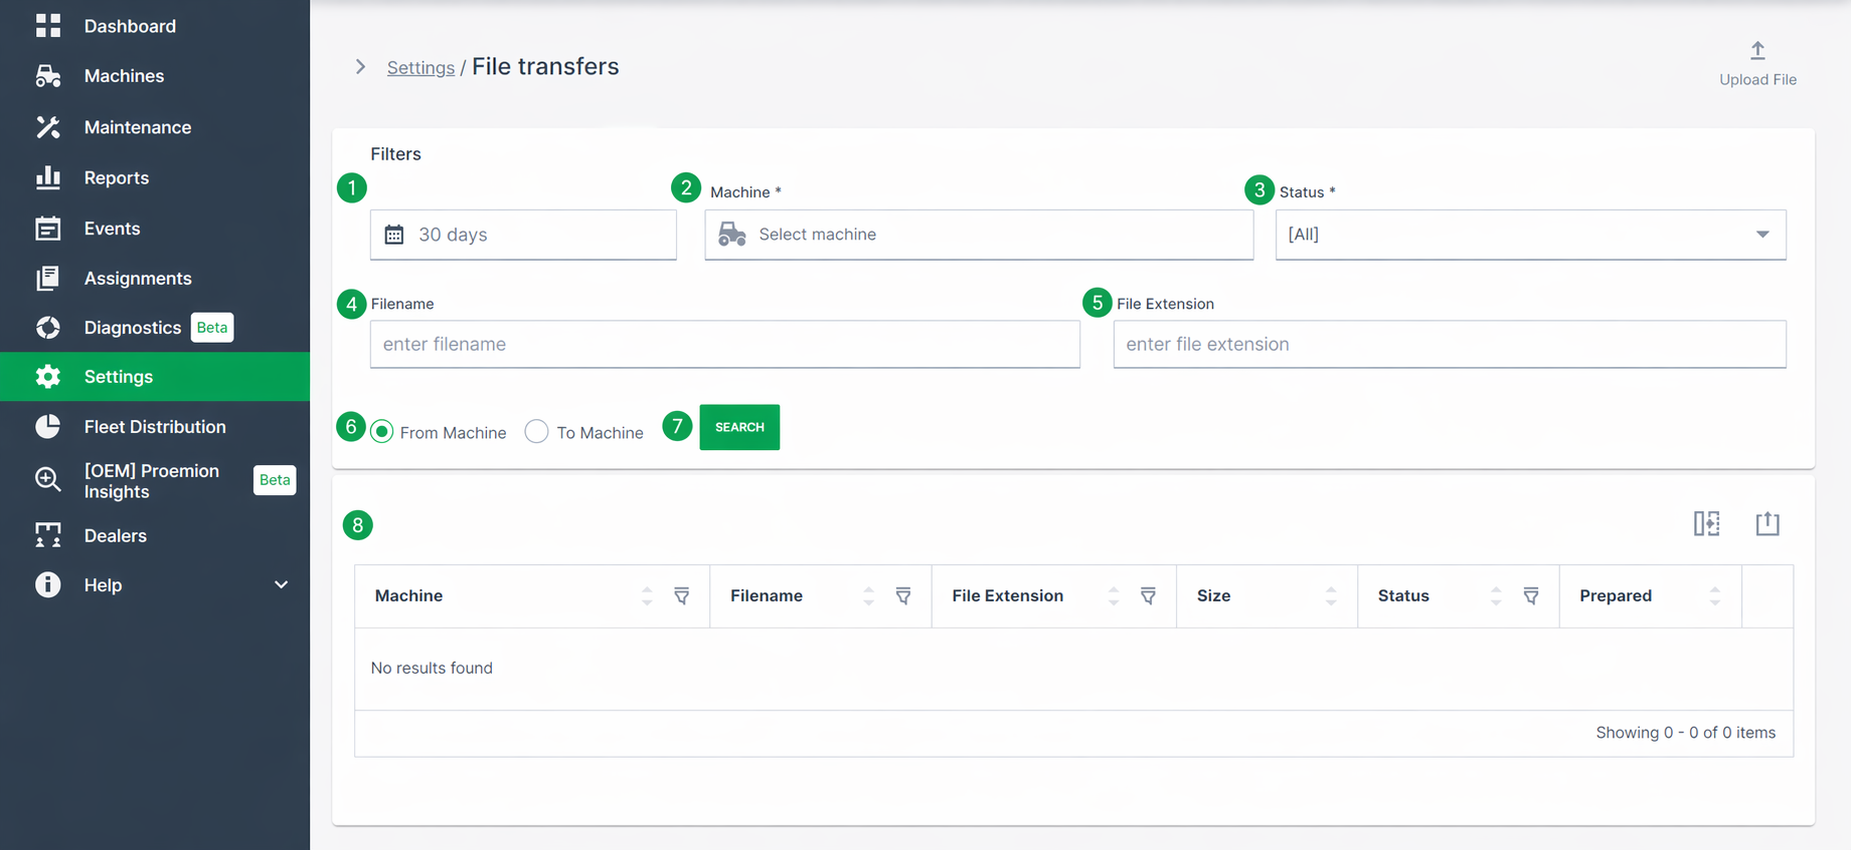
| # | Item | Description |
|---|---|---|
| 1 | Start/End within | Select the time range for the file search. |
| 2 | Machine | Select machine(s) to filter transfer by a specific machine or show all. |
| 3 | Status | Search Complete or Incomplete transfer status. |
| 4 | Filename | Name of the file you are searching for. |
| 5 | File Extension | Search by file extension. |
| 6 | From/To | Search transfers to the machine or from the machine. |
| 7 | Search | Use the filter settings to search for a file transfer. |
| 8 | Files Table* | Files returned by the search. |
| 9 | Upload | Upload a file for transfer. |
*In the table of files returned by the search, there are following columns:
-
Filename: Read the file name restrictions below.
-
Size: The unit is bytes.
-
Actions
-
Save
 : Save or open the file from the browser.
 -
Remove
 : Remove the file from its current location.
-
File name and extension restrictions for CANlink® mobile 36xx devices:
-
The file names must have 8 characters and the file extension must have 3 characters (8.3 format).
-
Characters permitted for the file name and file extension are :
"A", ... "Z","a", ... "z"and"0", ... "9" -
The following file extensions are reserved for internal use only and may not be used for customer application:
.obr,.obw,.obc,.dbs,.prg,.bin,.clf,.msg
File name and extension restrictions for CANlink® mobile 10xxx devices:
-
Filename (before the dot):
- Can contain letters, numbers, underscores (
_), and hyphens (-) - No spaces or special characters allowed
- Must be 1 to 256 characters long
- Can contain letters, numbers, underscores (
-
File extension (after the dot):
- Must be 1 to 10 characters long
- Can include only letters and numbers
- No special characters allowed
File Upload
You can upload a file to a machine by clicking the Upload File button in the upper right corner. This opens the Upload Transfer File dialog:
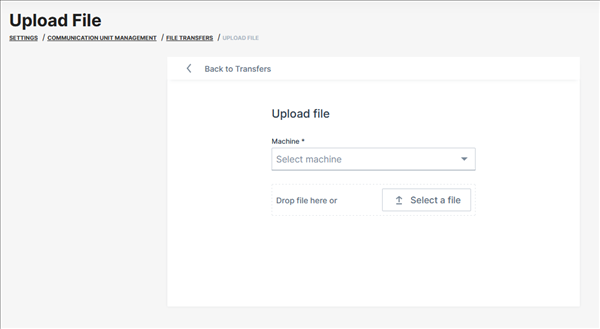
-
Select the machine you want to transfer a file to.
-
Choose a file or drag it and drop it where indicated.
-
Upload the file by clicking the Upload button.
File Deletion
The transferred generic files are stored for 120 days on the DataPlatform
After this period they are automatically deleted and not available anymore
Consider that files that were to be transferred to the CU but have not been transferred successfully will be deleted after 360 days in the queue.
.clf files are automatically deleted latest after 45 days.
Note
The described storage durations are subject to change
There is no guarantee for a specific holding time, especially for *.clf files!
Fleet Distribution
Fleet Distribution Overview is a useful option for fleet managers with machines from different OEMs within their DataPortal organization
With this function the so-called mixed fleet owners can see how many machines they have from each OEM.
Requirements
In order to have the Fleet Distribution Overview option available within the DataPortal, the following requirements must be fulfilled:
| Permission Set Name | Level |
|---|---|
| Machines | View |
| Feature Name | Status |
|---|---|
| OEM Name | ON |
Fleet Distribution Overview
This overview is aimed to display the distribution of machines and their corresponding OEMs for the entire organization tree.
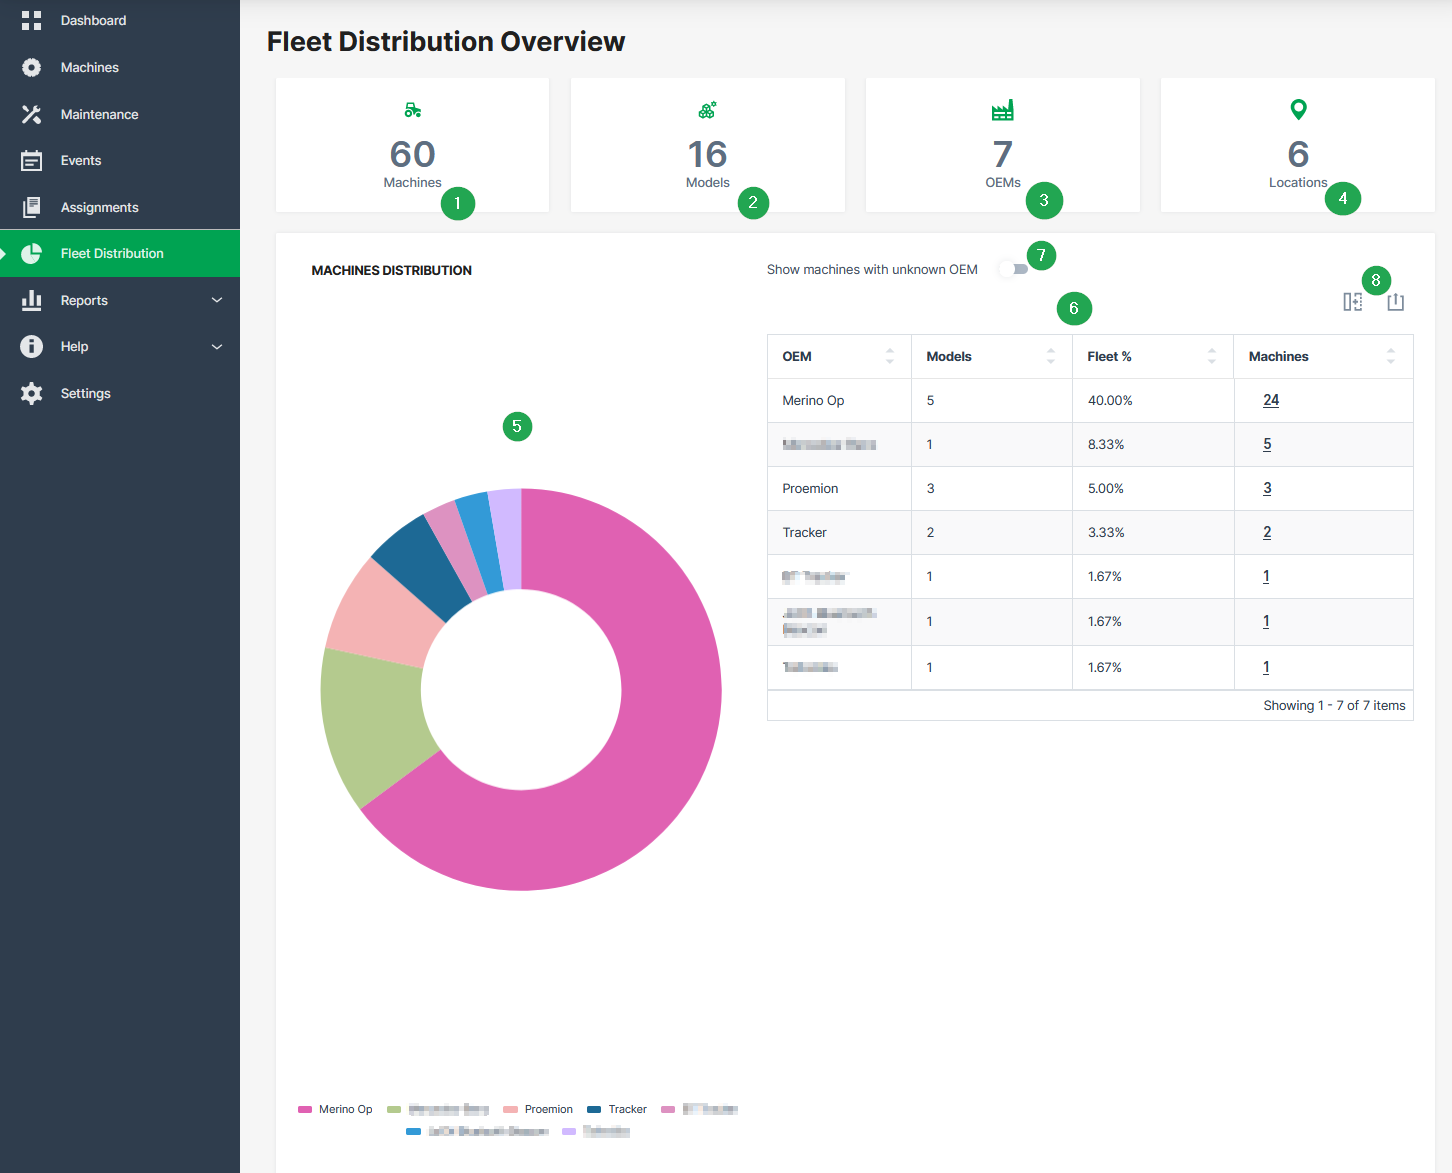
| # | Item | Description |
|---|---|---|
| 1 | Machines | Display of total number of machines. |
| 2 | Models | Display of total number of different models. |
| 3 | OEMs | Display of total number of different OEMs. |
| 4 | Locations | Number of countries where the machines are located. |
| 5 | Pie chart | Statistical graphic of OEMs and the corresponding number of machines. |
| 6 | Table | Tabular overview of OEMs, models and the corresponding number of machines. |
| 7 | Toggle switch | Show machines with unknown OEM. |
| 8 | Export | Options to hide columns and export the table to a CSV or XLSX file. |
OEM Insights
The OEM Insights page provides reports on aggregated data on the telematics performance of your fleet within specified time periods and other data analyses. The advantage is that data can be viewed in different predefined charts at a glance for your whole fleet instead of querying data for certain machines via the REST API.
Note
The OEM Insights feature is in beta stage.
Requirements
Activation
The OEM Insights page is visible only to members of the tenant organization. The organization must be of Organization Type "OEM". The page can be enabled/disabled per tenant via Feature Switch.
Metrics used
The usage of the Proemion Standard Metrics is required to use this feature. The metrics that are delivered by the machines and used for the display of the aggregated data in combination with e.g. a monthly bucket are:
-
value.common.machine.hours.operation.total("Active Machines Operating Hours") -
value.common.machine.geo.latitude("Active CUs Last 24 Hours", CUs that updated geo within last 24 hours based on this signal)
DataScience features
The initial activation of this feature and enabling the usage of the DataScience scripts must be done by Proemion. Contact Service and Support for enabling the feature and the DataScience scripts.
The Counter Guard feature, see Counter Guard (DataScience), is also required for the OEM Insights. It removes machines with problematic counter signals from the analysis. Without activating this feature, OEM Insights will not remove machines with problematic signals, potentially leading to inaccurate results.
Sample
The OEM Insights page is displayed as follows and shows information on:
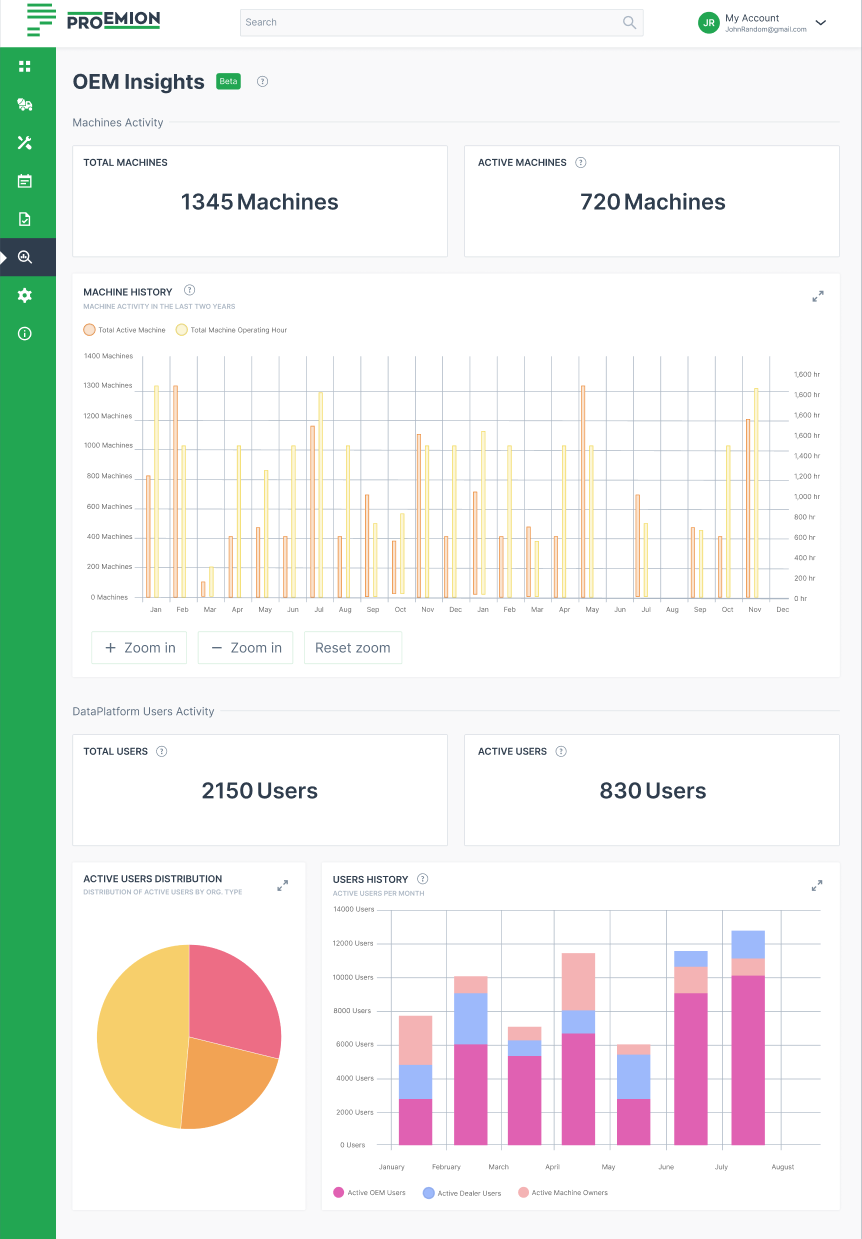
-
Machine Activity, e.g.:
-
Total number of machines (that you have contracts with)
-
Active machines (in the last 30 days)
-
Machine History of the last 2 years, i.e. average hours per active machines
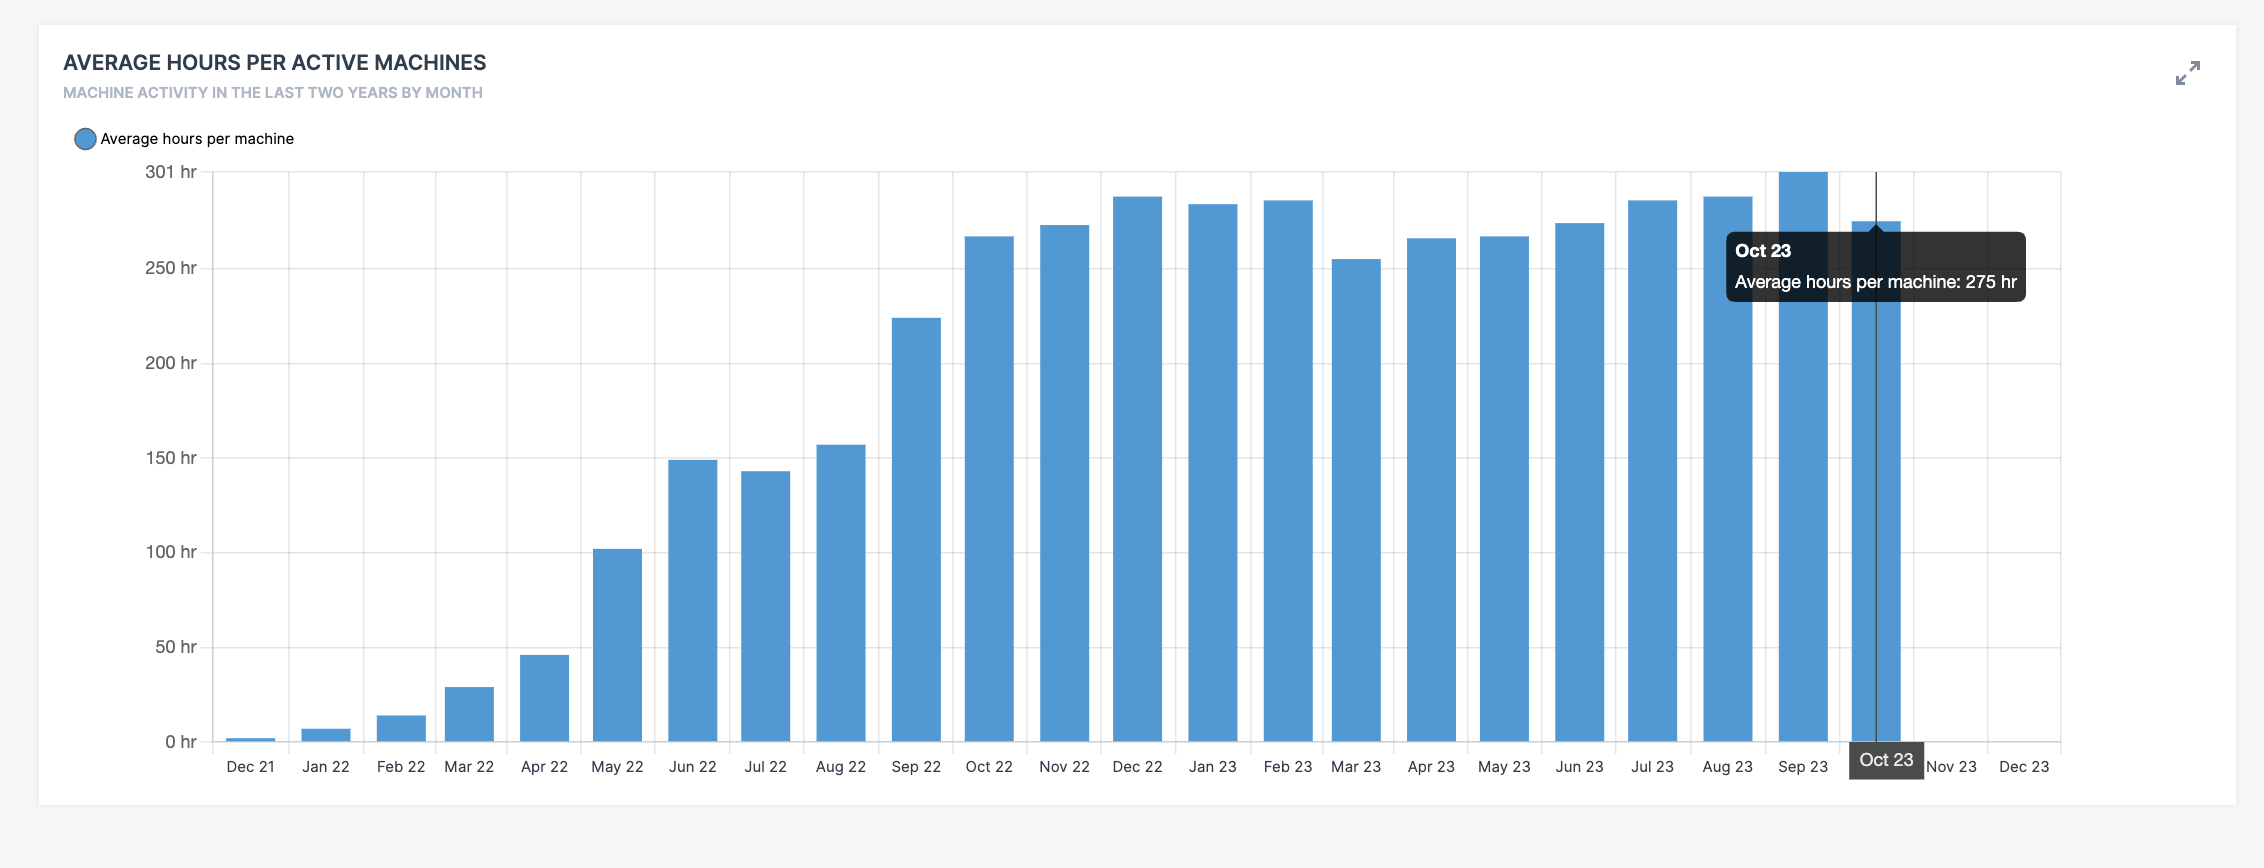
Figure 2: Average hours per active machines
-
-
DataPlatform User Activity, e.g.
-
User distribution by Organization Type
-
Active users per month
-
Dealers
Dealers reflects the geographical network of OEM and Dealer service/office locations.
This network enables an OEMs to view their entire dealership network and where their machines are located.
Dealers and OEMs can manage their own locations, update contact details, and ensure visibility to machine owners.
Machine Owners can see all dealerships in a given country or country and state.
They can start a contact with their dealer from the machine details to their dealer’s closest location or other locations of the dealer.
Each physical location is shown on a map and includes the address and contact details.
This allows Machine Owners and other OEM customers to view their nearest Dealer service locations (My Dealer) for their machines.
For each machine, a Machine Owner may also contact directly their Dealer at the nearest location via the button Contact Dealership, see Contact Dealer as Machine Owner.
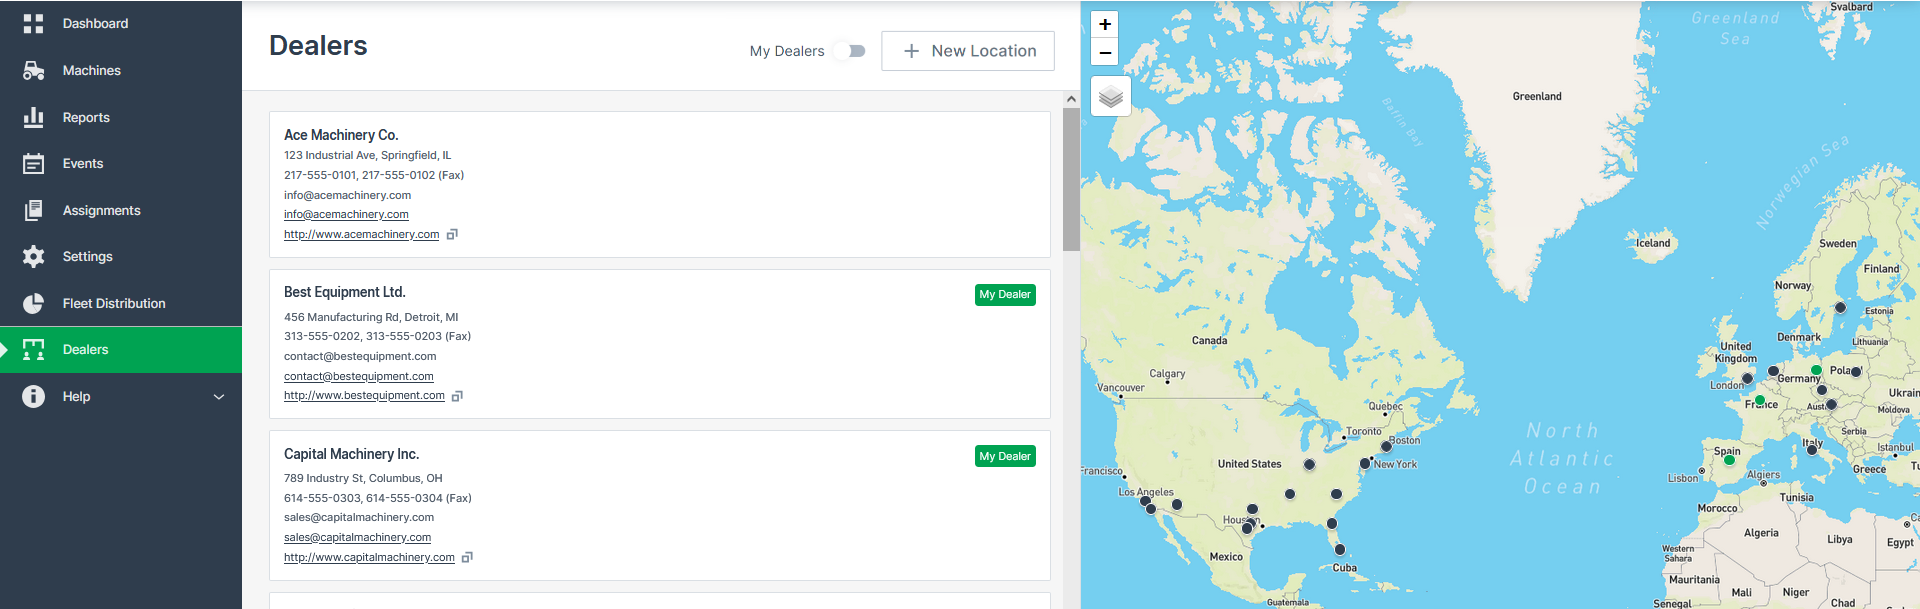
The Dealers menu is to be found in the Left-side Menu.
Glossary
Dealership
: Or "Dealer" is a business selling or distributing a company's goods or services in a particular area. In the DataPortal, a dealership might be represented by a subtree of one or more organization units.
Dealership Location
: A brick and mortar office owned by a dealership that machine owners can go to receive service. A dealership will have one or more locations.
(OEM) Service Location
: There are OEMs that provide service directly to machine owners through their own locations. It is the same concept as a dealership location but owned by the OEM.
Dealer Network
: The collection of dealer locations of all authorized dealerships of a given OEM.
Access levels
Users of each organization type have the following access and edit permissions in the Dealers network:
| Organization Type | Permission for Dealers network |
|---|---|
| OEMs | - Add dealership locations for the Dealers or your own OEM location in case of directly offering services to Machine Owners without the intervention of a separate dealership. |
| Dealers | - View all belonging Machine Owners to each Dealer. |
| - Add dealership locations | |
| Machine Owners | - View the Dealer Network with their dealer's locations highlighted. |
| - View all Dealers in a given country or country and state. | |
| - Contact Dealers from the machine details to their dealer's closest location or other locations of the Dealer. |
Ownership Management of Dealership Location
OEMs can create dealership locations within their service network and transfer ownership of those locations to a designated dealer.
During creation or editing, they can assign ownership to a specific Dealer business unit (Dealer BU), see Add new Dealership. This functionality enables OEMs to actively manage the dealer network structure and ensure that Machine Owners can immediately contact the correct service location (without relying on each dealer to set up their own locations).
OEMs can also take ownership of a location that is currently owned by a Dealer BU, offering flexibility and control over the structure of the dealer network.
Requirements
The Dealers concept requires the correct setup of a business unit, i.e. the organization tree must reflect the "real world" of a company, which means:
- Each Dealer must be added as a business unit on its own, with suborganization units if needed.
- Users of the Dealer organization unit must be assigned correctly to the organization, see Add User to Dealer Organization.
This allows users of a Dealer organization to manage location information, see also Add new dealership location, and share their data only within this business unit. Thereby, other users not included in this business unit cannot access their data. - (Sub-)organization units must be correctly assigned an Organization Type, i.e. "OEM", "Dealer" and "Machine Owner".
The feature must be activated at the tenant by toggling Dealers in the Feature Switch. OEM and Dealer users with Organization:Maintain permission set or higher can see the feature and manage locations.
Permissions
| Action | OEM | Dealer | Machine Owner (MO) |
|---|---|---|---|
| View entire dealer network | Yes | Yes | Yes |
| View own dealership locations | Yes | Yes | Yes (created by dealer root above the MO in the tree) |
| Manage own dealership locations | Yes | Yes | No |
| Add a new dealership location | Yes | Yes | No |
| Edit dealership contact information | Yes | Yes | No |
| Delete dealership locations | Yes | Yes | No |
| Start a contact with nearest (to a machine) dealer | No | No | Yes |
| Start a contact with a dealer | No | No | Yes |
| Transfer ownership of dealership location | Yes | No | No |
| Take ownership of dealership location Only available for Dealer and OEM that are business unit roots. |
Yes | Yes | No |
Add new Dealership location
To add, edit, or delete dealership locations, you must be a user of a Dealer or OEM organization unit. OEM users can create locations either for their own service network or on behalf of a Dealer, and assign ownership to the appropriate Dealer business unit.
When creating or editing a location, ownership can be assigned to a Dealer business unit using the Dealership Owner dropdown menu in the form below. In the dropdown menu, only the OEM and its Dealer business units are available if the dealership location belongs to a different BU. A Dealer business unit is only available if the requester has permission to manage the location.
The feature must be activated by the OEM at tenant level before locations can be managed.
Note
The OEM can decide whether to activate the feature to the whole tenant and also if users of Dealers can manage locations with the user permission Organization:Maintain.
- As a Dealer, log into the DataPortal.
- Navigate to Dealers menu.
- At the top of the menu, select +New Location.
-
Enter the first details and Continue:
- Add Location Name
- Pick a Location in the map
- Enter the Address
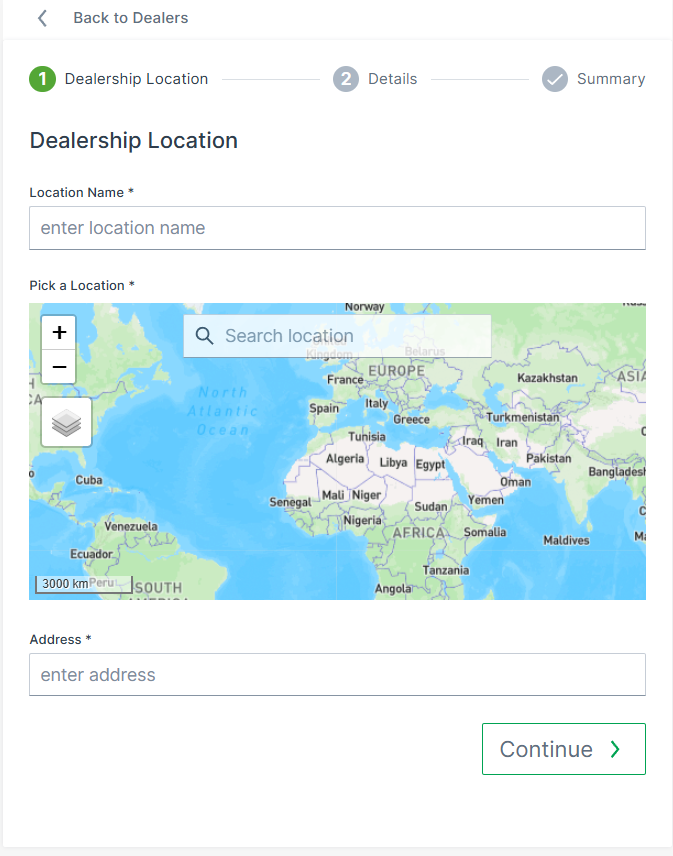
Figure 2: New Dealer Location -
Add the other required fields:
- Phone Number
- Email Address
- Optionally: Fax Number, Website
- Assign dealership owner to the appropriate business unit
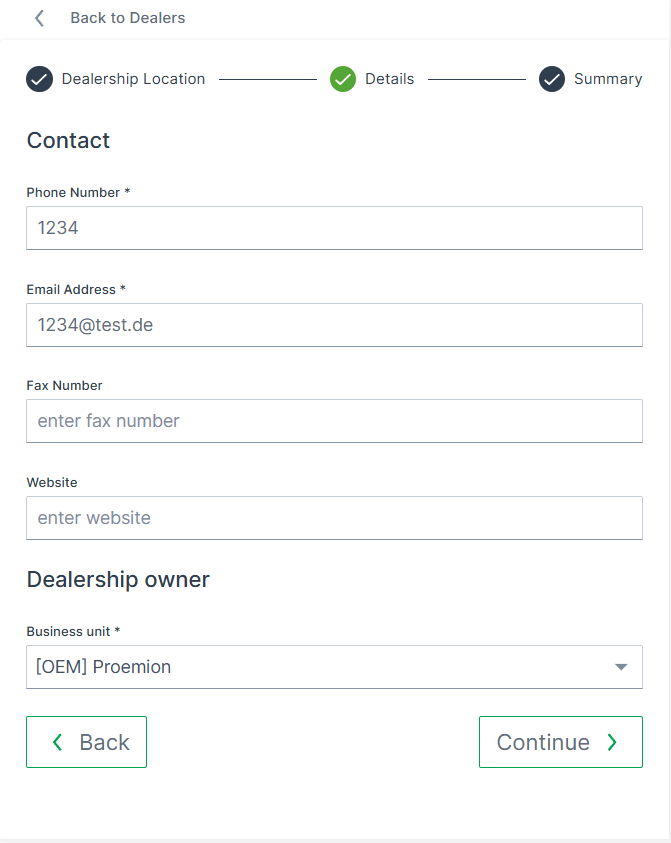
Add User to Dealer Organization
The OEM may add users to a Dealer organization within the User Management.
Contact Dealer as Machine Owner
As a Machine Owner, you can contact any dealership directly via the DataPortal - either via the Machine Details Page or via the Maintenance Task Page.
Contact via Machine Details Page
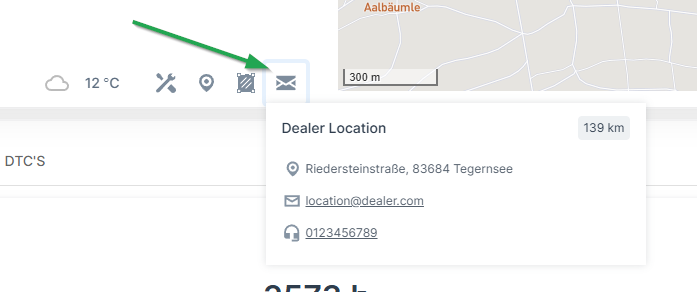
- As a Machine Owner, navigate to the Machine Details Page.
- Click Contact Dealerships.
- Select the desired Dealer; they are sorted by distance.
- Select the contact method (email, phone, fax). Click the email/phone number which opens your email program/copies the phone number.
You have initiated a contact with the Dealer.
Contact via Maintenance Task Page
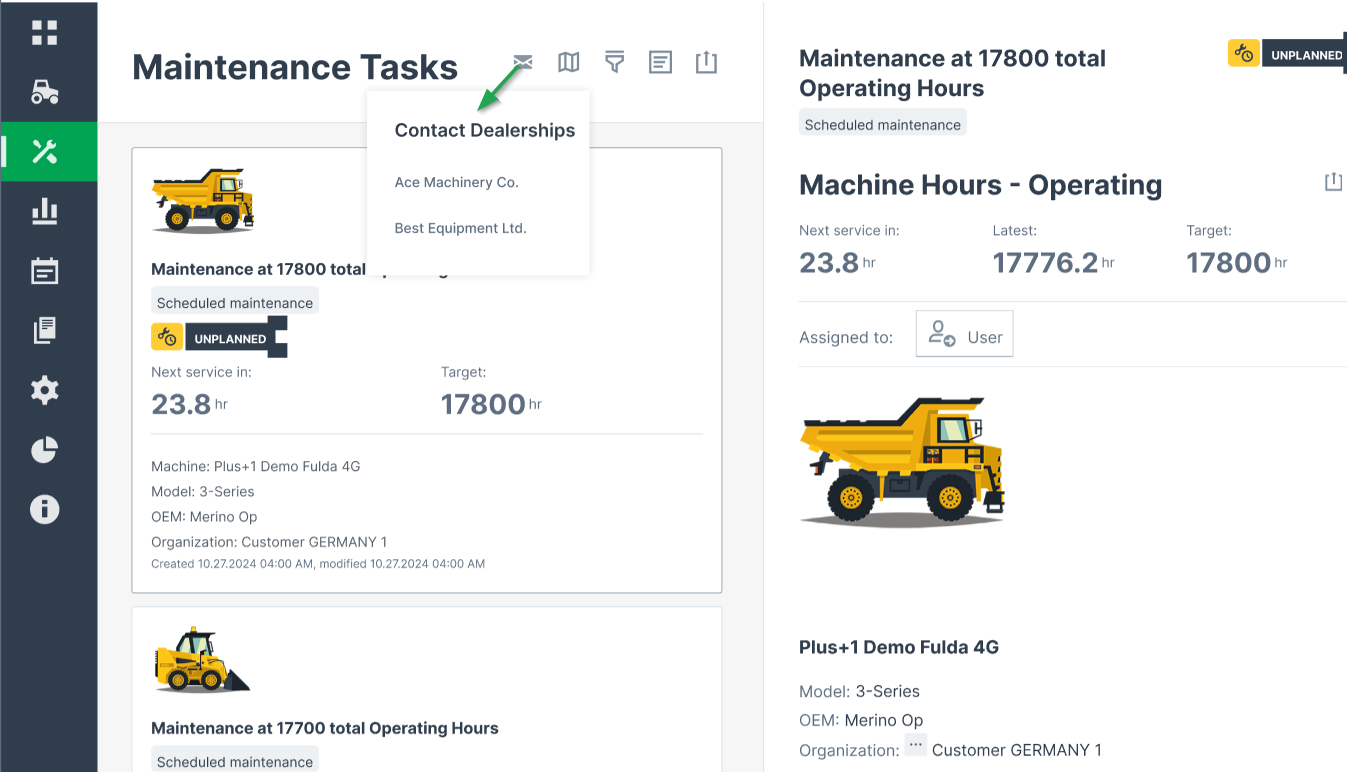
- As a Machine Owner, navigate to the Maintenance Task Page.
- Click Contact Dealerships.
- Select the desired Dealer; they are sorted by distance.
- Select the contact method (email, phone, fax). Click the email/phone number which opens your email program/copies the phone number.
You have initiated a contact with the Dealer.
DataPlatform as Identity Provider
The DataPlatform can act as the Identity Provider (IdP) for applications built by OEM and distributor customers, letting them build their own branded web or mobile applications with secure sign-in via the DataPortal and access to the REST API limited to the existing DataPortal permission sets of the signed-in user.
Note
DataPlatform as Identity Provider is available for qualified OEM and distributor customers. It is configured by Proemion for each customer. There is no self-service option to register an application in the DataPortal.
To assess fit and start onboarding, make a request via the Sales Team Contact Form.
Overview
Such a custom application is customer-owned, registered with Proemion, and connected to the DataPlatform. End users of the application sign in through a Proemion-managed SSO flow, and the application calls the REST API on their behalf with scoped Permission Sets.
This is different from an API Client, which is intended for machine-to-machine integrations without an individual end user, such as scripts or ERP integrations.
The feature replaces the legacy OAuth 2.0 token endpoint, which does not support refresh tokens and requires users to log in again every 4 hours.
Key capabilities:
- User sign-in via Proemion SSO: End users authenticate through a Proemion-managed SSO flow. The OEM or distributor controls the branding and user experience of their own application. No customer-operated identity system (for example Azure AD) is required.
- User-centric API access: API access is scoped to the permissions of the signed-in DataPortal user, including support for Multi-Factor Authentication.
- AI and automation ready: Simple, one-purpose apps, such as dashboards, alerting tools, or internal utilities, can be built using AI app builders or automation tools, leveraging DataPlatform as Identity Provider to securely access Proemion APIs.
- Governed onboarding: Proemion configures each application, including redirect URIs, scopes, and environments.
When to Use DataPlatform as Identity Provider
DataPlatform as Identity Provider is suited for OEMs and distributors that want to offer a branded, user-facing application, such as a dealer portal, fleet app, or service tool, based on DataPlatform data.
It is not suited for:
- Purely machine-to-machine integrations without an end user. Create an API Client instead.
- Customers with an existing enterprise SSO system who want to integrate it directly with DataPlatform. A direct integration with the customer's own identity system remains the preferred model in this case.
- Data sovereignty or DataLake use cases. Use the DataPump Service instead.
- Customers who want a ready-made app without building and maintaining their own. Use the Machine Companion App instead, see the Machine Companion App Manual.
Setup
Contact your Proemion sales representative with the following information:
- Full customer name
- Purpose of the application
- Name of the application
- Redirect URL the user should be sent to after authentication
- Whether a Whitelabel setup exists for your organization. A Whitelabel setup is recommended.
Proemion configures the application and provides:
- A client ID
- The SSO configuration endpoint, available at
.well-known/openid-configurationon your DataPortal domain, for examplehttps://dataportal.proemion.com/.well-known/openid-configuration
Use the client ID with a PKCE-based OAuth flow to sign in a user and call the REST API on their behalf.
Python example: PKCE OAuth flow
The following example requests a token and calls the /me endpoint to confirm the setup:
import base64
import hashlib
import os
import threading
import webbrowser
import json
from http.server import HTTPServer, BaseHTTPRequestHandler
from urllib.parse import urlparse, parse_qs

import requests
from requests_oauthlib import OAuth2Session

# Replace with your DataPortal domain (use your Whitelabel domain if applicable)
BASE_URL = "REPLACE_ME"

CLIENT_ID = "REPLACE_ME"

# Replace with the redirect URI configured for your application
REDIRECT_URI = "http://localhost:8080/callback"

SCOPES = ["openid", "profile", "email"]

# Replace with the current API version, see the versioning guide:
# https://docs.proemion.com/api/#versioning
API_VERSION = "REPLACE_ME"

WELLKNOWN_URL = f"{BASE_URL}/.well-known/openid-configuration"
ME_ENDPOINT = f"{BASE_URL}/api/{API_VERSION}/me"

config = requests.get(WELLKNOWN_URL).json()
AUTHORIZATION_ENDPOINT = config["authorization_endpoint"]
TOKEN_ENDPOINT = config["token_endpoint"]

def generate_pkce():
    verifier = base64.urlsafe_b64encode(os.urandom(40)).decode().rstrip("=")
    challenge = base64.urlsafe_b64encode(
        hashlib.sha256(verifier.encode()).digest()
    ).decode().rstrip("=")
    return verifier, challenge

code_verifier, code_challenge = generate_pkce()

authorization_code = None

class CallbackHandler(BaseHTTPRequestHandler):
    def do_GET(self):
        global authorization_code

        parsed = urlparse(self.path)
        if parsed.path != "/callback":
            self.send_response(404)
            self.end_headers()
            return

        query = parse_qs(parsed.query)
        authorization_code = query.get("code", [None])[0]

        if not authorization_code:
            self.send_response(400)
            self.end_headers()
            self.wfile.write(b"Missing authorization code")
            return

        try:
            token = oauth.fetch_token(
                TOKEN_ENDPOINT,
                code=authorization_code,
                client_id=CLIENT_ID,
                code_verifier=code_verifier,
                include_client_id=True,
            )
            access_token = token["access_token"]

            response = requests.get(
                ME_ENDPOINT,
                headers={
                    "Authorization": f"Bearer {access_token}",
                    "Accept": "application/json",
                },
            )
            response.raise_for_status()
            me_data = response.json()

            self.send_response(200)
            self.send_header("Content-Type", "application/json")
            self.end_headers()
            self.wfile.write(json.dumps(me_data, indent=2).encode())

        except Exception as e:
            self.send_response(500)
            self.end_headers()
            self.wfile.write(str(e).encode())

    def log_message(self, format, *args):
        return

server = HTTPServer(("localhost", 8080), CallbackHandler)
threading.Thread(target=server.serve_forever, daemon=True).start()

oauth = OAuth2Session(client_id=CLIENT_ID, redirect_uri=REDIRECT_URI, scope=SCOPES)
auth_url, state = oauth.authorization_url(
    AUTHORIZATION_ENDPOINT,
    code_challenge=code_challenge,
    code_challenge_method="S256",
)

webbrowser.open(auth_url)

try:
    while True:
        pass
except KeyboardInterrupt:
    server.shutdown()
Legal Requirements
Legal Requirements
OEM DataPortal customers (top- or distributor-level) are required by law to inform users of their legal rights and obtain their consent in regards to data protection and privacy. The DataPortal hosts and enables access to the documentation via links, and user consent via banner.
The Tenant:Admin permission set is required to manage data protection and legal documents for the DataPortal, see Tenant.
Note
The Admin of the Tenant subject is a Super Admin that differs from the typical DataPortal Admin because they must have dedicated general knowledge of legal compliance and specific expertise of data privacy.
The standard documentation includes (but is not limited to - dependent on the region):
-
Required by OEM
-
Privacy Policy (PP)
-
End User Agreement (EUA)
-
-
Provided by Proemion
-
Imprint (required by German regulations - provided exclusively by Proemion)
-
Privacy Policy template
-
End User Agreement (EULA) template
-
-
User Tracking (banner) and Consent permission declaration
Note
Privacy Policy and End User Agreement are mandatory regardless of region.
GDPR Compliance
The GDPR Compliance page functions as an information hub for fulfilling your compliance obligations.
The following points are discussed here:

| Item | Description |
|---|---|
| Your Obligations Under The Law | Cookies are needed to ensure the best possible experience of the DataPortal. EULA or End User Licensing Agreement is a legally binding document describing the terms and condition of the access and use. Privacy Policy is a legally binding document describing how you manage the data you collect through the DataPortal. |
| How we are helping | After you do the initial setup, the DataPortal will ensure that your users accept the cookies and the documents in a legally binding way before being able to use the DataPortal. |
| Your Next Steps | You only need to provide the documents and the DataPortal will do the rest for you. |
| Keeping Track of User Consent | The DataPortal will only help you keep track of the consent to documents uploaded in the new Legal links page. |
| Final Submission Date | If one or all of the documents are missing after the deadline, the DataPortal will use the default legal documents. |
| FAQ | What is GDPR?: GDPR is a regulation in EU law on data protection and privacy in the European Union (EU) and the European Economic Area (EEA) Can I keep my documents up to date?: If in the future any of these documents need to be updated, you will be able to do so by uploading new copies of them to the DataPortal. Do I need one document in each language?: The DataPortal allows you to upload your documents for all languages supported. |
User Actions
The first time a user logs in and subsequently every time the documents are updated - specifically PP and EULA - they are prompted for their explicit consent before proceeding to use the DataPortal. This also applies to the banner.
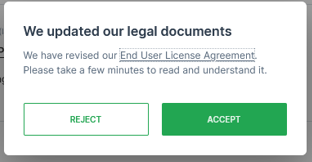
-
Selecting the Reject button automatically signs the user out of the DataPortal.
-
Selecting the End User License Agreement link opens the document in a separate browser tab.
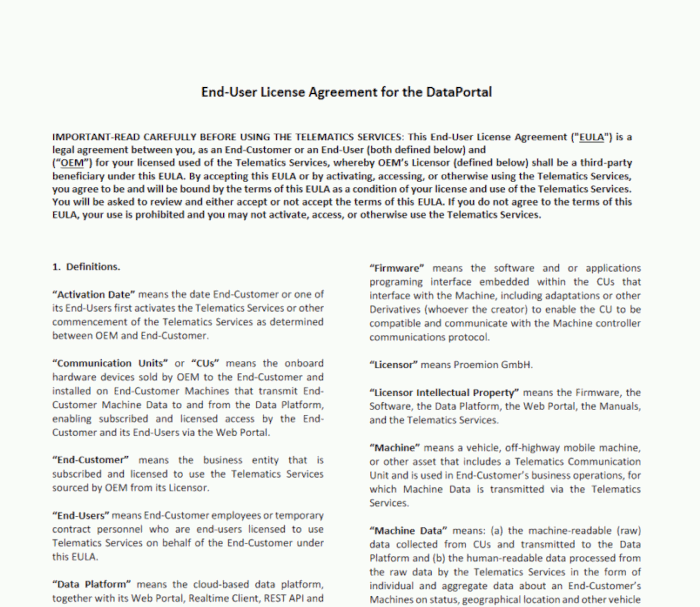
User Tracking
Consent to user tracking (cookies) by the DataPortal is facilitated by a banner.

TEXT: To be GDPR-compliant make sure you have uploaded your company's Privacy Policy and End-User License Agreement by [date]. If by the date there are no documents uploaded, the two templates in this page will be added automatically to your Login page. Please read the documentation for more details. This banner will disappear after appropriate action is taken.
Configuration
If the legal documents have not yet been configured, a prompt appears informing the DataPortal Admin upon login into the system that the documents must be set up and redirecting to the Legal Links menu via Add Legal Documents.
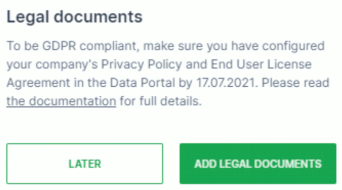
-
Select Later and a message appears prompting you to include the EULA and a browser note informing you about GDPR compliance requirements.
-
Select Read the Documentation and you are taken to the GDPR Compliance page (https://dataportal.proemion.com/legal-documentation) where you can read about your obligations and compliance instructions.
In the documentation there is a link - To get started, download the templates - that allows you to download the templates (in .doc format) whereby you can replace the text with that of your own. Once you have made the necessary adjustments, you can upload the links back into the DataPortal as PDF documents.

Document Upload
You can add the relevant documents in Settings > Portal Appearance > Legal Links.
In the sections Privacy Policy and the End User License Agreement sections, it is mandatory that you upload the document in the English language first
After uploading the English documents, the Add Translated Documents button appears that allows you to upload the documents in other languages.
Warning
DO NOT USE Login Footer Links from the DataPortal Themes section to serve Privacy Policy, End User License Agreement or other legal compliance/ data privacy documents!
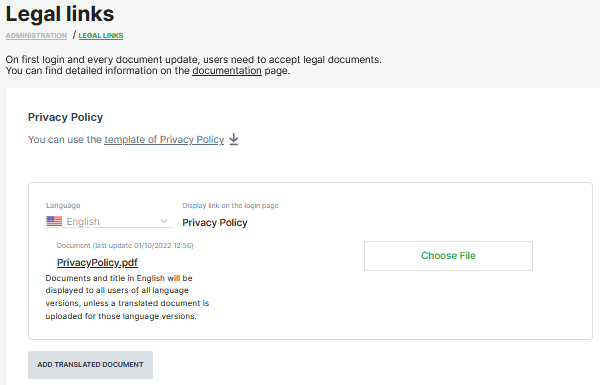
Selecting the Choose File button you can select the document
A successful upload shows a popup message that confirms the document is updated
After successful upload, the Add Translated Document button is now active and you can add translations of each document for localized versions of the DataPortal.
Note
The DataPortal does not validate if the language you uploaded matches the localization!
Imprint
Due to legal regulations, it may be necessary to store your own imprint for the respective data portal account. A fictitious example below shows how this can be achieved.
| Permission Set Name | Level |
|---|---|
| Tenancy | Admin |
-
To add an Imprint, select Settings > Portal Appearance > Legal links.
-
Click on ADD IMPRINT.
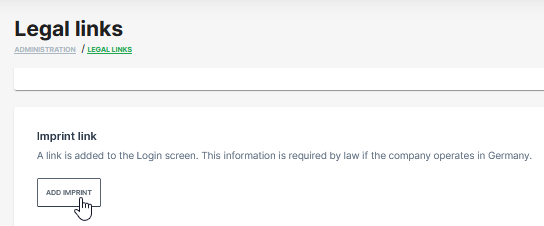
Figure 8: Add Imprint button -
Complete the imprint details at the pages Contact,Details and Board.
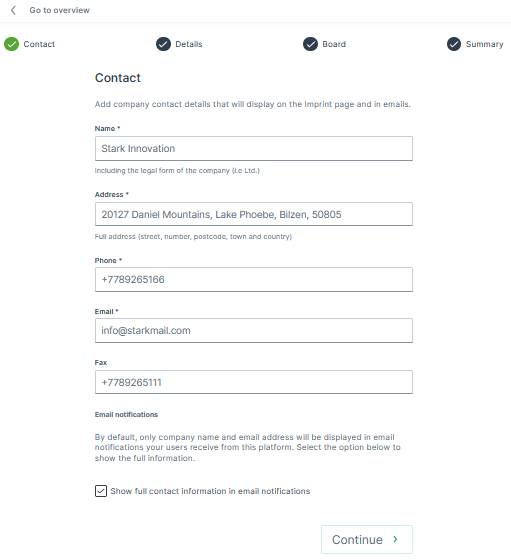
Figure 9: Imprint Details -
Check the summary and confirm by click on SUBMIT.
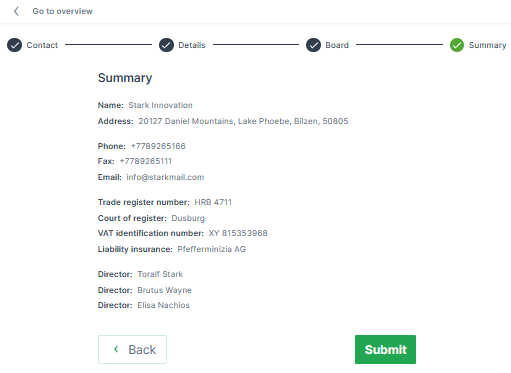
Figure 10: Summary and Submit button ✓ The message Imprint created successfully appears in the upper right corner.
Imprint Usage in Emails
The customer imprint will be used in the footer of the following email notifications:
| # | Email notification |
|---|---|
| 1 | Time fence Breach |
| 2 | DTC Notification |
| 3 | Maintenance Task |
| 4 | Threshold |
| 5 | GeoLeas Breach |
| 6 | Assignment completed |
| 7 | Password reset |
| 8 | E-Mail change notification |
| 9 | Export of raw data |
You can select the checkbox "Show full contact information in email notification" to unhide/hide the address and phone number in the imprint.
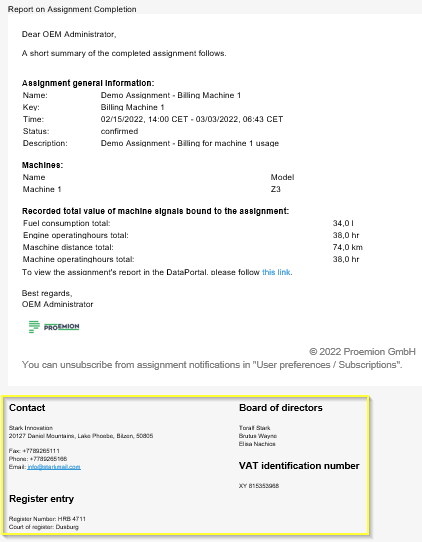
Imprint at Login Page
Note
The customized imprint at the login page is only available for white label customers with customized login URL. All DataPortal standard accounts alternatively can use the login footer link to get redirected to the imprint URL of the corresponding homepage.
-
To check the imprint settings at the login page for white label accounts, click on the Imprint label below the footer links in the lower left corner at the login page.
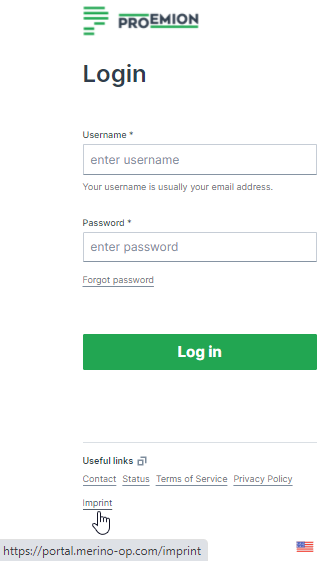
Figure 12: Login page ✓ The imprint opens in a second tab.
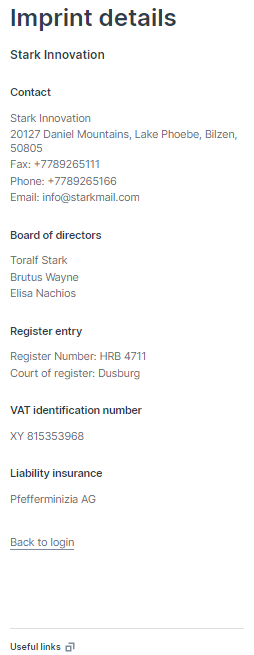
Figure 13: Imprint details -
Click on Back to login to close the imprint window and proceed with the login.
EU Data Act
The EU Data Act aims at enabling fair access for users of Connected Products or Related Services to data generated by those Connected Products or Related Services and by the users interacting with them. The Data Act (Regulation (EU) 2023/2854) establishes a set of rules on data access and use that respects the protection of fundamental rights. It increases data availability – in particular industrial data – and encourages data‑driven innovation while ensuring fairness in the allocation of data value among all actors in the data economy. For an introduction to the Data Act, please visit the Data Act Explained fact page. The Data Act is applicable as of 12 September 2025. The content of the Data Act goes beyond the requirements of the GDPR, but the provisions of the GDPR remain valid. This is not limited to personal data, meaning that machine and device data are also affected by the Data Act.
Note
This summary focuses on Proemion’s interpretation of EU Data Act (REGULATION (EU) 2023/2854 OF THE EUROPEAN PARLIAMENT AND OF THE COUNCIL) in regard to Proemion’s DataPlatform offering. This document shall not be taken as legal advice.
Main Scopes for Proemion and Proemion Customers
For the relation between Proemion and Proemion customers, the EU Data Act defines these main scopes:
- User requested access to data
- Protection of the data
- Switch of Data Processing Service to a different provider
Terminology
Proemion understands the terms used in the EU Data Act (Article 2) as follows:
| Term | Definition |
|---|---|
| Connected Product | A product, e.g. a mobile working machine, that collects data and transmits it to a Data Processing Service (e.g. Proemion DataPlatform). Proemion’s TCU (e.g. CANlink mobile) is not itself a Connected Product. It is the gateway that makes a machine a Connected Product. |
| Related Service | A service that augments the Connected Product or works together with it, enabled by the Data Processing Service (e.g. remote diagnostics, remote update, maintenance planning automation). |
| Data Processing Service | A service that enables access to the data and Related Services (Proemion DataPlatform). |
| Data | Any readily available digital representation of information in relation to the operation of the Connected Product. |
| Product Data | Data recorded on the machine and sent to the Data Processing Service (e.g. time‑series data, DTCs, location, …). |
| Related Service Data | Includes events triggered by the Connected Product Actions API, GeoLeash events, and user activity logs with regard to the Connected Product on DataPlatform (e.g. sending an action to a machine, logging a maintenance task for a machine, changing a geofence). User activities not related to the Connected Product (e.g. DataPlatform login, DataPortal administration) are excluded. Proemion is preparing a EU Data Act - List of Data that fall into Related Service Data. |
| Metadata | Information required to interpret and make use of the Product Data or Related Service Data. |
| Derived Information | Information derived from data as an outcome of additional investments (e.g. combined datasets, machine‑learning insights, maintenance events derived by DataPlatform automation). Derived Information does not fall into the scope of the EU Data Act. |
| User | Natural or legal person owning or using the Connected Product or Related Service (usually: machine owner). |
| Data Holder | The entity that determines and controls access to the readily available data from the Connected Product. In practice, this is usually the OEM / machine manufacturer. Proemion supplies the technical means (APIs, DataPlatform) but does not normally decide who is entitled to access and is therefore generally not the data holder unless it directly governs access under specific arrangements. |
Note
The detailed EU Data Act – List of Data is provided upon request to OEMs and authorized users, as it contains technical and configuration-dependent information.
User Data Access Rights
The EU Data Act allows Users to request access to Product Data from Connected Products (Article 4(1)). Access to readily available data (raw data) has to be granted free of charge to the User and continuous or in real time where relevant.
The User needs to be informed about what data the Connected Product creates, how it can be accessed, how long it is retained, and how it can be deleted (Article 3(2)). Proemion provides general information about what data is created by the Related Service (DataPlatform). This information can be included by the OEM. Proemion currently enables access to Product Data and a certain subset (except User activity logs) of Related Service Data on demand via its REST API or scheduled via DataPump (for Product Data).
Proemion enables data sharing according to the EU Data Act by using REST API Clients. For this purpose, the Operational:View Permission Set has been introduced, allowing access to readily available Product Data and selected Related Service Data without granting administrative or configuration privileges. For detailed information on the available endpoints that are compatible with the Operational:View Permission Set, please refer to the Proemion REST API.
OEMs can make the REST API description and the relevant endpoints available to Users requesting data access. Proemion considers DataPlatform’s user management to be sufficient for the User identification requirements described in the EU Data Act. For connecting to another system (“sharing with 3rd party” – Article 5), e.g. rental management systems, Proemion provides the standardized AEMP API (ISO 15143 -3). The standardized interface allows for easy integration without platform‑specific programming and provides access to the subset of data as described in the standard. In order to retrieve all available Product Data, the Proemion REST API can be used.
Example endpoints:
For cases that do not require API integration, the DataPortal functionality Fleet Data Export can be used. Additionally, Users can request to forward the data to a third party. This can be implemented by deploying Proemion’s DataPump Service add-on service, which supports forwarding data to Microsoft Azure, Amazon AWS, and Google Cloud Storage regardless of their location. Note that under the EU Data Act, the data holder is not obliged to share data with a non-EU recipient.
Extra protection is required when sharing data containing trade secrets.
Data Protection and Trade Secrets
The EU Data Act requires that data, including non‑personal data, is protected against unauthorized access.
Proemion deploys measures against unauthorized access to customers’ machine and personal data. To formalize these processes, Proemion established an Information Security Management System (ISMS) according to ISO/IEC 27001.
More information is available on Proemion´s Trust Center.
Switching of Data Processing Services
OEM Switching Providers
If an OEM wants to change the Data Processing Service provider (exit from Proemion), Proemion will support this request with a migration project. Data can be extracted as required, or a DataPump forwarding telematics data of the existing fleet to the new provider can be established. This will be handled as a project and – for the period until 12 January 2027 – invoiced based on effort.
Machine Owner Switching Providers
For the switch of a machine owner to a different telematics provider, Proemion currently cannot support a cloud switching service. A third party may request the data via REST API or the data can be sent via DataPump. A switch of the TCU to a third party currently cannot be supported.
Transparency and Information Obligations
As the OEM designs the Connected Product and offers it with the Related Services to their customers, the EU Data Act defines some additional obligations. As Proemion provides the Data Processing Service and at least the foundation for the Related Services, Proemion needs to fulfill some additional obligations towards the OEM. The following lists here are non-exclusive.
OEM Pre‑Contractual Obligations
Before closing a contract (sale, rent, lease) for a Connected Product, the User needs to be informed about (Article 3(2)):
- which data is collected,
- what format the data is in,
- what data volume the product generates,
- whether the data is generated continuously and in real time,
- where and how long it is stored,
- how to access, retrieve or, where relevant, erase the data.
Data Access by Design
Connected Products placed on the market after 12 September 2026 must be designed in a way that access to data is possible for Users. By using Proemion DataPlatform as described in the section User requested access to Data, access to data is already possible today. A DataPortal account with visualizations and analytics qualifies as a value‑added service which the OEM can re‑sell, provided that Users can still obtain their raw machine data free of charge through another channel.
Proemion Pre‑Contractual Obligations
Before closing a contract for the provision of DataPlatform, Proemion customers have the right to be informed about what data DataPlatform is retrieving, storing, and generating to provide the services (Article 3(3)).
Proemion provides this information via EU Data Act – List of Data. The pre‑contractual information additionally includes:
- where the data is stored,
- how to contact Proemion,
- how to request data sharing,
- whether trade secrets are involved.
Glossary
AEMP compliant
The AEMP, which is short for Association of Equipment Management Professional, is a Telematics Standard approved and recognised by the International Standards Organization and is subject to ISO 15143-3.
There are 2 AEMP interfaces at Proemion that allow
-
to export information out of our DataPlatform in the AEMP standard way, see also AEMP API.
-
to pull information into our DataPlatform from 3rd party systems, helping our customers to have all their data in one place. Contact your account manager if you want to get more information on or make use of the Mixed Fleet.
Aggregation
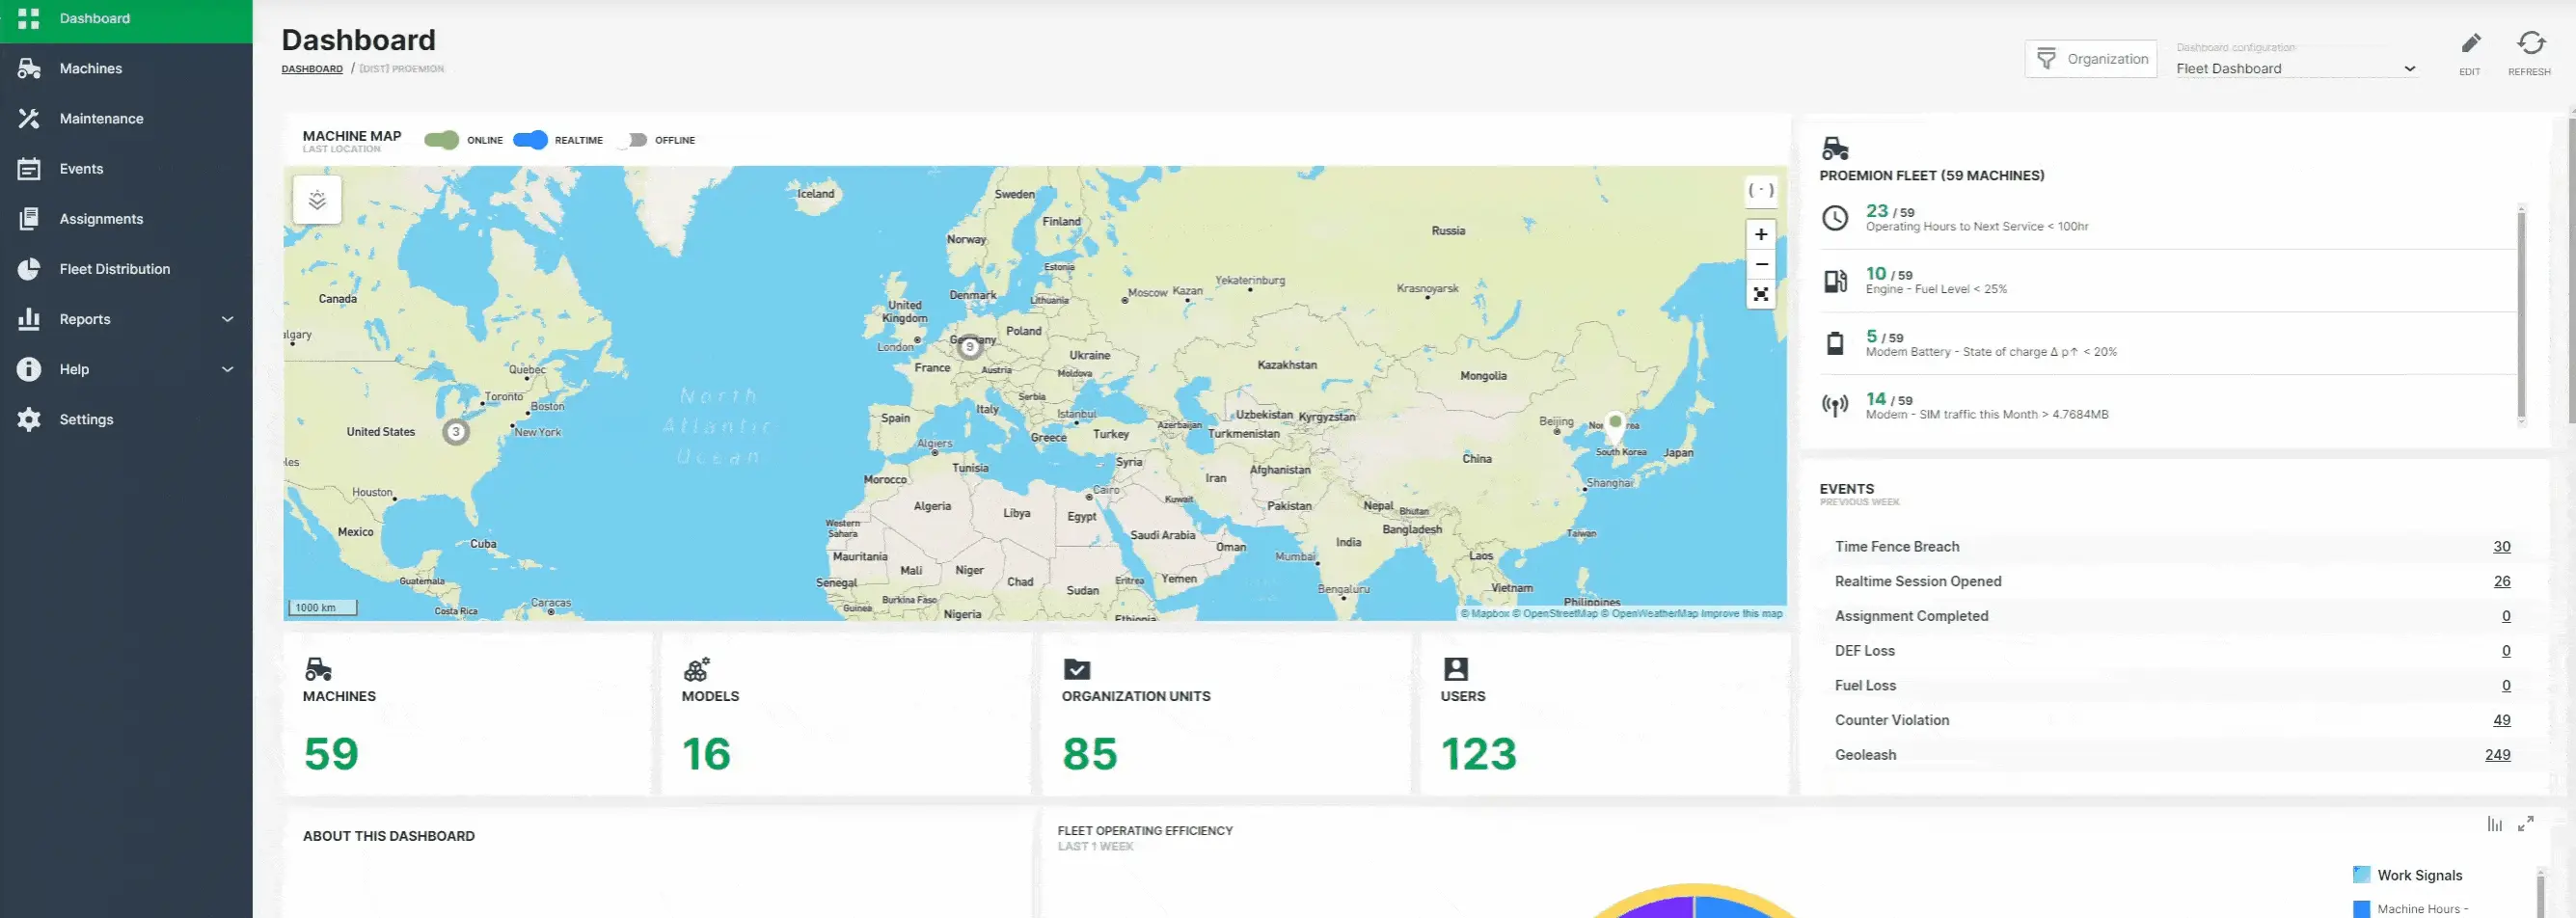
Minimum
Returns the smallest value in a Bucket.
Maximum
Returns the largest value in a Bucket.
Average
Returns the mean or the average of all values in a Bucket.
Standard Deviation
Returns the amount of variation of the values in a Bucket.
Sum
The resulting total of the signal values in a Bucket.
Cumulative Sum
Returns the sum of all values within the current Bucket and all previous Bucket sums in the selection. For example, the cumulative sums of the sequence 'a, b, c, ...', are 'a, a + b, a + b + c, ...'.
Serial Difference (Avg.)
Returns the difference of the averaged signal values from a previous Bucket to the next Bucket in a sequence.
Delta
Returns the difference between the last value before the time frame start and the last value before the time frame end. However, the DataPortal will return multiple delta values (one for each bucket):
-
if the time frame is larger than the bucket size
-
if the time frame start and end is on different calendar days
Note
Delta aggregation is only available for continuous counter signals (that are configured as such in the PDC and signals that do not reset at the end of an event.
Communication Unit
The Communication Unit (CU) is the hardware device - in principle the CANlink mobile series - manufactured by Proemion. The CU is installed, brought online, undergoes configuration and interfaces directly with the DataPlatform via the REST API or the DataPortal.
Dashboard
Visualization of machine details like location and other signals on a model/machine level or organization level.
Device
The Device is the physical hardware component of the communication unit. This component can be installed, brought online or taken offline.
Geo Data
Track
: A position history on the Machine is usually visualised as a line as shown.
The user can see similar tracks using the Machine Map widget.
Machine
The machine referred to in our documentation is the vehicle where the device is installed.
Model
The collection of features, functionality or characteristic (i.e. small, medium, large) that differentiates a type of machine from another.
Online Mode
The Online mode replaces the previously separate Logging and Realtime modes that are only used in some legacy devices. The Online mode connection type combines the functionality of both Logging and Realtime modes. For further information read the section Connection Types.
Organization Units
The Organization Unit or OU is an object within the DataPortal that contains its own Users, Machines and other Sub-Organizations. See Organizations.
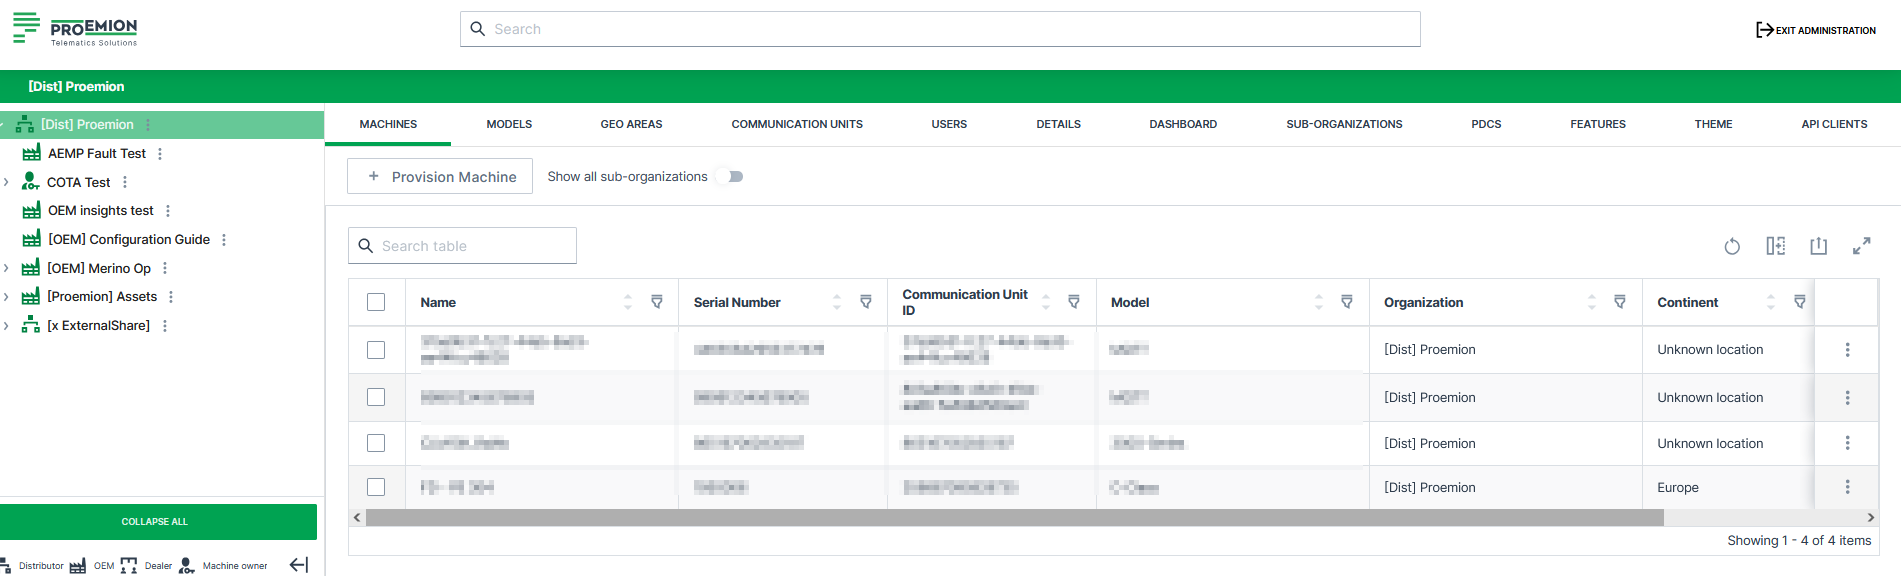
Tenant
Note
With the Business Units Concept, the first OEM organization in an organization tree automatically is a tenant.
Thereby, the tenant flag is not needed and available any longer.
The tenant is typically the machine manufacturer and thus also the higher-level administrative organizational unit containing most of the organizational assets and configurations. Assets managed at the tenant are Models, PDCs, Dashboards, Legal Documents, OEM Name, Efficiency Definitions, Machine Share Definitions, Asset Types and Configuration Bundles.
A tenant organization unit must be of Organization Type OEM and cannot have another tenant above it, i.e. must be a parent organization.
Revoking tenancy is not possible, respectively, revoking tenancy is possible only for newly created organizations.
Time Series Data
The following options described are used for time series data selection in the Reports.
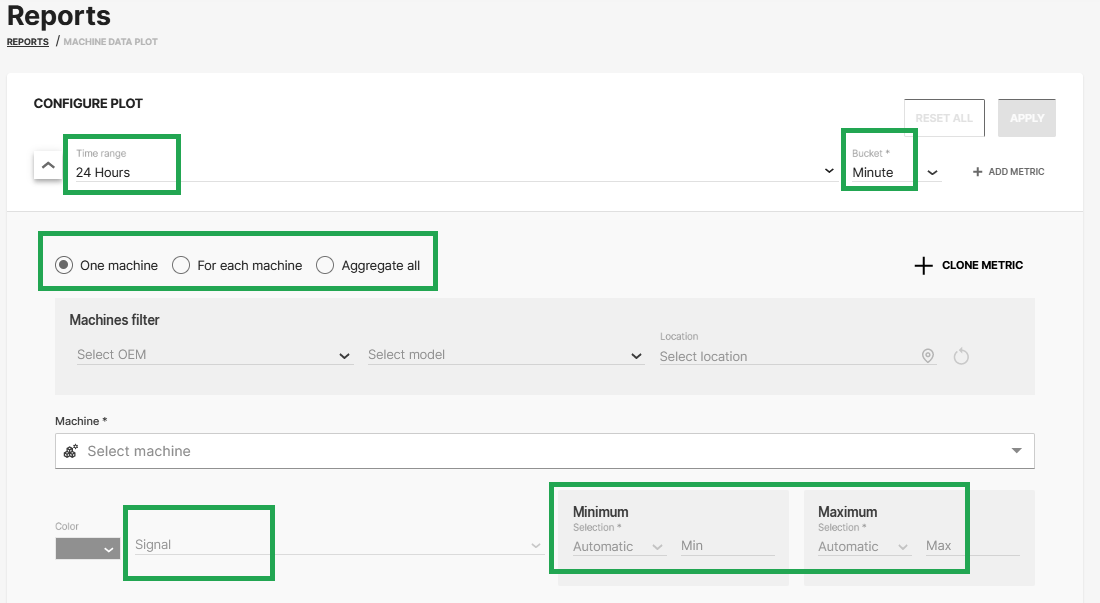
Signal
A set time series measurements.
Bucket
The bucket defines the time resolution of the output. All data points for the signal are combined using the defined aggregation type. When configuring Reports, the bucket Second can be selected, if the time range is below 3 hours, i.e. 2h 59 minutes or less, when combined with time range Absolute:
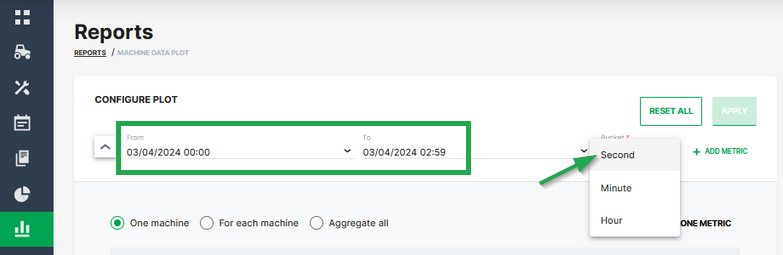
Aggregation
See also Aggregation
A mathematical function applied to all data points of a Bucket. The result of the Aggregation is one value that is provided as the value for the entire Bucket.
Aggregate all
This plotting option aggregates the selected signals of all applicable machines into a single signal. Usually used in combination with a machine Model selection. If a machine Model is selected the operation includes date from all machines of that Model. The selected signal is then aggregated into one single signal covering all machines.
For each machine
This plotting option shows one signal for each applicable machine. Usually used in combination with a machine Model selection. If that case one signal for each machine of the selected Model is provided.
Time series data handling
You can use the CANlink® mobile to send measured data of signal values via CAN messages from the CAN bus to the DataPlatform
Consider that signals with the same timestamp in one CAN message are stored into individual time-series entries and thus lose their "link" they have in the CAN message
The workflow is as follows:
-
The signals, i.e. their values, are logged/sent within 1 second, i.e. they get the same time stamp in the CAN message.
-
The DataPlatform then parses the message by signal first.
-
When the recorded signals get stored in the long-term database, a de-duplication takes place in the database and redundant values with equal time stamps get deleted
In detail, the first appearance of the signal will be stored, and other entries with the same time stamp and value of that signal will be deleted. Entries with the same timestamp and different values will be retained.
In case you need structured data access similar to tables, you could implement the following workarounds:
-
Transferring the tables as a file using the CANopen file transfer function, see also File Transfer
The files then can be retrieved via the REST API. -
Limiting the rate of transmitting the "table row" CAN messages to an interval >1 sec to ensure different timestamps for the rows but consistent timestamps for the measurement values.
-
Implementing a DataPump Service to get all measurement values as they are received
For more information, contact our Service and Support.
Leave Feedback
We appreciate your feedback!
That is why we have introduced a feedback feature to the DataPortal in order for you - as the Proemion customer - to provide feedback on the DataPortal interface.
How it works
1. Submit Feedback Form via DataPortal
You can fill out and submit a feedback form that is available in the DataPortal interface.
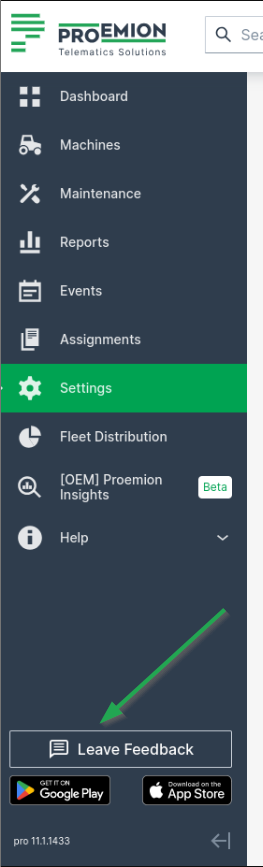
2. Data Collection
Upon submission, the system collects relevant data, including:
- Your user input from the feedback form.
- Additional metadata such as session details and logs.
- Replay data: Captures a playback of the user's session for better context.
Service and Support
The latest versions of the drivers, software, firmware, and documentation are available at Document Library.
Do you need help or want to report a bug?
Visit Proemion for more information, or raise a ticket via Support.
Firmware Updates and Support
To ensure the best performance and security of your devices, we strongly recommend always installing the latest firmware provided by Proemion.
Please note:
We do not provide technical support for issues caused by outdated firmware.
Errors resulting from outdated firmware are considered non-qualified errors and are not covered by warranty or support.
Regular firmware updates are essential to maintaining the functionality of your devices.
If you need assistance with the update process, please contact our Service and Support.
For more information on the Firmware Update, check the device manual of your device at the Document Library.