SCADA
The SCADA widget enables the creation of custom, SVG-based visualizations that dynamically display SCADA signals, with full responsiveness and proper scaling across all screen sizes.
SVG (Scalable Vector Graphics) templates are XML-based files used to create vector images that scale without loss of quality. In dynamic applications like SCADA widgets, SVG templates visualize real-time data by embedding placeholders replaced with live values during runtime.
The following documentation explains how to create SVG templates that display live signal data using Angular bindings — the frontend framework used in the DataPortal.
This guide provides all the necessary rules to create valid templates, without requiring detailed knowledge of the underlying system.
Note
This is an advanced widget that requires basic understanding of the SVG format. If you are not familiar with SVG creation refer to W3Schools` SVG basics for a general introduction.
Introduction SVG templates
Before connecting live data, the first step is to create a static SVG template using a vector graphics editor like Inkscape or a text editor. This base template defines the visual structure of your SCADA widget — including shapes, labels, and placeholders — and serves as the foundation for later data binding.
To get started, proceed as follows:
- Design your template with standard SVG elements (e.g.
<rect>,<circle>,<text>). - Save the file as plain SVG.
- Ensure that your SVG file contains a root
<svg>tag with thexmlns="http://www.w3.org/2000/svg"namespace, aviewBoxattribute for proper scaling, andwidth="100%"andheight="100%"for full responsiveness.
Save this base SVG template and open it in a text editor or a vector graphics tool to view and edit the source code.
This file includes a simple tank layout with placeholders for dynamic fill level and labels.
Replace your.signal.key with your actual signal values.
Once your base layout is ready, you can add dynamic behavior using the SCADA-specific bindings described below.
SVG template Structure
An SVG template consists of standard XML-based graphical elements such as:
- Shapes:
<rect>,<circle>,<path> - Text:
<text> - Containers:
<g>(group),<defs>,<clipPath>, etc.
Their appearance is controlled via attributes like x, y, width, height, fill, stroke, and transform.
To make templates dynamic, SCADA bindings are applied using:
data-attr-* attributesfor binding graphical properties- Angular-style {{ ... }} interpolations for inserting live signal values
Only a defined set of attributes is supported for data binding for safety and performance reasons.
The supported attributes are:
| Attribute | Description |
|---|---|
height |
Sets the vertical size of the element. Typically used with <rect>. |
width |
Sets the horizontal size of the element. Typically used with <rect>. |
fill |
Defines the fill color of the shape. Supports dynamic color changes. |
stroke-dashoffset |
Controls dash offset for stroked paths, often used for animated effects. |
from |
Starting value for an animation (used in <animateTransform>). |
to |
Ending value for an animation (used in <animateTransform>). |
x |
X-axis position of the element (e.g., <rect>, <text>). |
y |
Y-axis position of the element (e.g., <rect>, <text>). |
transform |
Applies transformations like rotate, scale, translate, or skew. |
Use these bindings to connect live signal data — such as speed, fuel level, or state — to visual components that update automatically.
For more information refer to SVG Validation and Configuring Signal Visualization.
Configuring Signal Visualization
All signals accessible on the machine specified in the widget are available under data ['signal.key'].
The following table lists the properties representing the current state of each signal available in the template.
| Property | Description | Example |
|---|---|---|
.value |
Raw numeric value. | 1200 |
.formattedValue |
Formatted and converted value string, ready for display (e.g., with unit suffix and number formatting). | "1.200" |
.signalLabel |
Signal’s descriptive label. | "Engine Speed" |
.unitLabel |
Unit of measurement label. | "RPM" |
.mappedValue |
State signal’s mapped label from the states object. Labels have to be mapped to state values. | "Running" |
.states[...] |
Lookup table converting numeric state codes to human-readable state labels. | 0 → "Stopped" |
The following example snippets illustrate how to create valid and responsive SVG templates for SCADA widgets, including dynamic data bindings, conditional rendering, live signal value display, and state-based formatting.
Bind Shape Attributes to Data
Use the data-attr-* syntax to bind SVG shape attributes to dynamic signal values.
Basic Example: Bind the height of a rectangle to the engine speed:
<rect x="10" y="10" width="50" data-attr-height="data['value.common.engine.speed'].value" />
Using Curly Brackets for Expressions
You can also use curly brackets.
<rect x="10" y="10" width="50" data-attr-height="{{data['value.common.engine.speed'].value}}" />
Example: Vertical Tank Level Visualization
<!-- Vertical Level Tank -->
<svg xmlns="http://www.w3.org/2000/svg" viewBox="0 0 120 220" width="100%" height="100%">

    <!-- animated water group -->
    <g id="water">
        <clipPath id="tankClip">
            <rect x="20" y="20" width="80" height="160" rx="6" ry="6" />
        </clipPath>
        <g clip-path="url(#tankClip)">
            <rect x="20" y="20" width="80" height="160" fill="#1e90ff" opacity="0.9"
                data-attr-transform="{{'translate(0,'+160 * (1 - data['value.common.engine.fuel.level'].value / 100) +')'}}">
                <animateTransform attributeName="transform" type="translate"
                    from="0,160"
                    data-attr-to="{{'0, '+160 * (1 - data['value.common.engine.fuel.level'].value / 100)}}"
                    dur="1s" fill="remove" />
            </rect>
        </g>
    </g>

    <!-- tank outline -->
    <rect x="20" y="20" width="80" height="160" rx="6" ry="6" fill="none" stroke="#aaa" stroke-width="3" />

    <!-- dynamic label and value -->
    <text x="60" y="200" text-anchor="middle">
        {{data['value.common.engine.fuel.level'].formattedValue}} {{data['value.common.engine.fuel.level'].unitLabel}}
    </text>
    <text x="60" y="215" text-anchor="middle">
        {{data['value.common.engine.fuel.level'].signalLabel}}
    </text>
</svg>
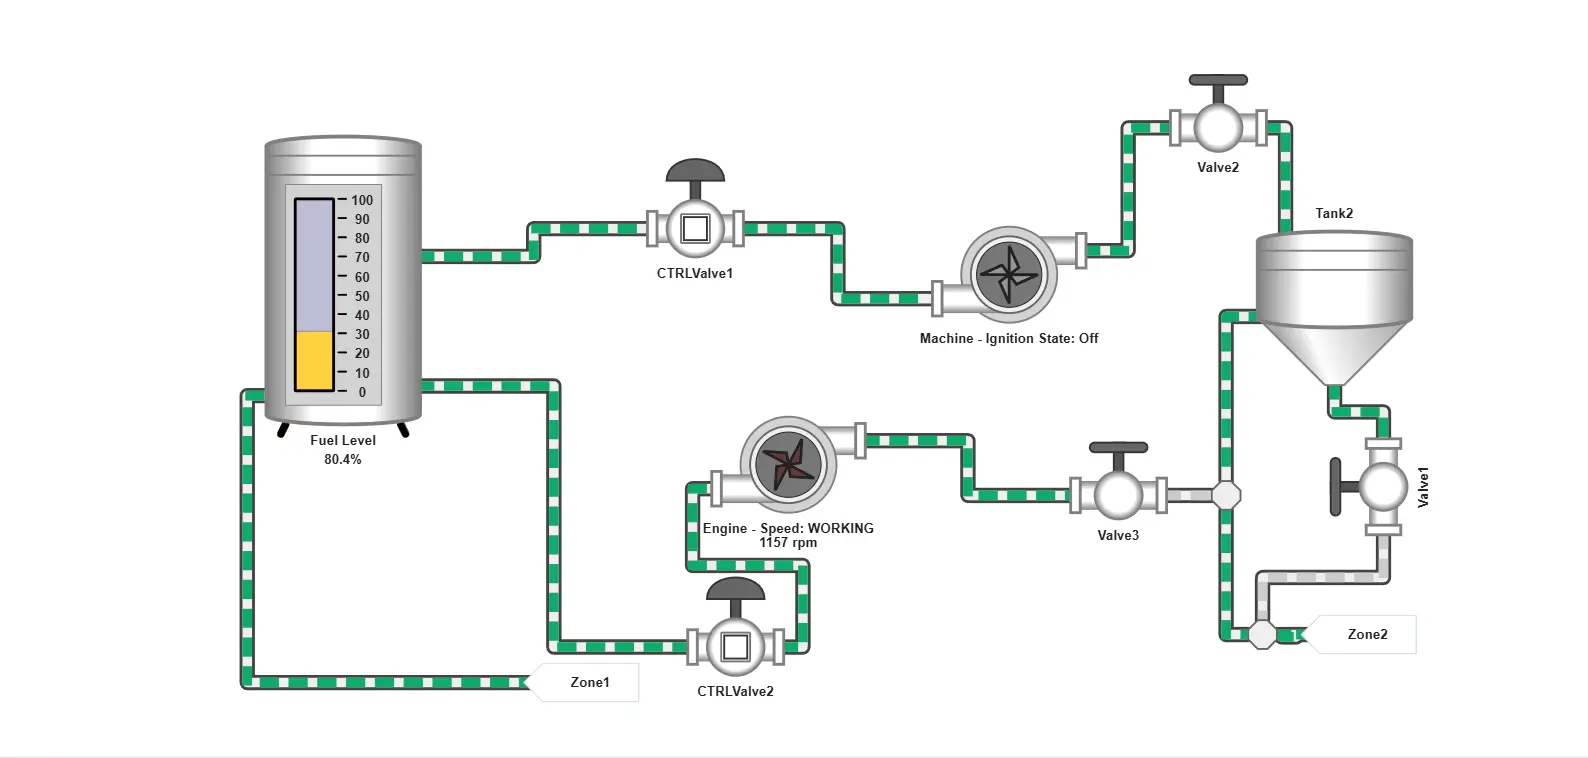
In this example, the fill level of a vertical tank dynamically reflects the value of the value.common.fuel.level signal.
The tank is clipped using an SVG clipPath, and its vertical position is animated smoothly using animateTransform.
clipPath is used here to visually constrain the animated fill level to the tank shape, ensuring it doesn't overflow the graphic boundaries.
This technique is especially useful for simulating tanks, progress bars, or other indicators with visual limits.
Using Conditional Expressions
<rect x="10" y="10" width="50" data-attr-height="data['value.common.engine.speed'].value > 50 ? 100 : 30" />
100 if the engine speed is greater than 50; otherwise, it sets it to 30.
Example: String Concatenation in Animations
To modify the to attribute of an animateTransform element using concatenation, standard JavaScript string concatenation is used to build the value.
<animateTransform
attributeName="transform"
attributeType="XML"
type="rotate"
from="0 346.08453 136.86678"
data-attr-to="{{(data['value.common.machine.speed'].value * 2) + ' 346.08453 136.86678' }}"
dur="1s"
fill="freeze"
/>
| Attribute / Expression | Description | Example / Output |
|---|---|---|
attributeName="transform" |
Specifies the attribute to animate. | transform |
attributeType="XML" |
Standard SVG attribute type. | XML |
type="rotate" |
Indicates the transformation type. | rotate |
from="0 346.08453 136.86678" |
Animation starts at 0° rotation around a specific point. | Rotation origin: (346.08453, 136.86678) |
data-attr-to="{{; (data['value.common.machine.speed'].value * 2) + ' 346.08453 136.86678' }}" |
Dynamic target rotation angle and pivot point, built using data and string concatenation. | e.g. "120 346.08453 136.86678" |
data['value.common.machine.speed'].value |
Retrieves the machine speed from the data source. | e.g. 60 |
* 2 |
Scales the speed value to define rotation angle. | 60 * 2 = 120 |
+ ' 346.08453 136.86678' |
Concatenates the pivot point as a string to complete the value. | '120 346.08453 136.86678' |
dur="1s" |
Duration of the animation. | 1s |
fill="freeze" |
Freezes the final state after the animation completes. | Final state remains visible |
Display Signal Values
To display live signal values, use curly brackets {{ ... }} inside <text> elements, ideal for formatted, human-readable output.
Example: Display formatted engine speed
<text x="70" y="30">
  {{data['value.common.engine.speed'].formattedValue}}
</text>
| Element | Description |
|---|---|
{{ ... }} |
Template syntax to insert dynamic data into text elements. |
data['engine.speed'] |
Accesses the signal object for engine speed. |
formattedValue |
Returns the signal’s current value, converted into the user's selected unit system and formatted according to the signal's format attribute (e.g. number format, unit suffix). |
Display Signal Labels and Units
Combine signal label and unit inside <text> elements using data bindings for clarity.
Example:
<text x="70" y="50">
  {{data['value.common.engine.speed'].signalLabel}} ({{data['value.common.engine.speed'].unitLabel}})
</text>
| Property | Description |
|---|---|
signalLabel |
The descriptive name of the signal (e.g., "Engine Speed"). |
unitLabel |
The unit of measurement for the signal (e.g., "RPM"). |
Use Mapped Values
For state signals, display the label matching the current state value.
Example:
<text x="100" y="70">
  {{data['value.common.engine.state'].mappedValue}}
</text>
This shows the mapped label corresponding to the current state.
The example above shows the full functionality of mappedValue.
However, it's also possible to display static states directly or to show the value of any other state — even if it’s not currently active.
Use State Lookups
If the signal uses numeric codes to represent states, convert these codes into human-readable labels by indexing the states list with the current value.
Example:
<text x="100" y="90">
  {{data['value.common.engine.state'].states[0]}}
</text>
Workflow after SVG Creation
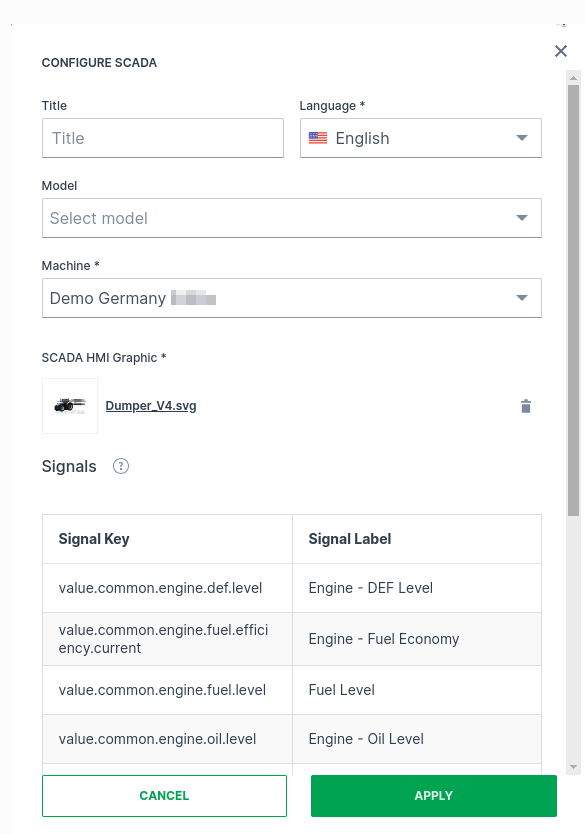
When uploading a valid, data-enabled SVG file to the DataPortal (refer to section Configuration in DataPortal) the system scans the markup and attempts to match it with available signals. Once a successful match is found, a preview of the uploaded SVG is shown along with a table listing all identified signals in both the SVG markup and the machine (or signal catalog). This allows users to verify correct rendering within the widget.
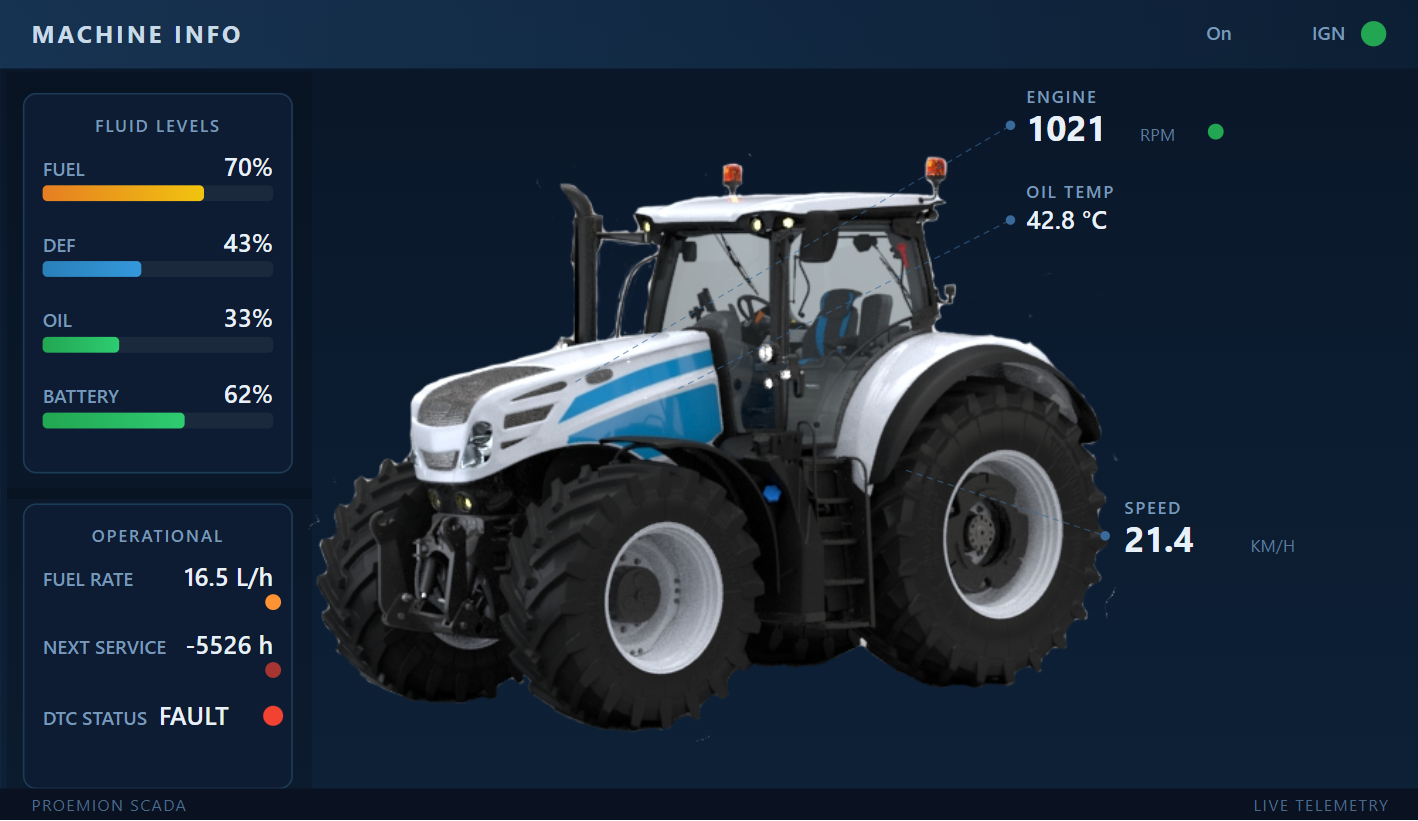
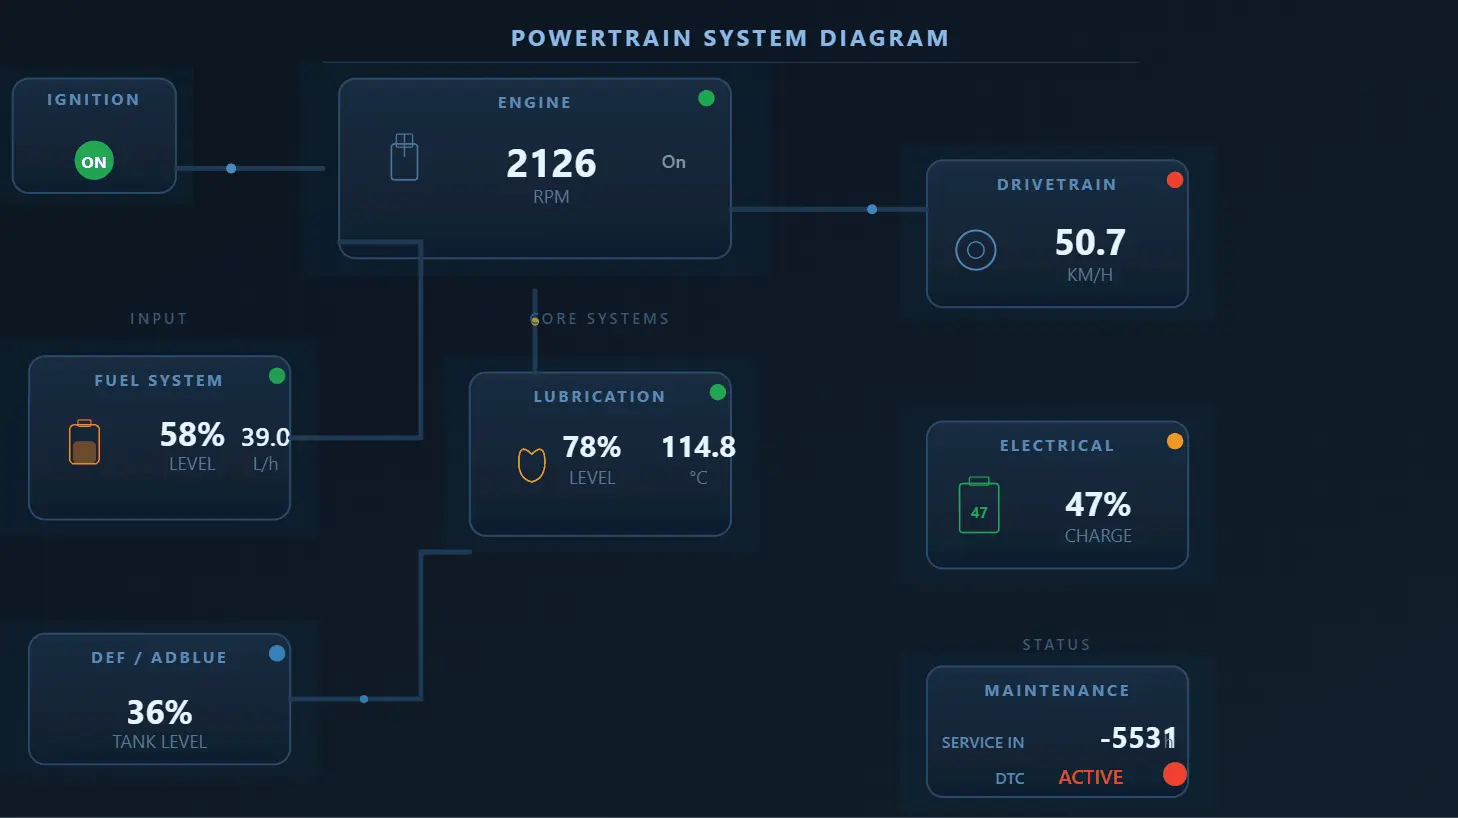
After clicking Apply, the widget displays the SVG with all signal placeholders replaced by live measurement values from the selected machine.
By pressing the Refresh button in the top-right corner, users can see the widget update automatically as new signal data becomes available. To stop the refresh of the dashboard click the Refresh button again.
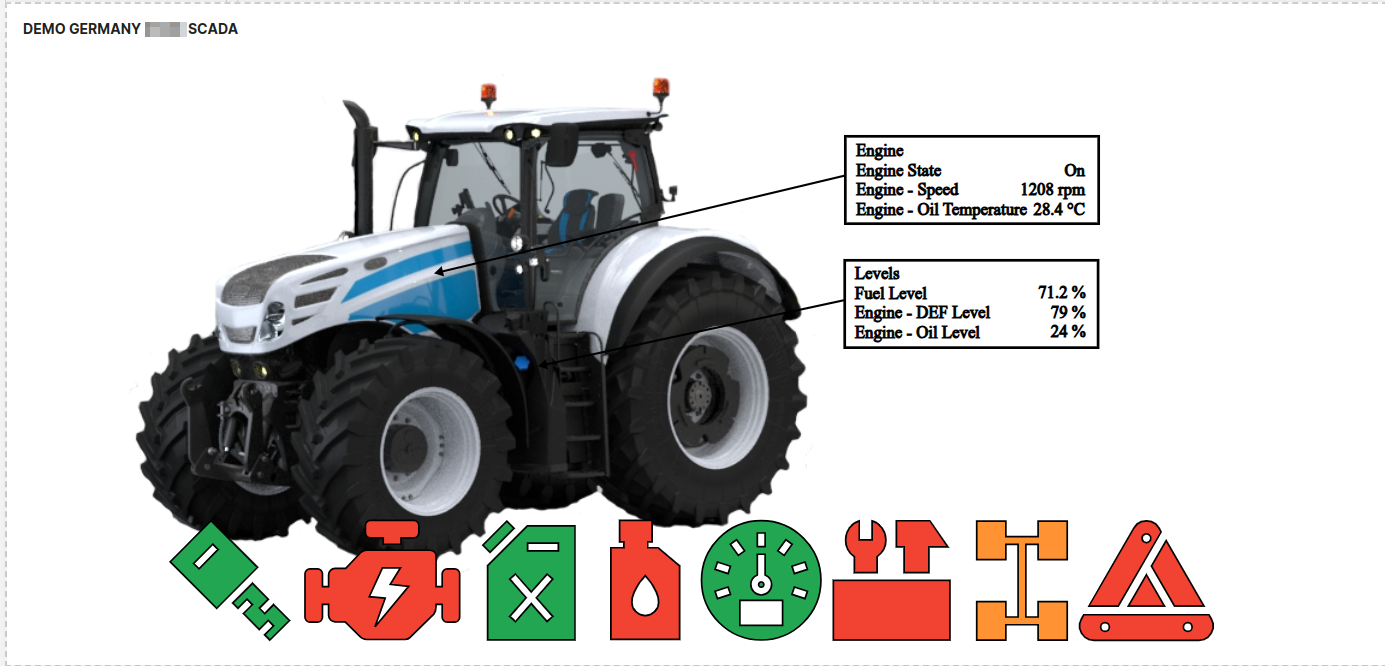
Save this advanced example SVG file of the displayed tractor image and open it in a text editor or vector graphics tool to view and edit the source code. The provided SVG demonstrates a more complex SCADA visualization and was created in Inkscape, which adds editor-specific metadata and attributes. It requires a solid understanding of SVG structure and Inkscape’s features.
SVG Validation
A set of SVG validations ensures the SCADA widget behaves correctly. Error messages appear during image upload or in existing widgets when issues are detected.
| Validation | Description | Error Message Example |
|---|---|---|
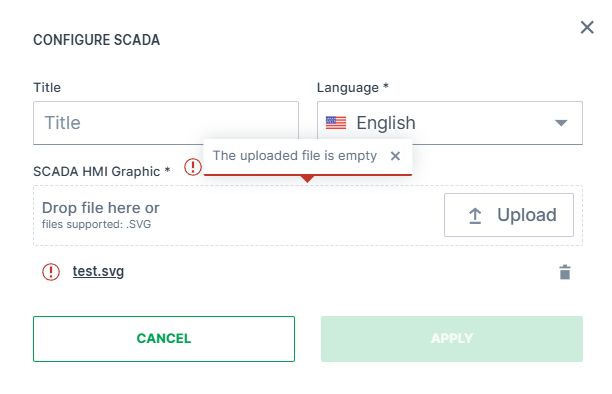
| SVG validity | SVG must be valid and well-formed. An error appears if the file is empty or not a valid SVG. | The uploaded file is empty. The uploaded file is not a valid SVG format. |
Root <svg>element |
The file must contain a single root <svg>. |
The uploaded file is not a valid SVG format. |
Namespace (xmlns) |
The SVG element must declare the standard XML namespace: xmlns="http://www.w3.org/2000/svg". | The uploaded file is not a valid SVG format. |
| HTML entities | Special characters in attribute expressions (e.g. >) must be escaped (>) to remain valid XML. |
The uploaded file is not a valid SVG format. |
| Invalid markup | Errors occur if tags are improperly closed or malformed, e.g., <svg><rect><text>test</rect></svg> (missing closing <text>). |
Invalid SVG markup detected: This page contains the following errors: error on line 538 at column 125 attribute construct error. Below is a rendering of the page up to the first error. |
| Required attributes | All SVGs must include width="100%", height="100%", and a viewBox attribute to ensure full responsiveness and proper scaling of the widget. Missing any will trigger an error. |
The SVG must include a viewBox attribute for proper scaling and positioning. |
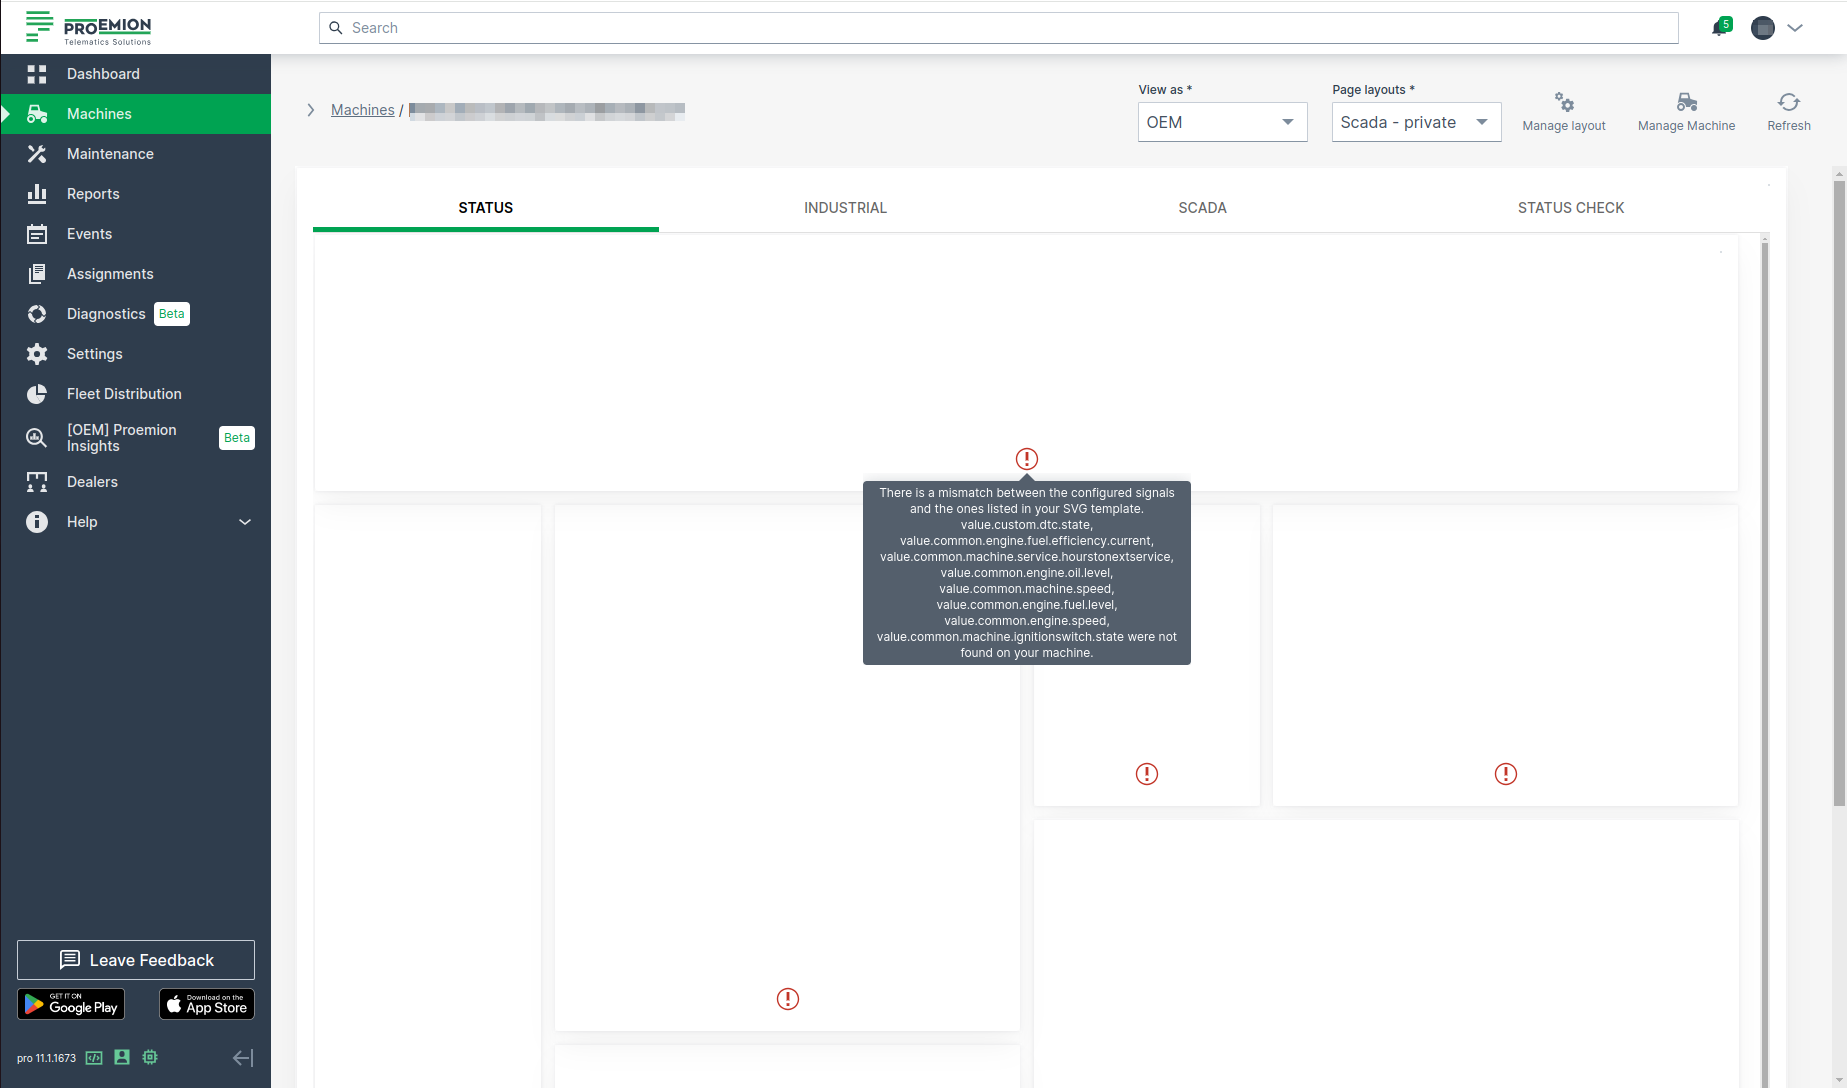
| Signal key validation | Errors specify missing or invalid signal keys not found on the machine or in the signal catalog. | There is a mismatch between the configured signals and the ones listed in your SVG template. value.custom.dtc.boom, value.common.engine.fuel.efficiency.future were not found on your machine. |
| No signal keys used | An error is raised if no signal keys are found, as the widget would be non-functional. | No valid signal keys were found in the uploaded SVG. |
These validations also apply to widgets already added. If a configured signal is removed or lost, the corresponding validation errors will appear directly in the widget.
Configuration in DataPortal
Configure the widget and put it on the Organization Dashboard and/or the Model Dashboard by following the steps below:
- For Organization Dashboards, the matching is performed against the signals of the selected machine.
- For Model Dashboards, the system searches across the entire signal catalog.
This broader search ensures compatibility, as machine dashboards can be reassigned to different machine models that may not support the originally configured signals.
It is highly recommended to adapt a Machine Page (Model Dashboard) centrally via the Machine Page Layout. If you need to configure the Machine Page for the selected machine only, proceed as follows:
-
In the selected Machine Page, select Manage Layout > Add widgets.
-
Select the desired widget. A preview will be shown.
-
Click Apply. This forwards you to the widget configuration dialog with the options described below.
If you need to adapt the Organization Dashboard, select the desired dashboard configuration and click Edit > Add  to open the widgets catalog, see also Add Widgets to the Organization Dashboard.
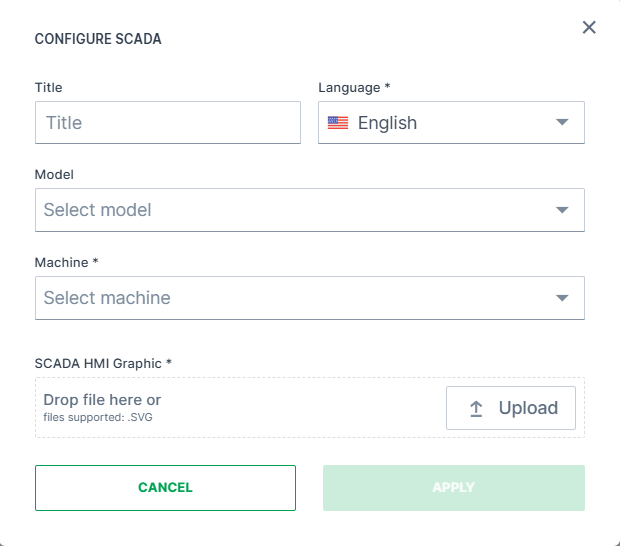
| Item | Description |
|---|---|
| Title | The label for the widget (English is the default, additional languages must be configured). |
| Language | Select the language for the title of the widget. |
| Model* | Model name. |
| Machine* | Machine name. |
| SCADA HMI Graphic | Upload SVG image. |
*These config options can only be selected from the Organization Dashboard. When configuring the widget, the user must select a machine if the widget is being added to a Organization Dashboard. For Model Dashboards, no selection is necessary, as the machine context is automatically derived.