DTC
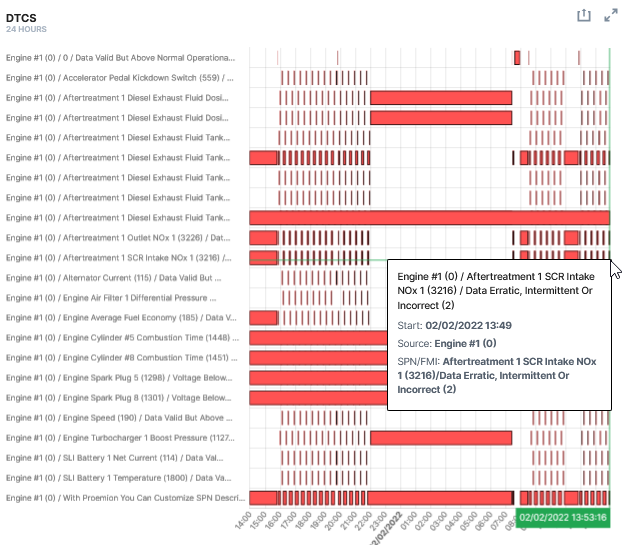
The DTCs widget allows the user to see if there are any Diagnostic Trouble Codes (DTC) codes transmitted within a specified time period.
Configuration
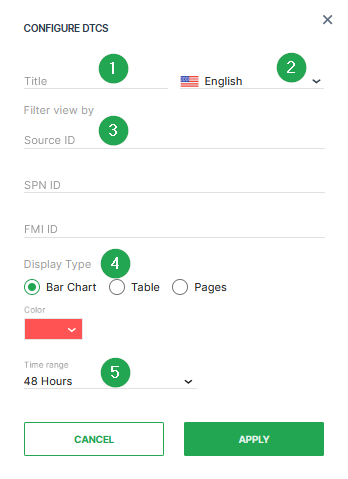
Configure the widget and put it on the Organization Dashboard and/or the Model Dashboard by following the steps below:
c
| # | Item | Description |
|---|---|---|
| 1 | Title | The label for the widget (English is the default, additional languages must be configured. See Language below). |
| 2 | Language | Select the language for the title of the widget. |
| 3 | Filter view by | This option allows to set a filter for the Source ID, SPN ID or FMI ID. By default, all filters are open. |
| 4 | Representation | Select the Display Type (Bar Chart, Table or Pages) and the Color. |
| 5 | Time | Select a predefined, relative time range, e.g. Last 24 hours or select a custom one, e.g. This last 5 Days, see Time selection. |
Note
The DTC entries in the widget are sorted according to SPN.
Once you have completed configuring the DTC widget, select Apply to save your settings.
Sample
You can view the chart in fullscreen mode by selecting the icon in the upper right-hand corner of the widget.
Suggested Usage: Detect any fault or recurring issues on the Machines or component.