1. Introduction
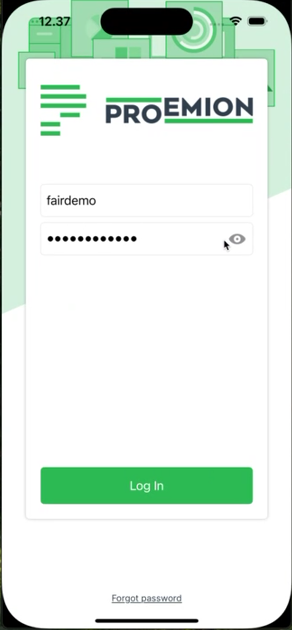
The Machine Companion App operates as an extension of the machine for accessing machine-related insights and linking OEMs, Dealers, and Machine Owners.
The app is available on both Android and iOS platforms.
The main target groups of the app are:
-
Machine Owners with a smaller number of machines compared to the OEM.
-
Dealer or OEM organizations handling maintenance tasks.
The app can be offered in 2 variants:
-
Standard Proemion variant.
The standard app is set up with the standard signals for the machines accessible by the Machine Owner.
The app can be downloaded freely and is available on both Android and iOS platforms, see Machine Companion App (Google Play) and Machine Companion App (App Store).
Here, no branding or customization takes place. -
Customized/white-labelled variant.
The customized, paid variant can be delivered through the OEM’s own Google Play and App Store channels.
During the initial phase, Proemion will collect the details from the OEM to set up the app.-
Signals can be customized to highlight the key metrics.
For more information, see Signals List. -
Custom theme/color scheme can be applied.
-
SSO Authentication can be implemented, if required, see Login.
-
| Customers who choose a white-labeled DataPortal URL must also upgrade to a white-labeled Machine Companion App, as access to the standard Proemion app will be restricted. White-labeling the portal and app should be considered as part of the same upgrade or purchase to ensure uninterrupted access and a consistent user experience. |
2. Features
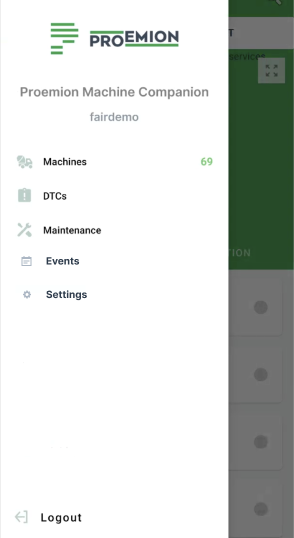
The side panel menu offers the following options: Machines, DTCs, Maintenance, Events and Settings to view the relevant machine data and get more insights.
| The Maintenance screen is enabled only if the OEM has opted for Maintenance. |
2.1. Machines
The Machines screen shows the inventory of available machines, presented in both list and map views.
In both list and map views, you can:
-
Search machines.
-
Sort them by "Machine", "Model", "Organization Name" and "Service due dates".
-
Use the filters "Machine Mode" (status "Realtime" or "Logging"), "Model", "Organization" and "Warnings" (regarding "Fuel" and "Adblue").
Both the list and map view offer warning icons to be displayed at a glance, i.e. when fuel or AdBlue levels are low and when there are active diagnostic trouble codes (DTCs).
They also display icons for the color-coded status of maintenance tasks, e.g. overdue, upcoming, completed or skipped tasks.
A detailed view is offered in the dedicated tabs, see Machine Details:
-
Low Fuel Level:


Details are shown in the Fuel tab.-
If the "fuel level" is available and is > 15% and ≤ 20%, the icon is yellow.
-
If the "fuel level" is < 15%, the icon is red.
-
-
Low AdBlue Level:


Details are shown in the Fuel tab.-
If the "AdBlue level" is available and is > 15% and ≤ 20%, the icon is yellow.
-
If the "AdBlue level" is < 15%, the icon is red (only on Android versions).
-
-
Active Diagnostic Trouble Codes (DTCs):

Details are shown in the DTCs tab.-
If any DTC is active, the icon is red.
-
-
Maintenance:

Details are shown in the Maintenance tab.
Color Coding for Maintenance Tasks:-
Skipped: Grey
-
Completed: Green
-
Overdue: Red
-
Upcoming: Yellow: For tasks due soon, i.e. hours remaining until the next service.
-
2.1.1. Machines List
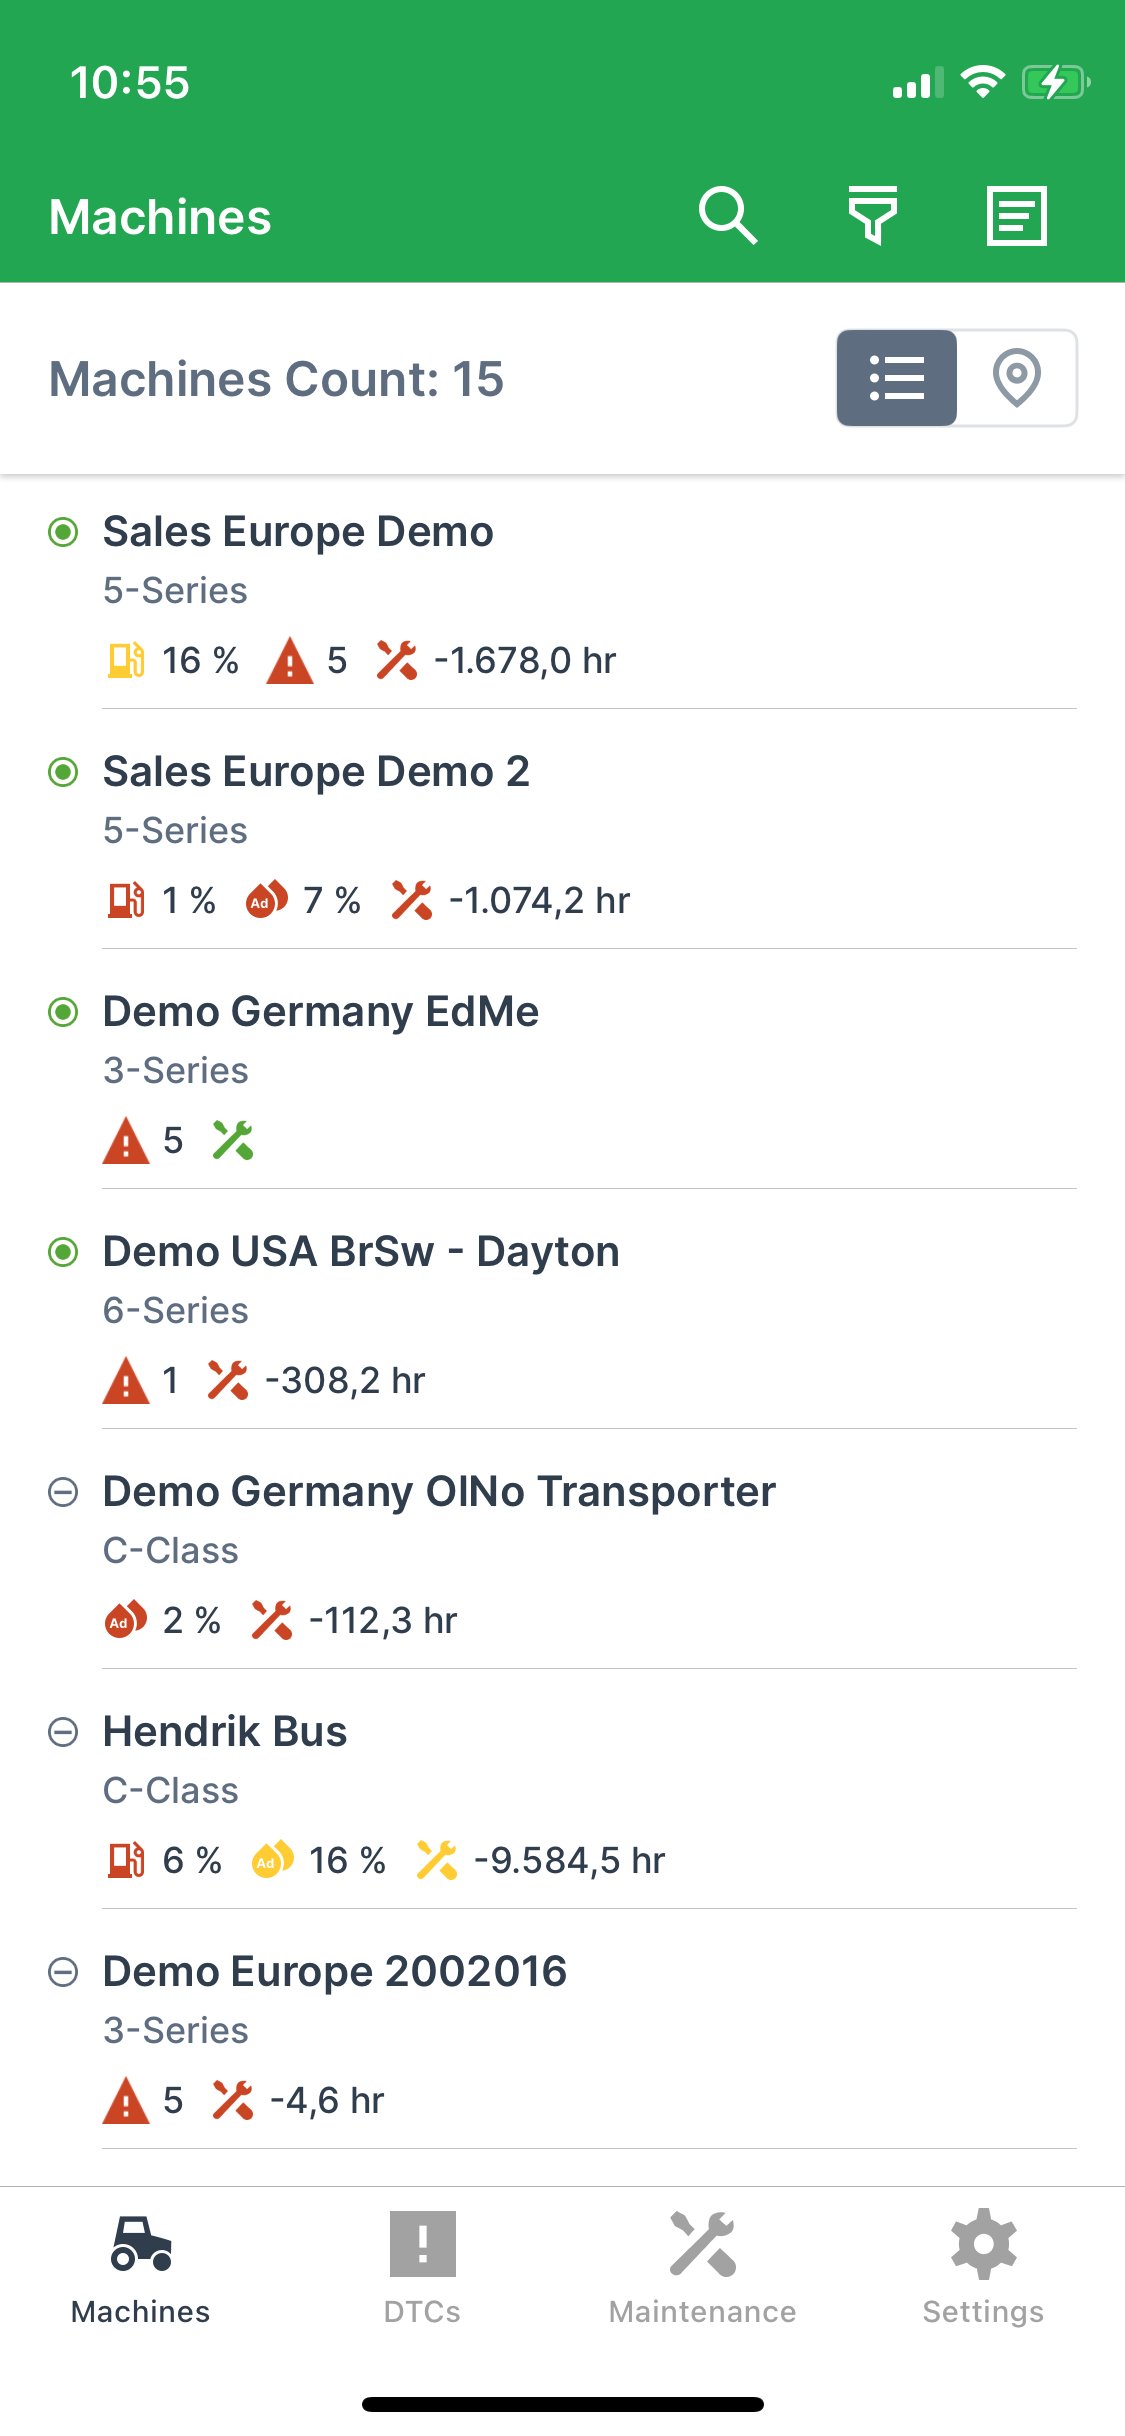
The list view offers:
-
Selecting a machine, redirects you to the Machine Details.
-
Icons for maintenance tasks, fuel or AdBlue levels and active diagnostic trouble codes are also displayed as described above.
2.1.2. Machines Map
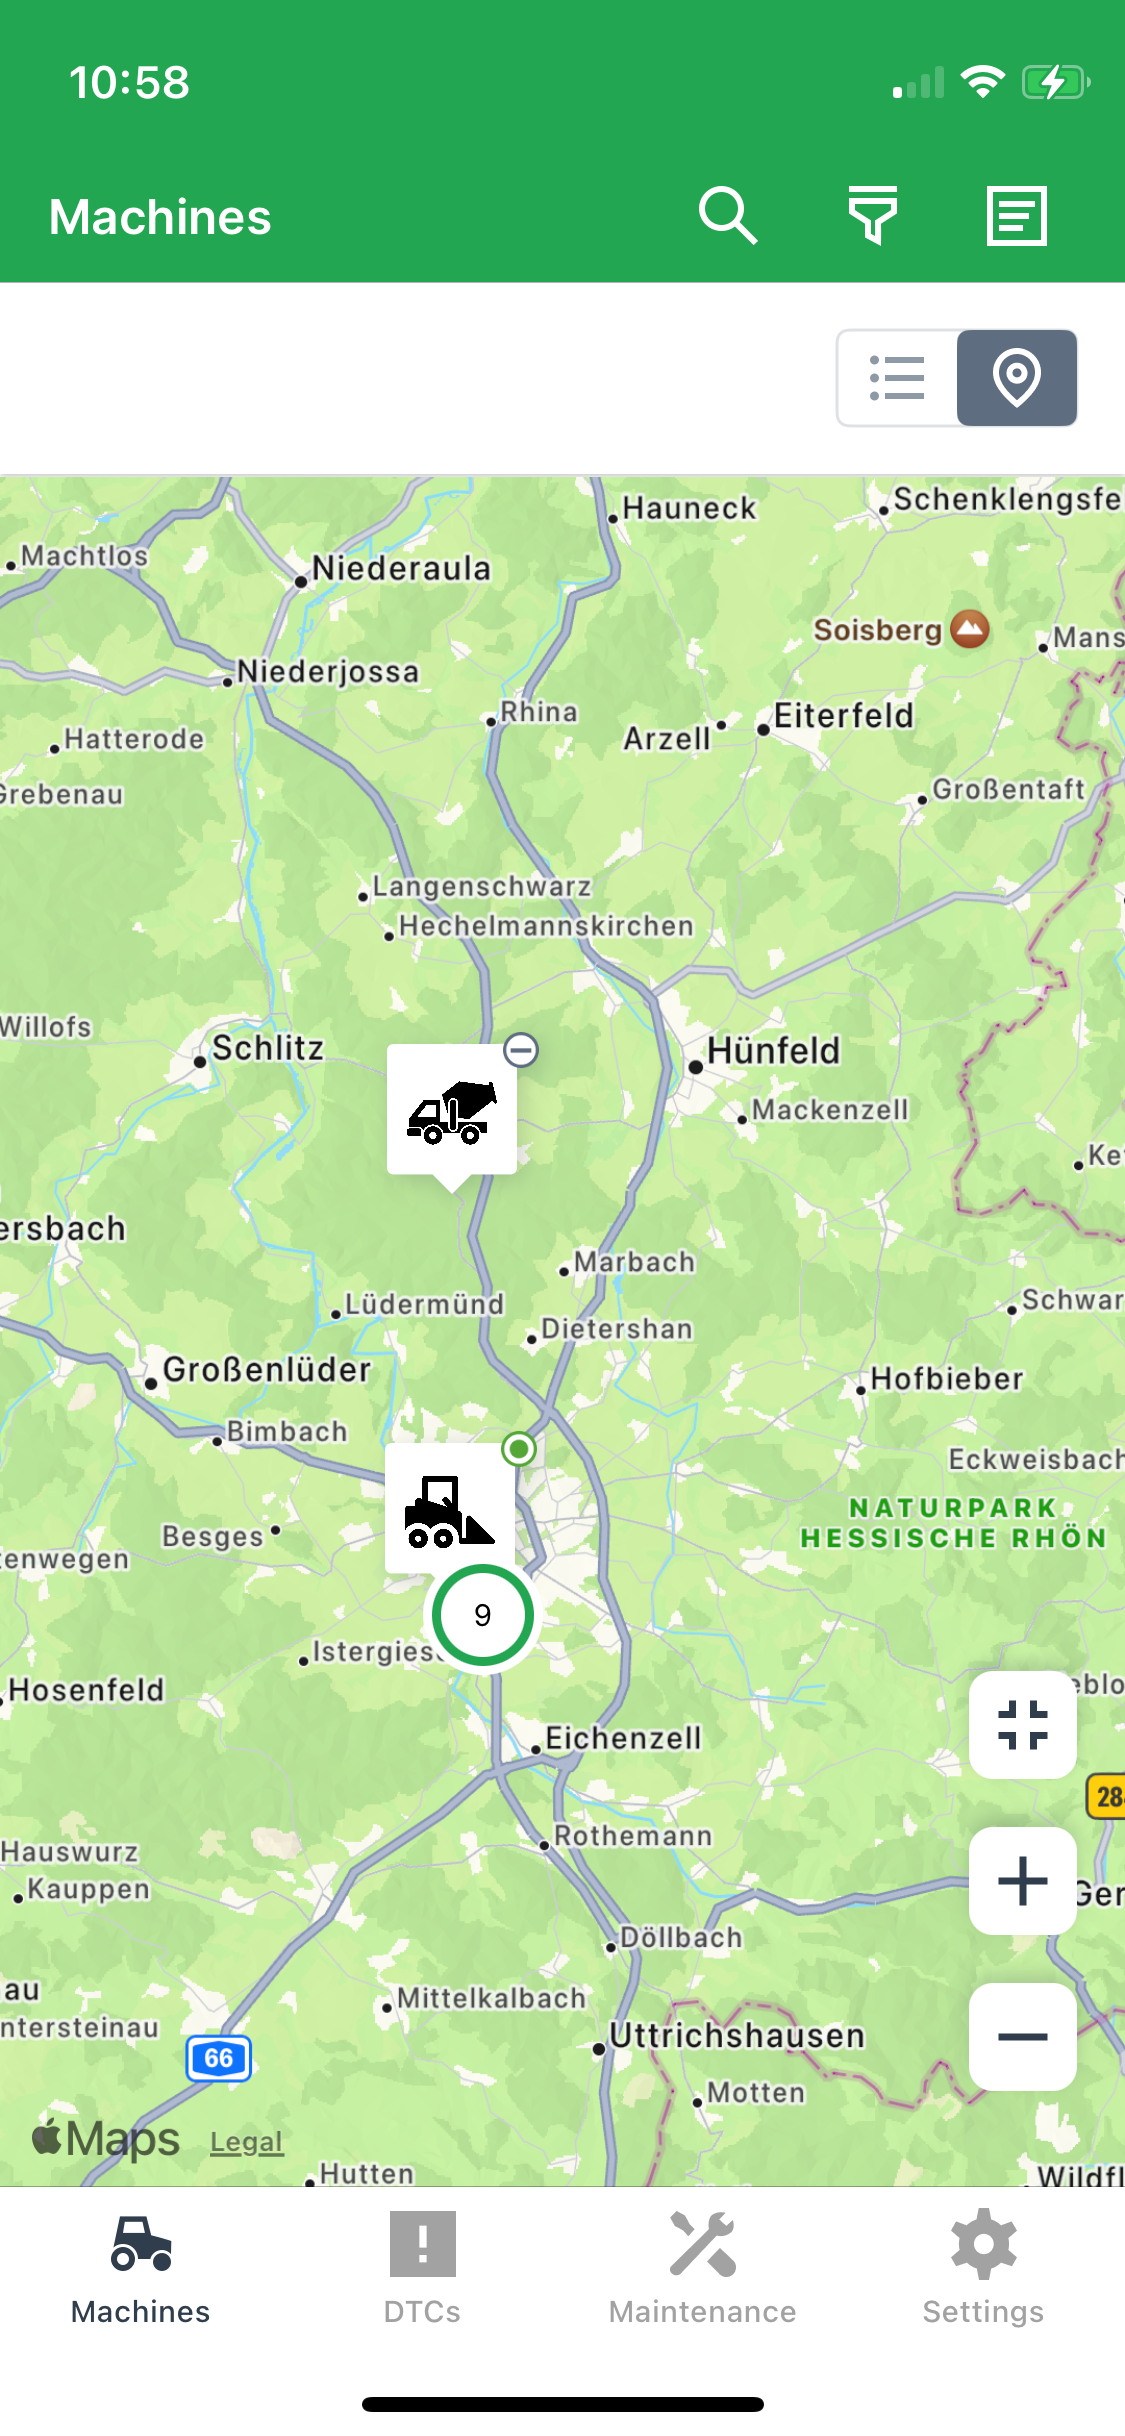
The map view additionally offers:
-
Improved accessibility through the display of machine clusters.
Zooming in reveals more detailed information, down to individual machines.
For detailed descriptions, refer to Map view section in the DataPortal manual. -
Machines are displayed with the machine model asset icon with the online/offline status.
Note that this must be activated via the Themes Behavior option. -
Zoom controls (Zoom In, Out, and Reset) to adjust the map view, enhancing visibility of the machine location and selecting a specific machine.
-
Location data and navigation options, allowing users to access machine details or use Google Navigation to navigate to the machine’s location.
-
Icons for maintenance tasks, fuel or AdBlue levels and active diagnostic trouble codes are also displayed as described above.
-
Warning when location data has been sent a long time ago.
2.1.3. Machine Details
The Machine Details screen is accessible both from both the list view and map view, allowing machine owners to access and monitor the machine metrics in various tabs.
See Machine Details.
2.2. Machine Details
The Machine Details with the tabs can be accessed for each machine from both the list and map view in the Machines screen.
| Irrespective from machine location all machine data displayed in the Machine Companion App is shown in the time zone configured in the personal user settings via the Account Settings in the DataPortal. |
2.2.1. General tab
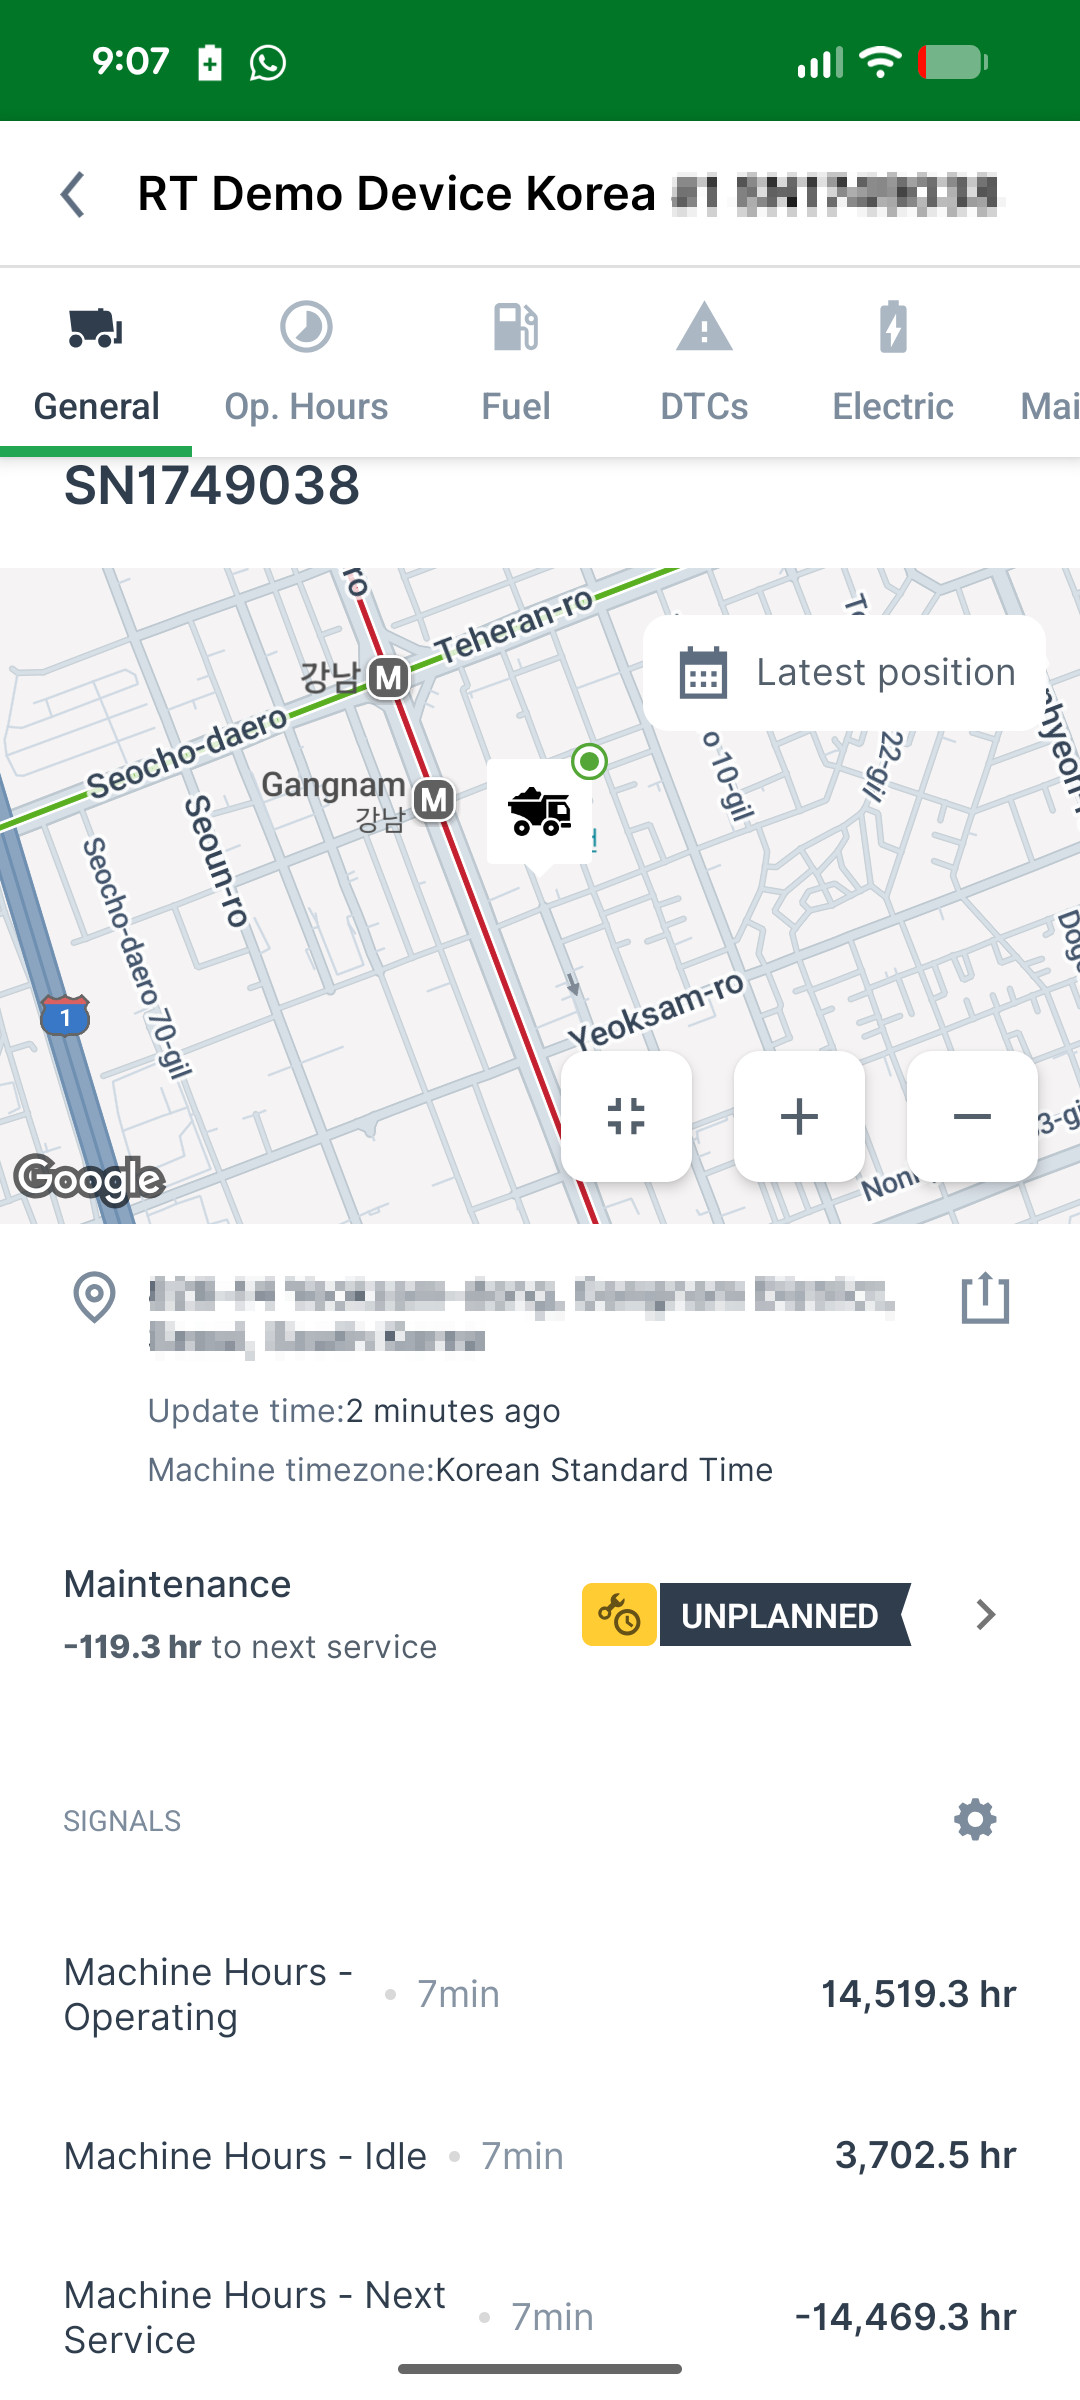
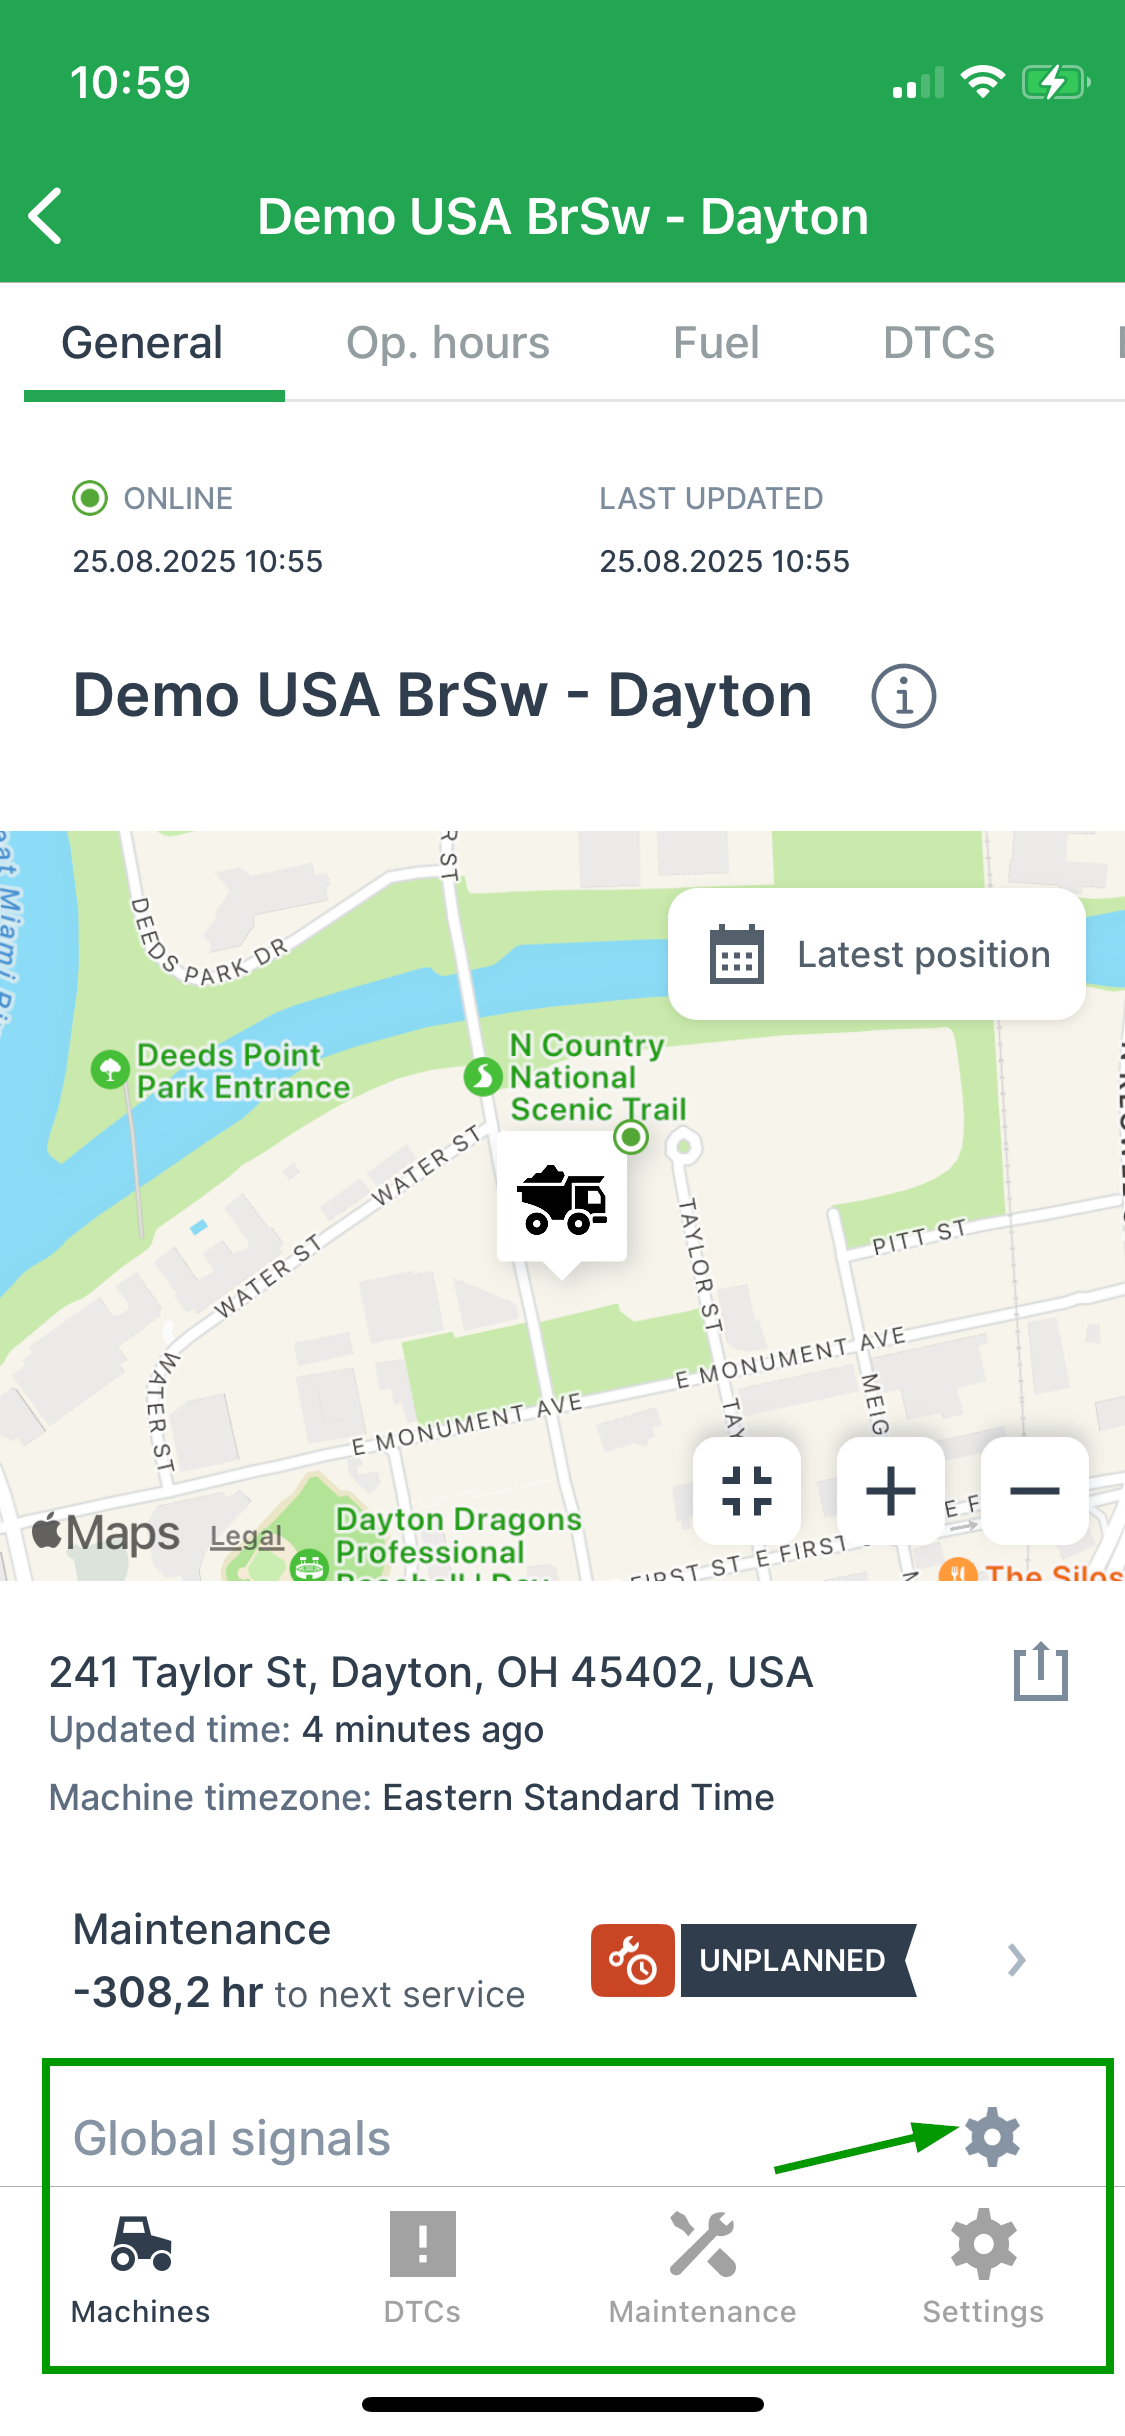
The General tab provides insights such as the status, work metrics and geolocation of the machines:
-
Location History Plotting within pre-configured time ranges (available to users with the minimal permission set: Location: History, see permission sets).
-
Geolocation details including the option to share or navigate to the machine’s location, see Share Live and Static Location.
-
Maintenance status indicators provide color-coded statuses for each maintenance task, including "upcoming", "overdue", "skipped", and completed tasks determined based on either the Proemion maintenance feature or the "Hours to next service" metric, providing a centralized hub for maintenance data.
Select a task to view the details of a maintenance, see example in the Maintenance chapter. -
Zoom controls (Zoom In, Out, and Reset) to adjust the map view, enhancing visibility of the machine location and selecting a specific machine.
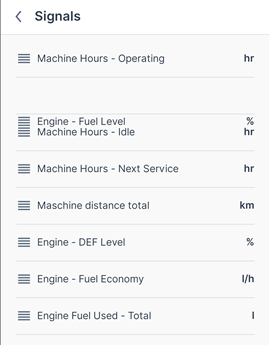
Signals List
The list of Signals in the General tab displays essential Proemion standard machine signals and, if defined, also accommodates aliased signals instead of Proemion standard signals.
This list displays the most recent update time and value for each signal available to the user for the selected machine.
Adapt the Signals list
This list can be customized to display the required machine signals within the app, based on the OEM configuration:
-
Signal names and units are localized based on the user’s preferred language (English, German and Italian) and unit system.
Depending on the device settings, signal names are localized in English, German and Italian. -
Machine owners can prioritize the order of signals by dragging and dropping them according to their individual importance, see Reorder Signals.
The set of signals used for your Machine Companion App is listed in Settings > Signals.
Custom Signals
For the white-labeled variants, the signal list additionally supports both standard and custom signals based on the OEM preferences, which can be configured during the initial setup, see also Introduction.
Reorder Signals
The list of signals can be reordered by the machine owners according to their priority using drag-and-drop.
By reordering the signals, you change their position shown in the General tab of each machine.
The order can be changed via Settings > Signals or through the settings icon in the General tab.
To move the signal, select/hold and move the signal to the desired position:
Share Live and Static Location
Use the following options within the General tab to share the machine’s locations:
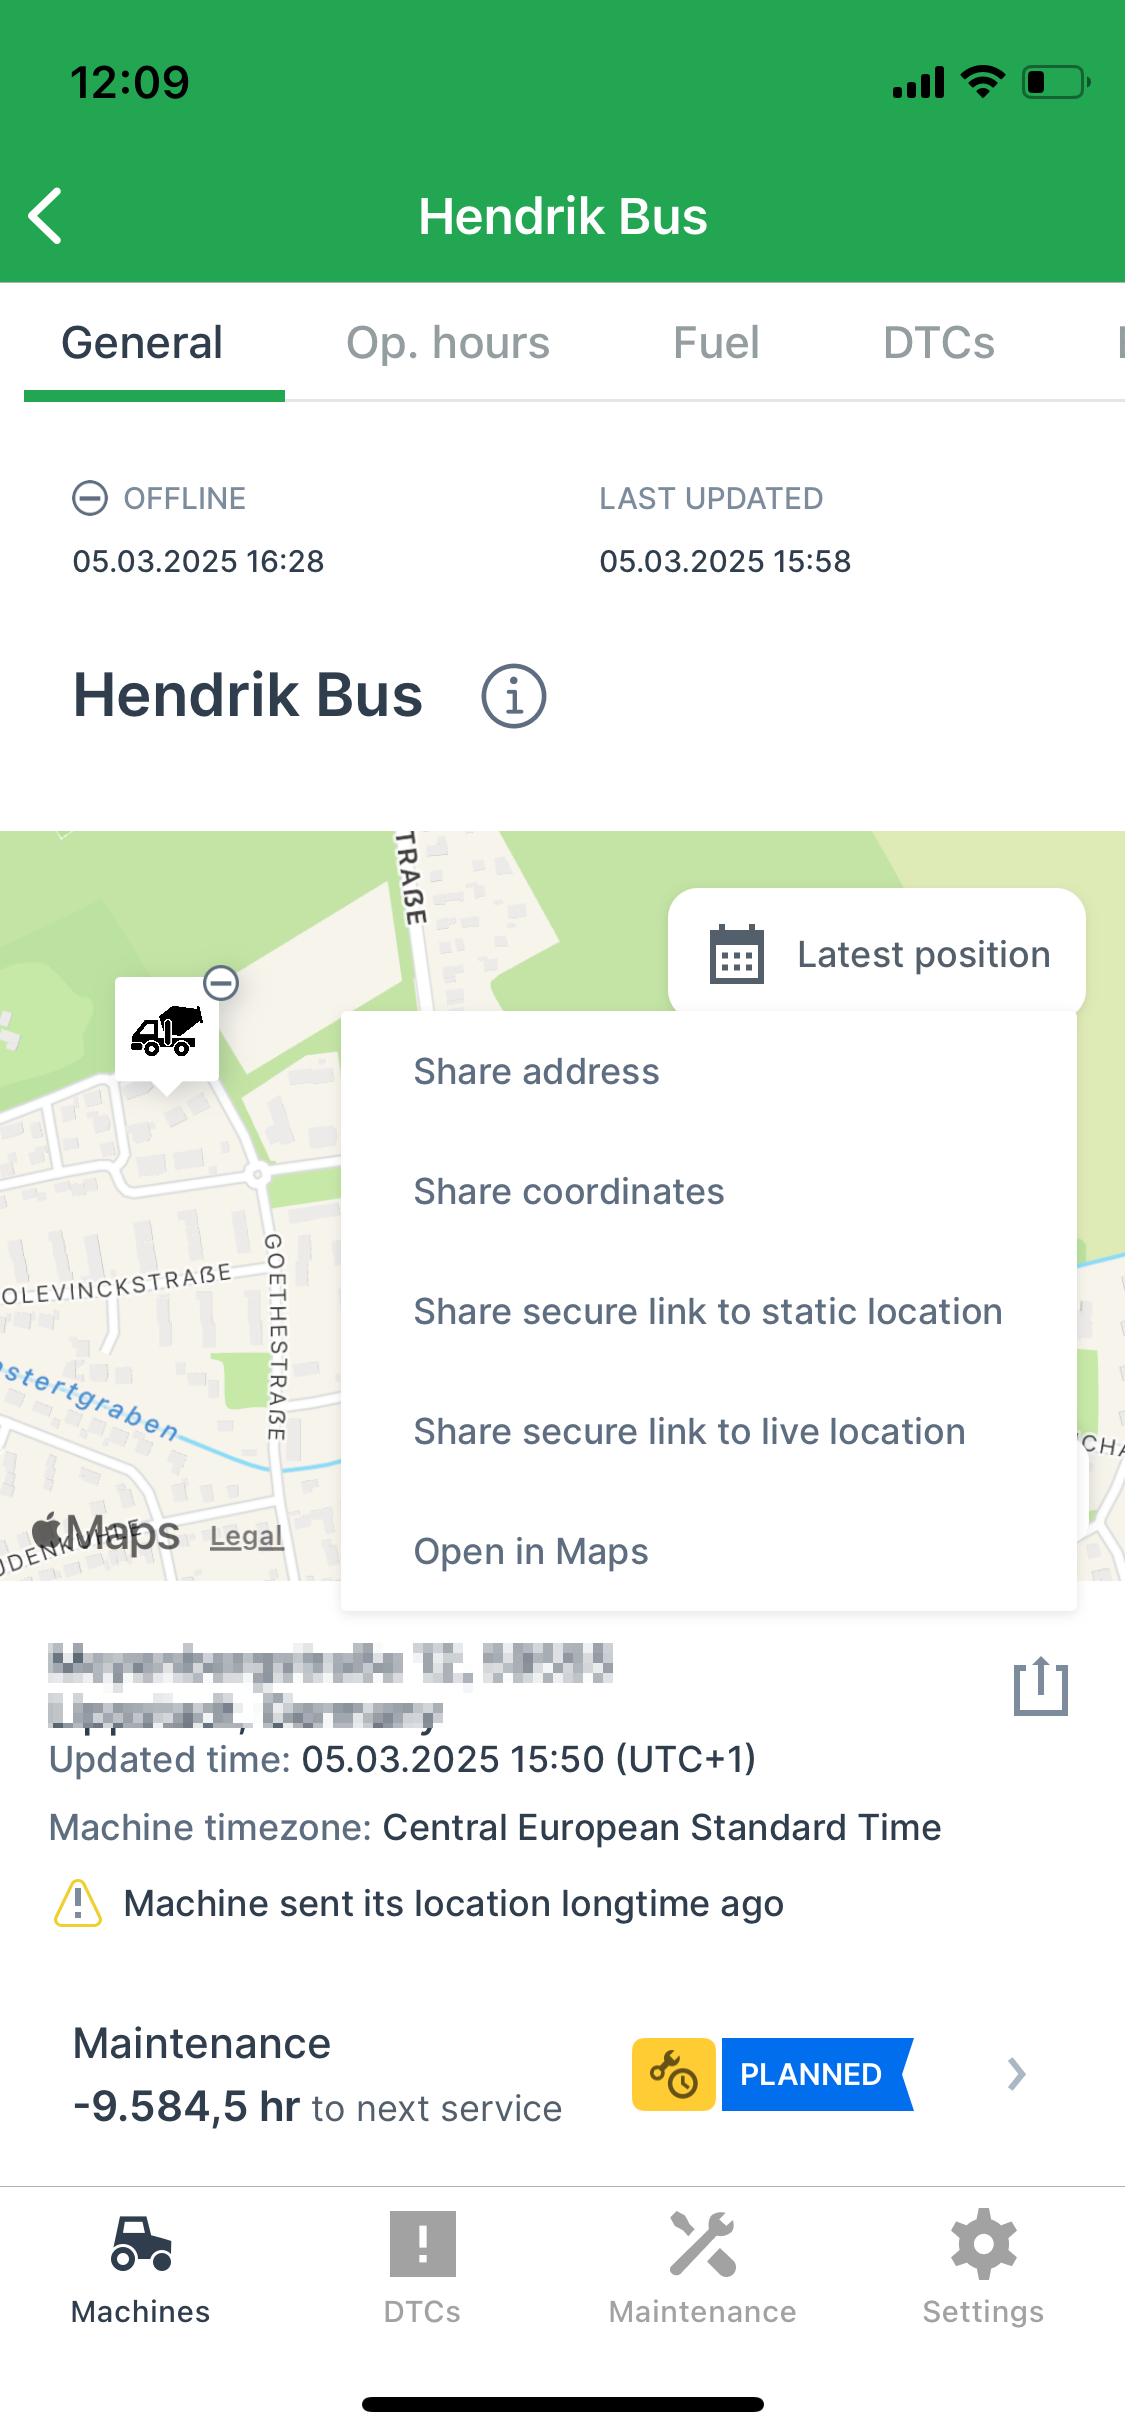
-
Copy & Share location
-
Share address.
Copies the machine address at the time the link was created, i.e. street name and number, zip code and city. -
Share coordinates.
Copies the latitude and longitudes coordinates of the machine at the time the link was created. -
Share current location and Share live location:
-
Create a link to a web page/view on the static machine location at the time the link was created, or
-
Create a link to the live machine location.
The machine’s live location is updated every 5 minutes by default as long as the link is valid, but stops the refresh if the machine is idling for 1 hour. -
The links are accessible by users without DataPortal account and is valid for 48 hours.
The number of shared links is displayed in the share dialog.A maximum of 5 links can be shared. -
To create a shareable link, click one of the options and confirm the dialog with Create and share link.
The link will be copied to the clipboard.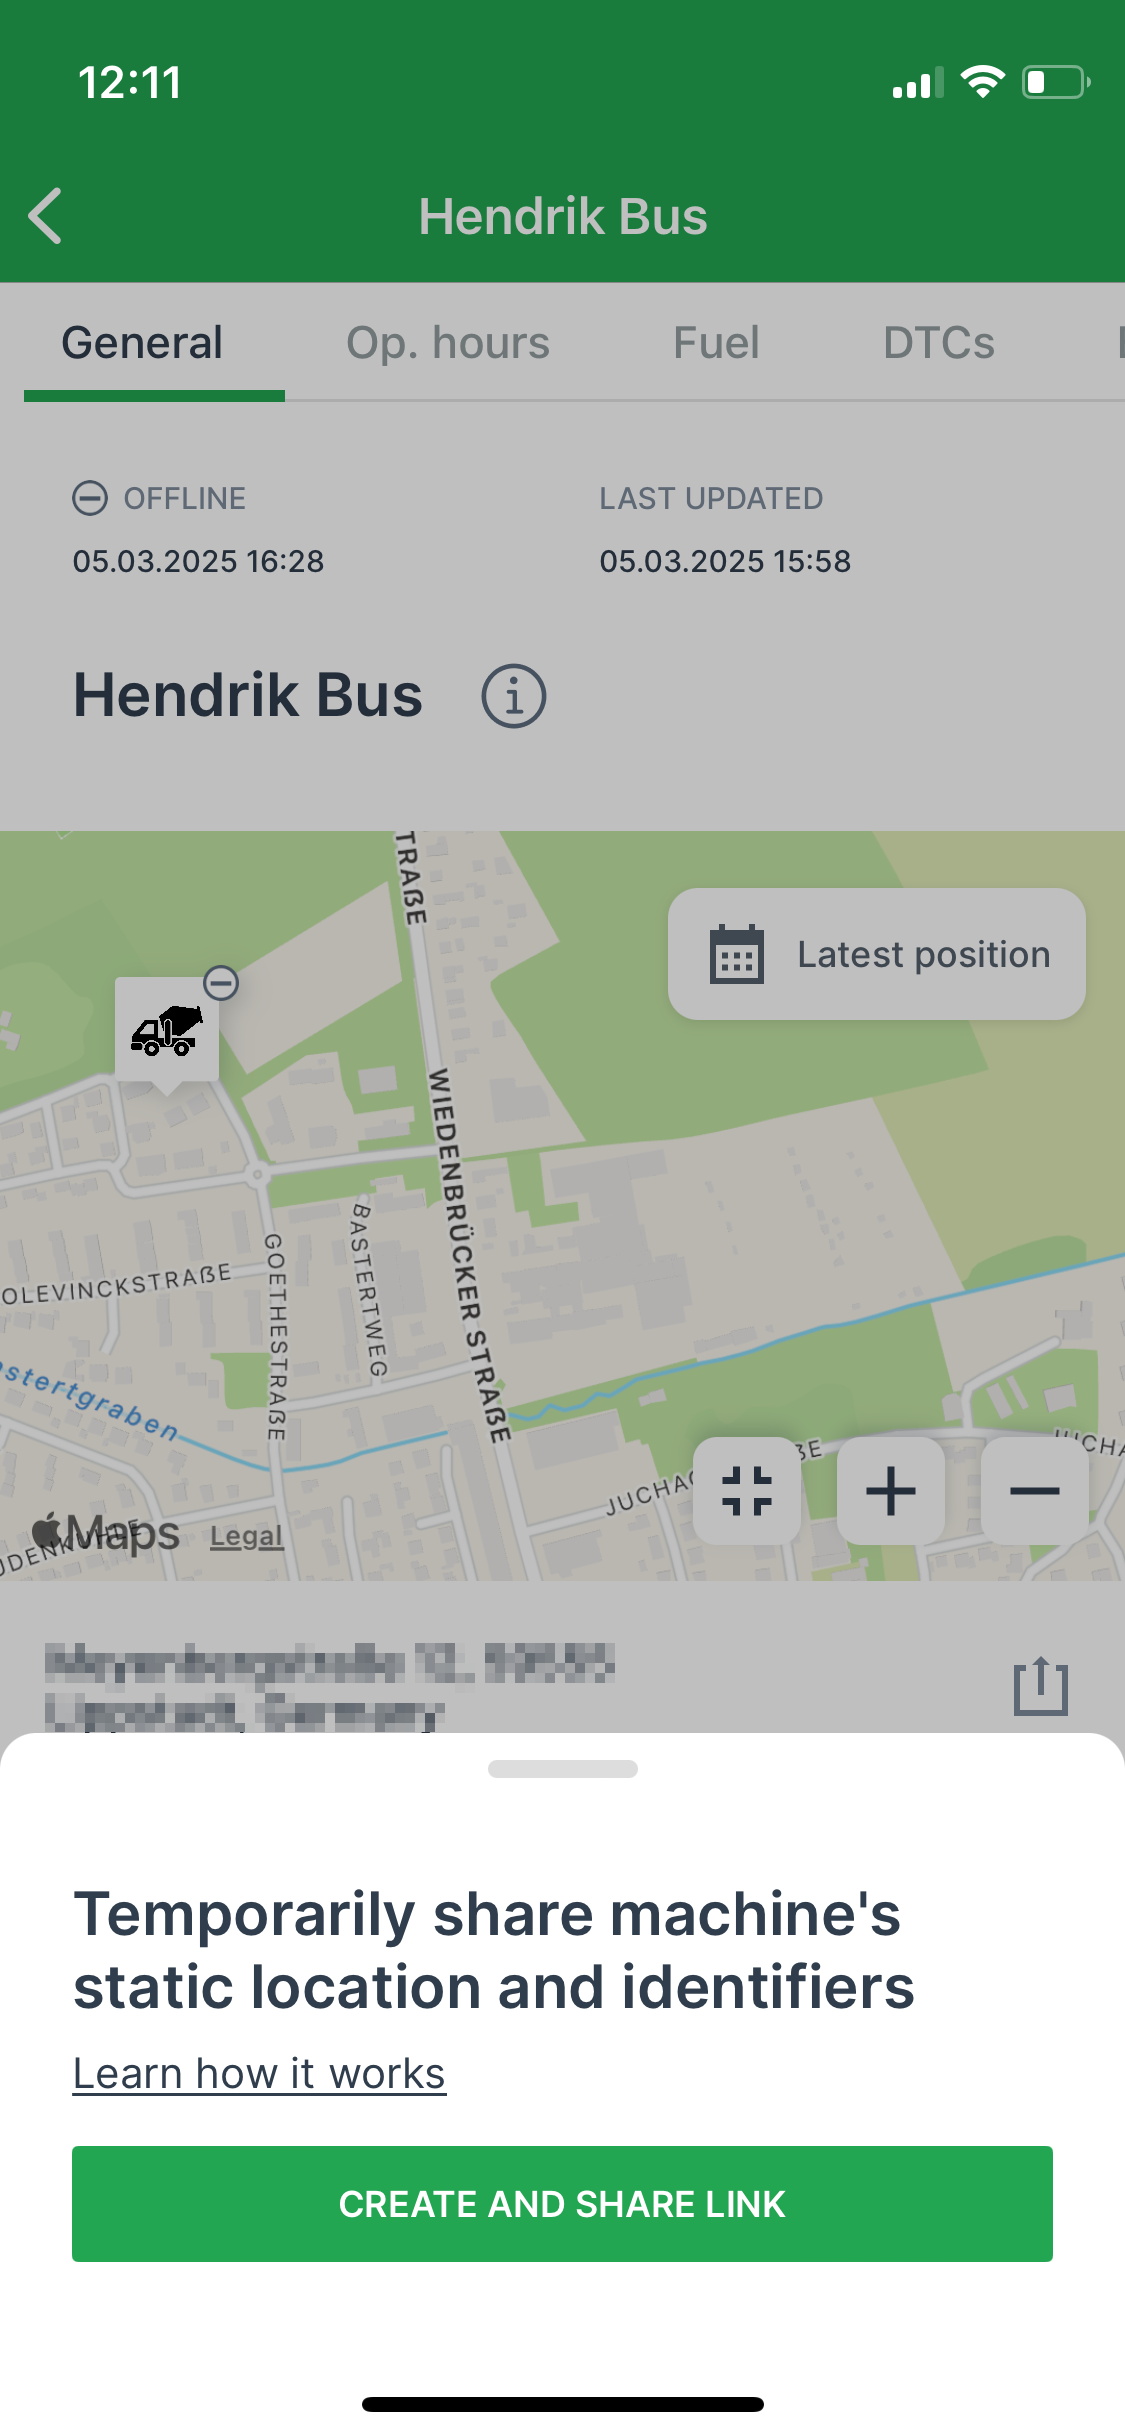 Figure 11. Share location dialog
 -
The shared page looks as follows:
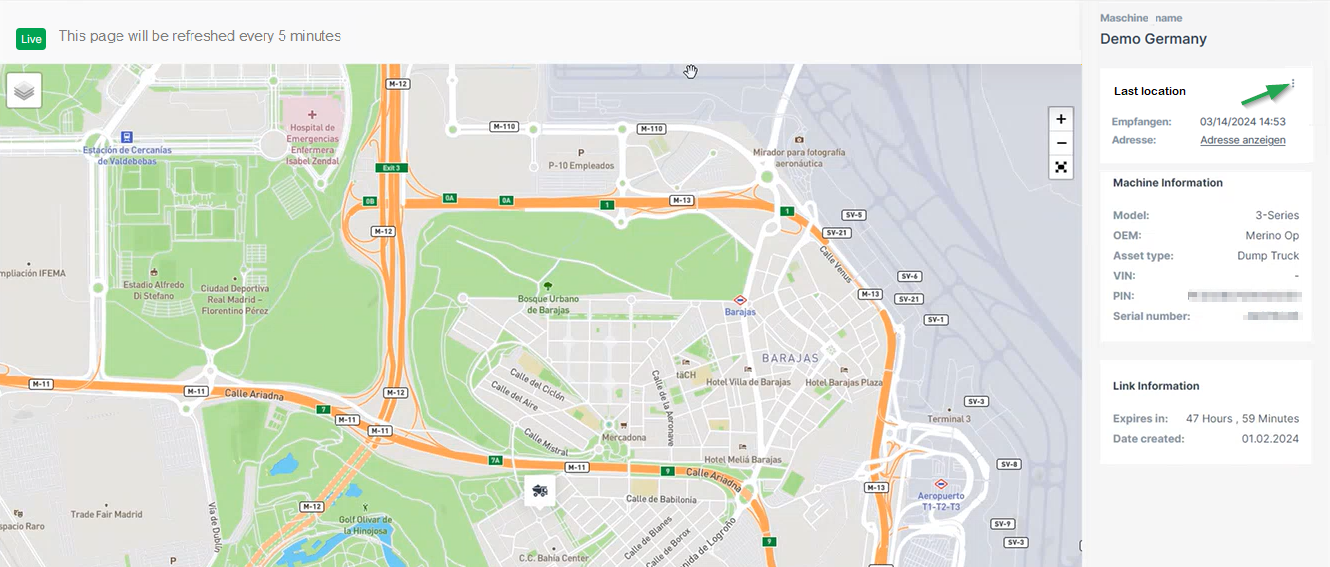 Figure 12. DataPortal location page
Note that the page is displayed in the language of the browser when not logged in, otherwise it displays in the selected DataPortal language. You can open the live location in Google Maps via the 3-dots. -
You may stop the sharing of the location via the share dialog again:
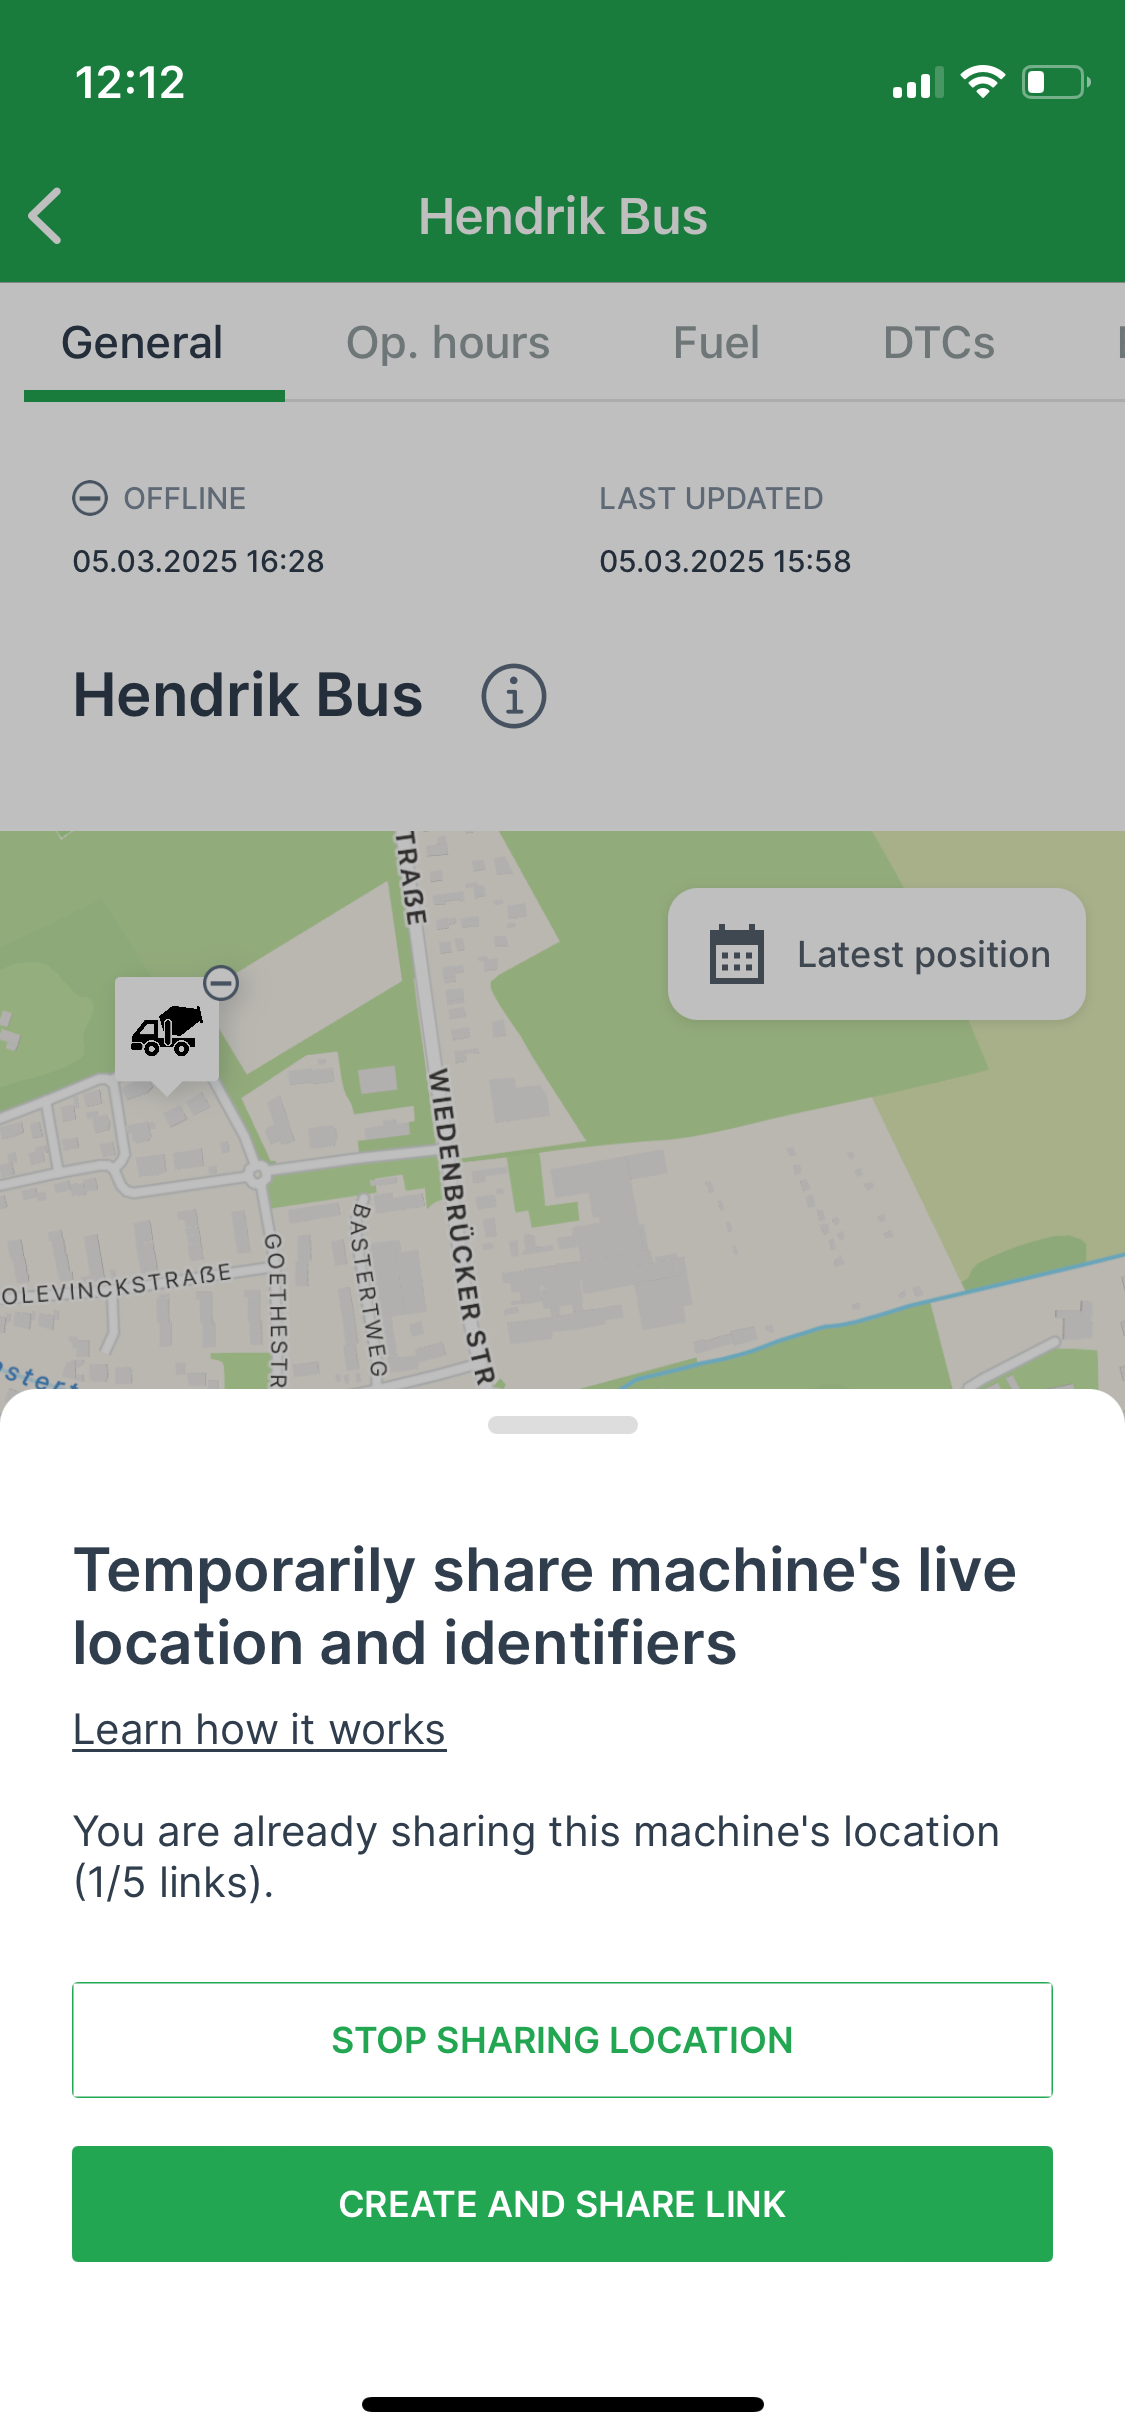 Figure 13. Stop Sharing location dialog
-
-
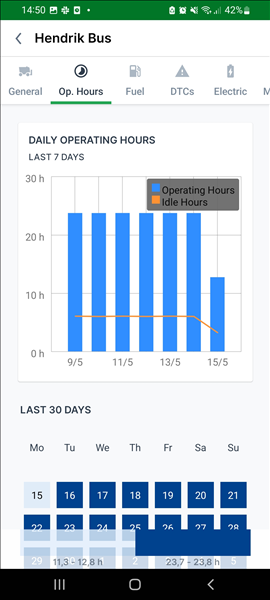
2.2.2. Operating Hours tab
The Operating Hours tab features a daily operating hours graph that presents both operating hours and idle hours for the past 7 days.
Additionally, it includes a heatmap showing the operating hours for the last 30 days in a calendar view, with each day color-coded based on its value.
Customization
The following customization options have been enhanced for OEMs (for the white-labeled variants) to customize both graph and heatmap visualization during initial setup:
Regarding the Operating Hours graph, here’s what can be controlled:
-
Choose preferred standard or custom signals (up to 3 signals with the same measurement units)
-
Tailor by aggregator and time range
Note that the graph is normally based on a time period of 7 days and the heatmap on 30 days. -
Select your color schemes
-
Choose between bar or line charts
-
Customize the bucket size
-
Set a fallback to use an alternative signal if the primary one is unavailable
Regarding the Operating Hours heatmap, here’s what can be controlled:
-
Choose the operating hours signal for the heatmap to be based on, for example "engine hours total" or "machine hours total".
-
Select the duration, e.g. 7 days or 30 days.
-
Set a fallback to use an alternative signal if the primary one is unavailable
2.2.3. Fuel tab
The Fuel tab shows the current fuel level, efficiency and consumptions.
| The Fuel tab is enabled if the machine has the corresponding signal configured. |
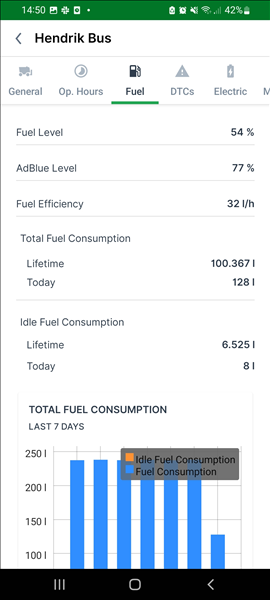
There are icons used to display the thresholds for each machine.
The icons are also displayed in the Machines List, next to each machine.
See the Machines List for a description of the icons.
Customization
The following customization options have been enhanced for OEMs (for the white-labeled variants) to customize both list and graph visualization during initial setup for the iOS platform:
Here’s what can be controlled:
-
Choose preferred standard or custom signals (up to 3 signals with the same measurement units)
-
Tailor by aggregator and time range
Note that the graph is normally based on a time period of 7 days and the heatmap on 30 days. -
Select your color schemes
-
Choose between bar or line charts for the graph
-
Customize the bucket size
-
Set a fallback to use an alternative signal if the primary one is unavailable
2.2.4. DTCs tab
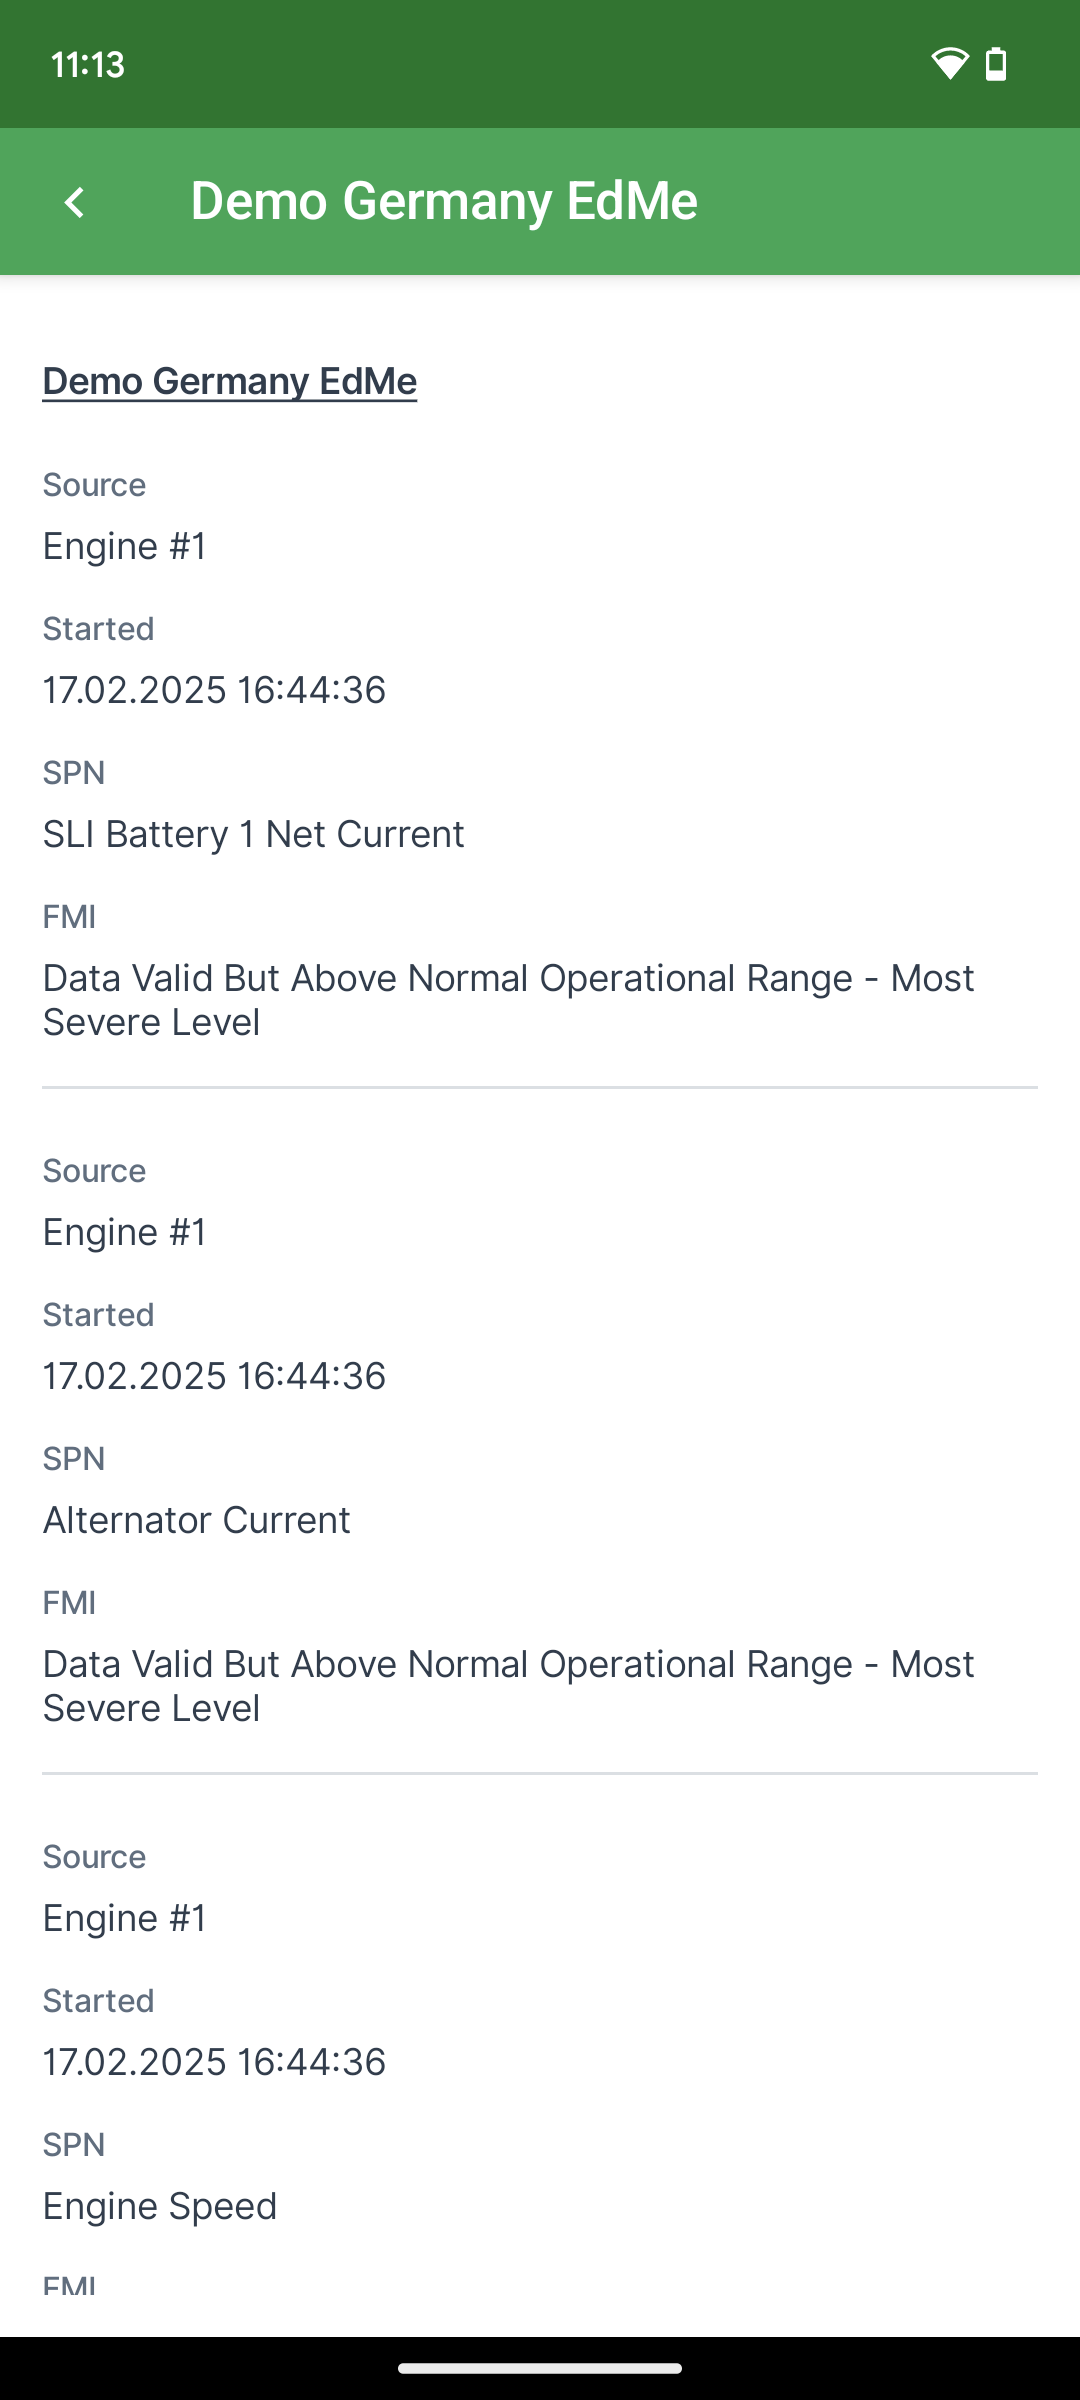
The DTCs tab shows the active DTC reported by the machine.
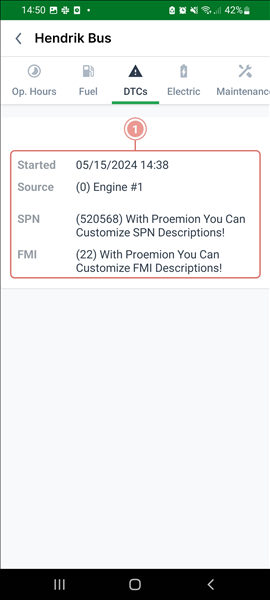
The DTC details show the following information:
-
Source: hardware on the machine containing the error, e.g. "Engine #1"
-
Suspect Parameter Number (SPN): containing the description of the error, e.g. "oil level".
-
Failure Mode Identifier (FMI): stating the kind of error, e.g. "exceeding or falling below value ranges", "short-circuits at the sensor", "incorrect update rate" or calibration errors".
There are icons used to display the active DTCs for each machine.
The icons are also displayed in the Machines List, next to each machine.
See the Machines List for a description of the icons.
Note that there is also the DTCs screen showing the DTCs of all machines.
2.2.5. Electric tab
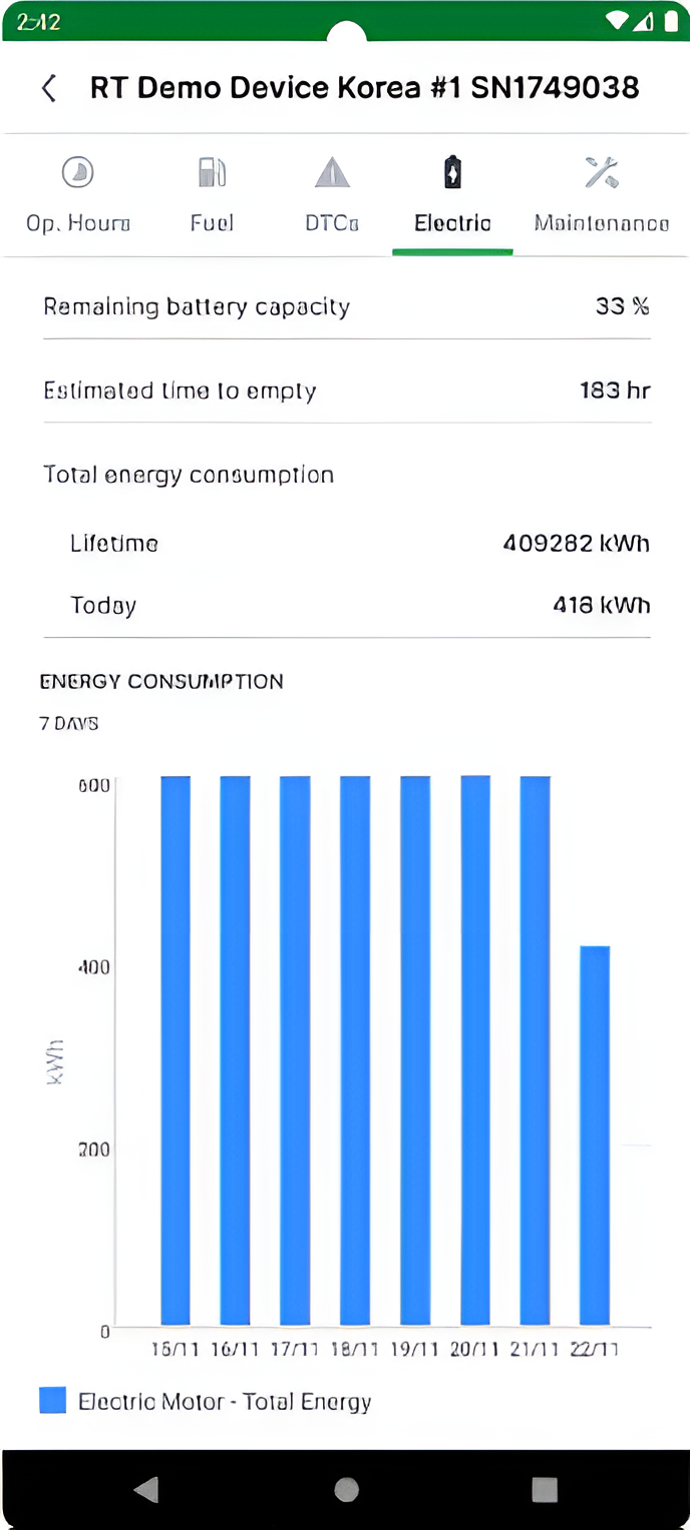
The Electric tab shows the battery and energy consumption.
| The Electric tab is enabled if the machine has the corresponding signal configured. |
Customization
The following customization options have been enhanced for OEMs (for the white-labeled variants) to customize both list and graph visualization during initial setup:
Here’s what can be controlled:
-
Choose preferred standard or custom signals (up to 3 signals with the same measurement units)
-
Tailor by aggregator and time range
-
Select your color schemes
-
Choose between bar or line charts
-
Customize the bucket size
-
Set a fallback to use an alternative signal if the primary one is unavailable
2.2.6. Maintenance tab
The Maintenance tab shows all the maintenance tasks of the selected machine.
| The Maintenance tab is enabled only if the OEM has opted for Maintenance feature. |
You can click each maintenance task to view its details.
There are icons used to display the active maintenance tasks for each machine.
The icons are also displayed in the Machines List, next to each machine.
See the Machines List for a description of the icons.
Note that there is also the Maintenance screen showing maintenance (tasks) of all machines.
2.3. DTCs
The DTCs screen shows all active DTCs of all machines, sorted by machine names.
Furthermore, the model name and the count of the DTCs are displayed.
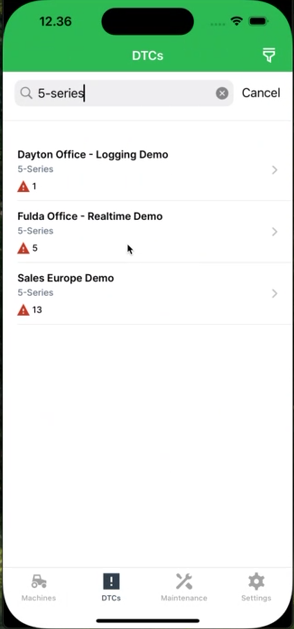
To filter the list of all DTCs, you can search a specific model or machine name.
You can also select the filter icon in top-right corner.
This leads you to the filters:
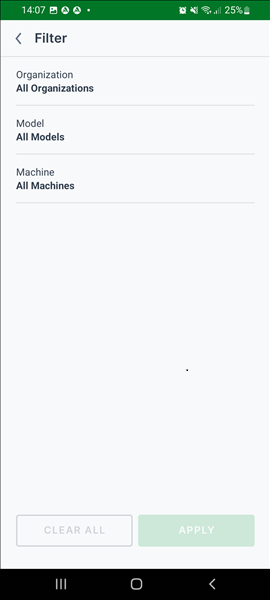
-
Organization
-
Model
-
Machine
2.3.1. DTC Details
Selecting a DTC opens the details:
If there is more than one DTC, it will have them all listed here for the specific machine.
For a description of the details shown for each DTC, read DTCs tab.
At the top of the DTC details you find a link forwarding you to the Machine Details page.
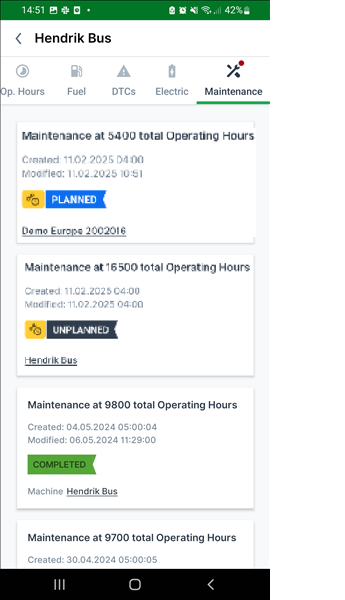
2.4. Maintenance
The Proemion Maintenance feature allows to monitor machine-specific maintenance tasks for each of your machines, along with details of additional maintenance services performed.
| If the OEM relies on "Hours to next service" for maintenance, the Machine Companion App will display only the maintenance status indicators on the machine details page. |
2.4.1. Overview
In the Maintenance screen you can view all maintenance items of all machines with their different status.
|
(1) Indicators Shows both the different progress status (planned, unplanned, completed, skipped) and deadline status (upcoming - yellow icon - or overdue - red icon) of a maintenance task. |
(2) Filters To filter the list of all Maintenance Tasks, select the filters icon in the top-right corner. |
|
(3) Sort Allows you to sort tasks according to the Newest, Oldest or Last Modified. |
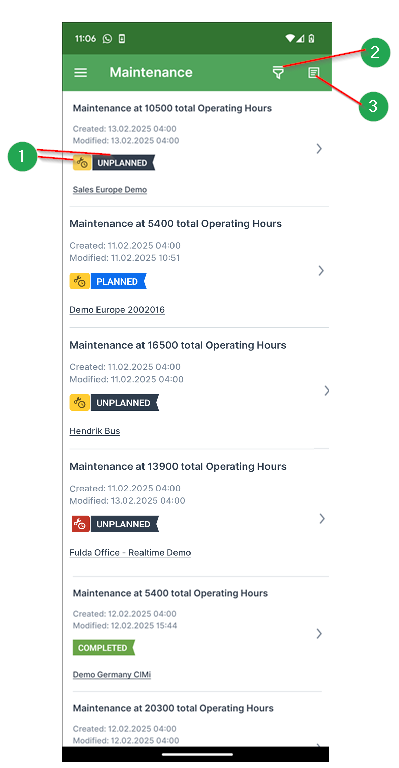
2.4.2. Filters
Select the desired filter checkboxes and click Apply.
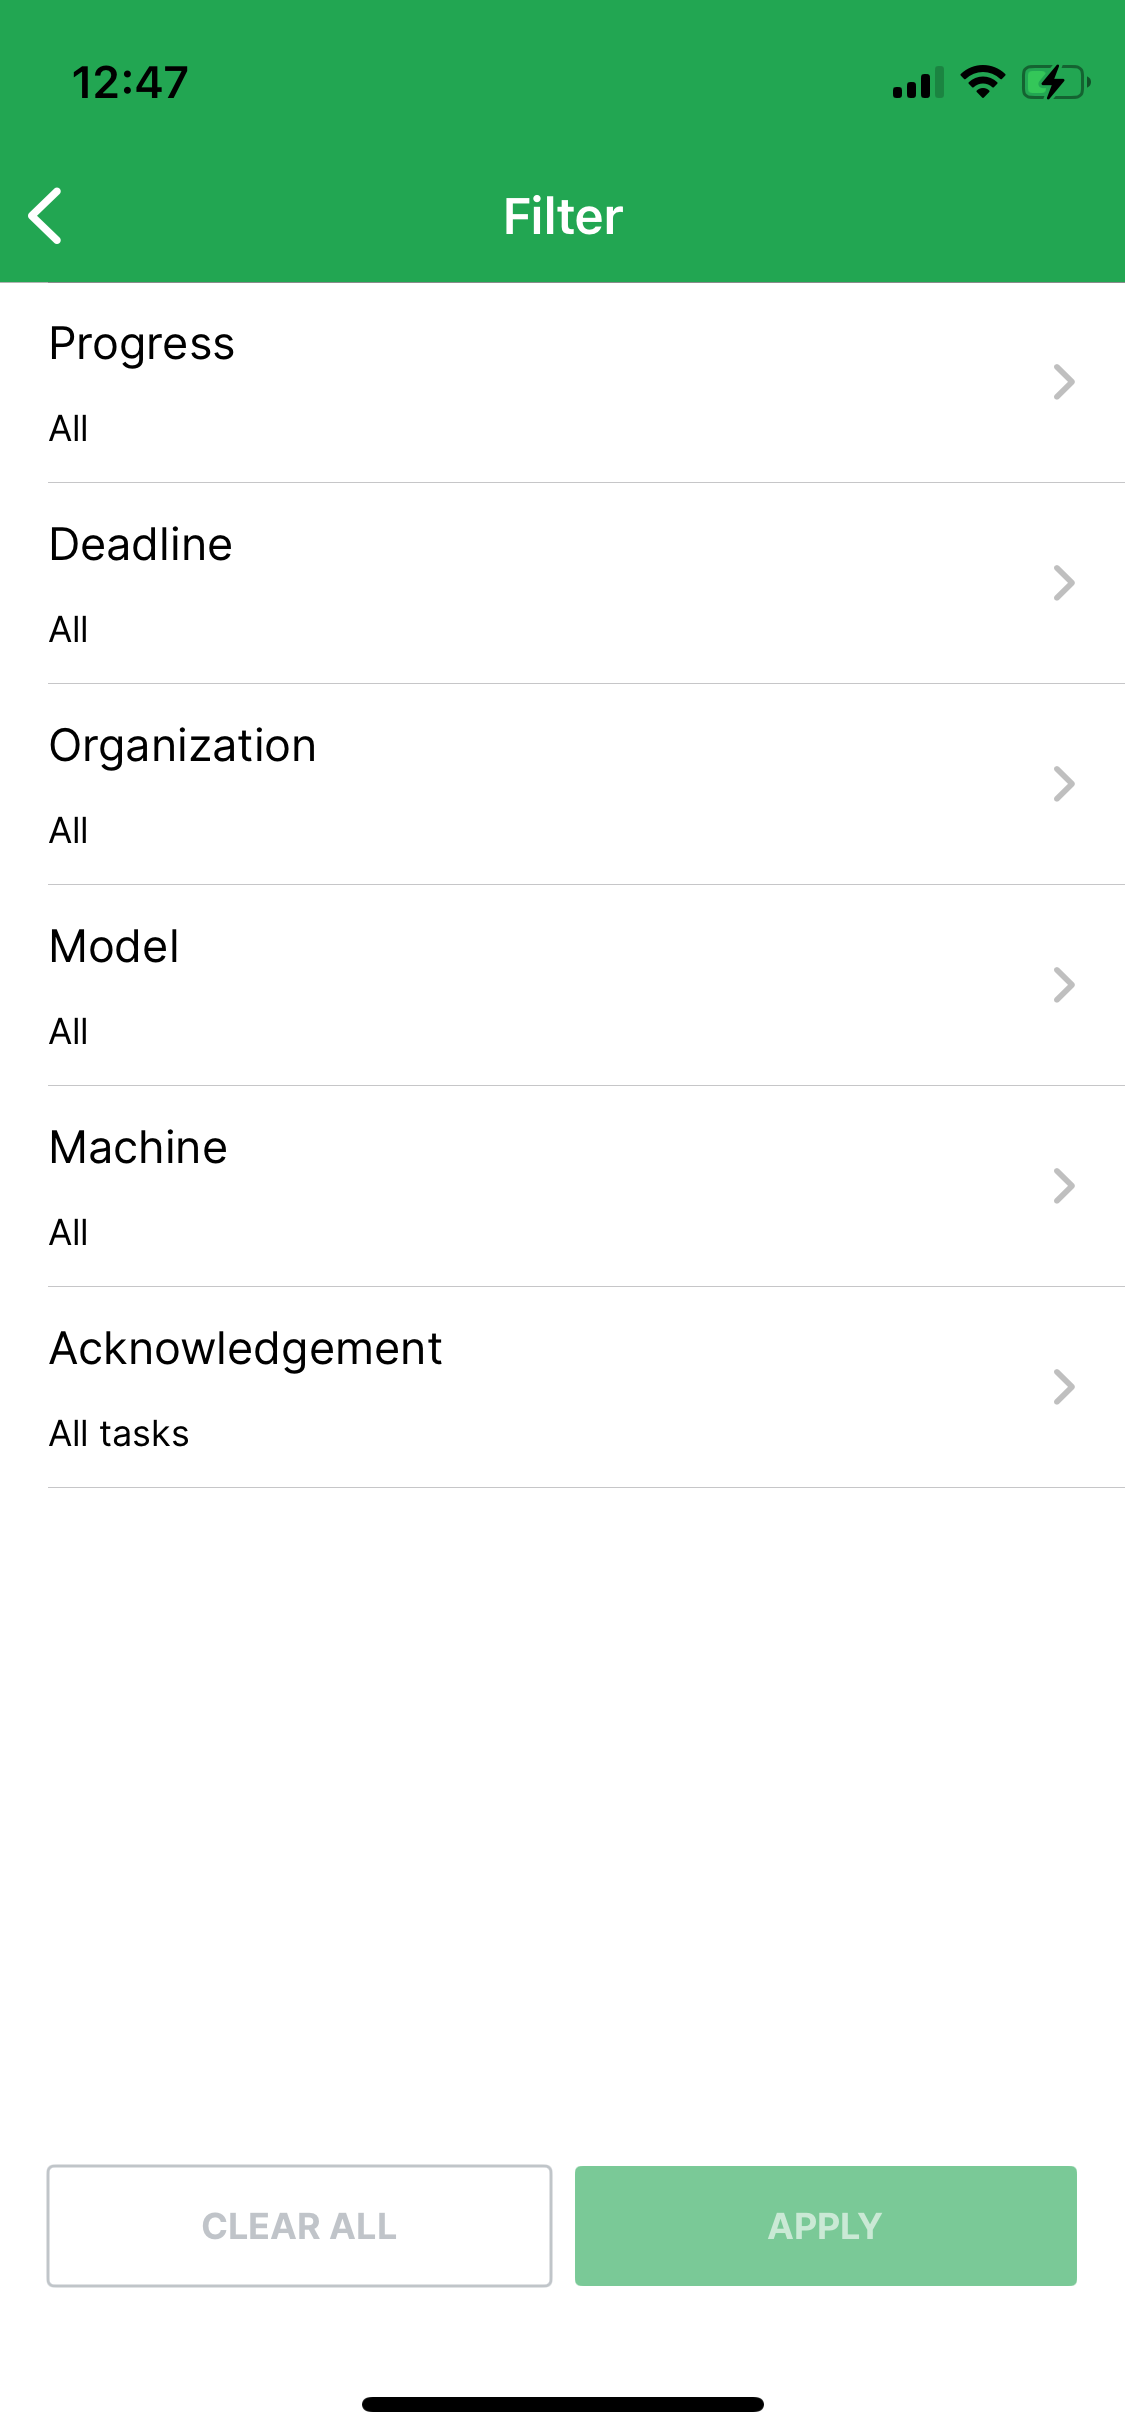
The maintenance tasks can be filtered by their statuses:
-
Progress
-
Unplanned
-
Planned
-
Skipped
-
Completed
-
-
Deadline
-
Upcoming
-
Overdue
-
Other filters:
-
Organization
-
Model
-
Machine
-
Acknowledgement
2.4.3. Maintenance Tasks Details
In the Machine Companion App, you can use the Maintenance screen to monitor machine-specific maintenance tasks at a glance with Proemion’s maintenance feature along with details of additional maintenance services performed.
Select a maintenance task, to use the following features:
-
View checklists for the maintenance services executed on a machine.
Checklists enable service technicians to document actions such as exchanging fuel filters, replenishing engine oil, etc. -
Add an optional completion note to share additional information or notes on the maintenance task, during or after the service appointment.
-
Use the Acknowledge Maintenance Tasks to receive the signature, during or after the service appointment.
2.4.4. Update Maintenance Task
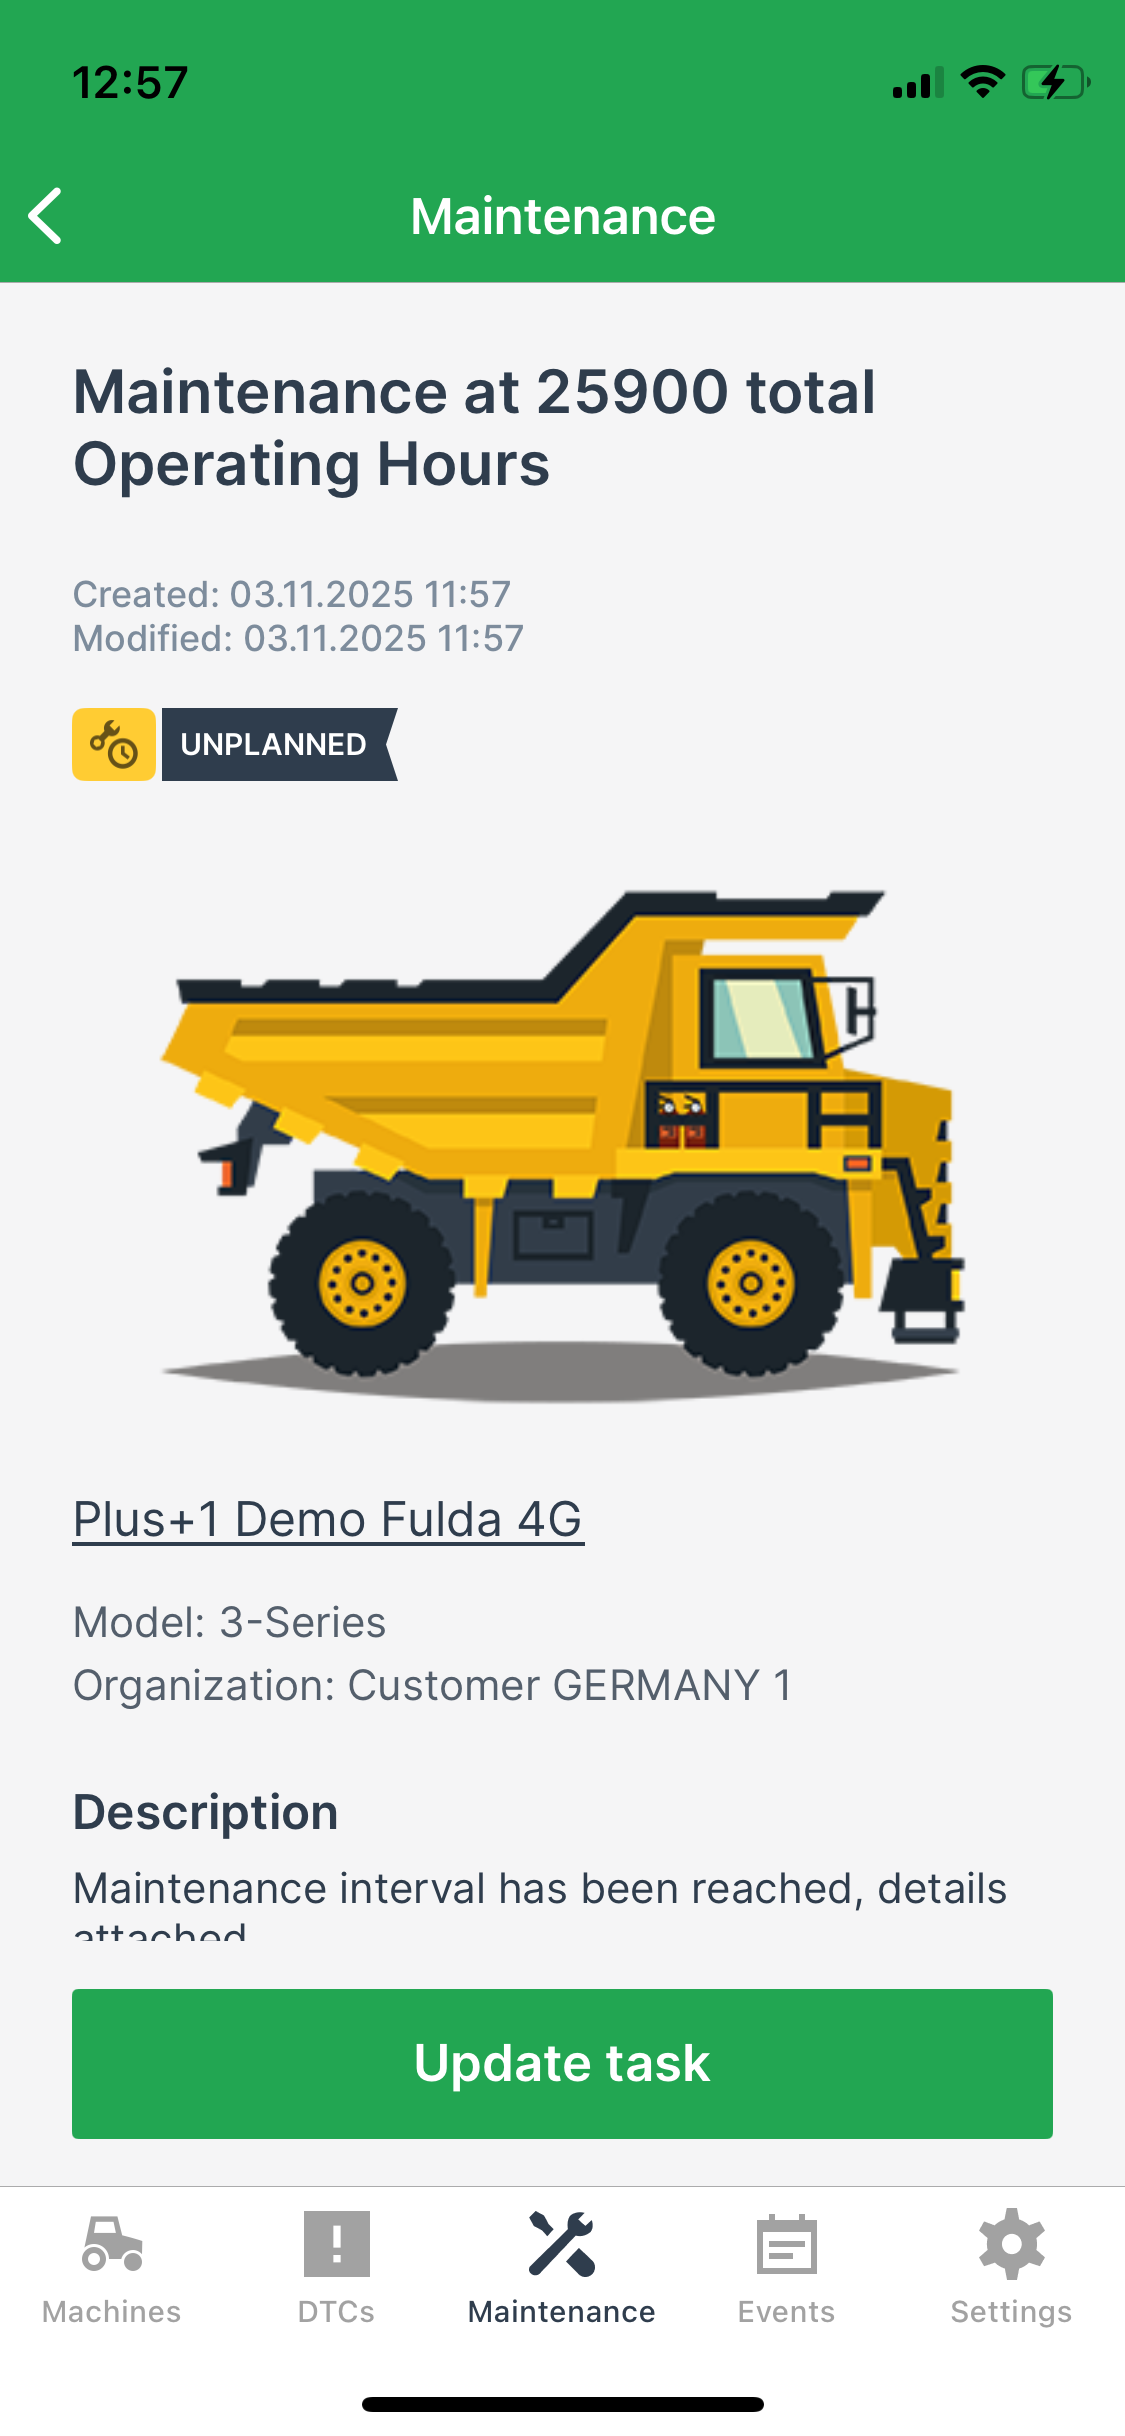
The Update task button, displayed at the bottom of the maintenance task details, can be used to move the task to a "planned" status or reset to the "unplanned" status or to complete the task.
You cannot update skipped maintenance tasks.
To update the maintenance task, proceed as follows:
-
At the bottom of the maintenance task details, click the Update task button.
-
A dialog will be displayed to update the task:
 Figure 24. Update task
 -
Mark as planned.
-
Or Mark all as completed and complete the task and its open activities or Continue anyway to close the task without marking the pending activity(es) as completed.
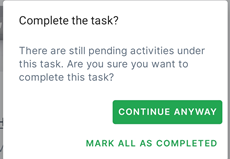 Figure 25. Complete task
This will change the State Indicator of the maintenance task to COMPLETED and iterate/reset the Service Cycle:
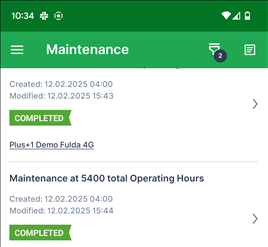 Figure 26. Completed task in overview
In the Overview, the labels will be updated, too.
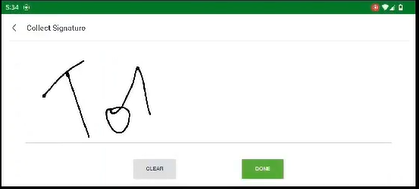
2.4.5. Acknowledge Maintenance Tasks
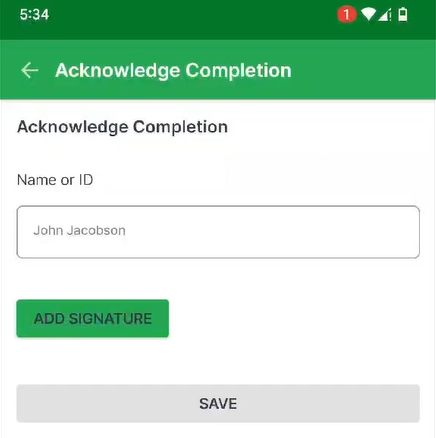
The acknowledgement process enables the service technician of a dealer organization to request acknowledgement from machine owners business once the service has been delivered by validating the identity and collecting the signature.
The acknowledged task will be synced with the DataPortal.
There you can also view the details of the acknowledgment, see Acknowledge Maintenance Tasks in the DataPortal Manual.
To add the signature after task completion, in the Maintenance screen, select Acknowledge Completion and add the signature in the provided field:
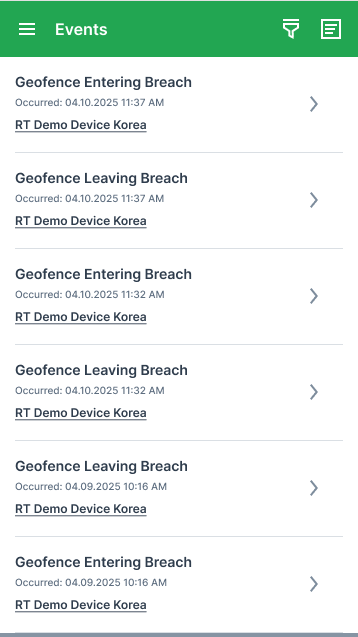
2.5. Events
The Events tab provides visibility into Geofence events, allowing users to track when machines enter or exit predefined geographic areas.
This gives insights into location-based activity and supports decision-making based on machine movements.
2.5.1. Events Listing
The Events screen displays a list of all Geofence events, including both entry and exit breaches. Each event entry in the list shows the following details:
-
Event title (e.g., "Geofence Entering Breach" / "Geofence Leaving Breach")
-
Timestamp of the breach
-
Machine name (clicking the machine name navigates to the Machine Details page)
Users can filter the list by:
-
Machine
-
Organization
-
Time
Sorting options are available to order events by:
-
Newest
-
Oldest
2.5.2. Time-based Filtering
The Events tab supports time-based filtering, allowing users to filter events based on predefined or custom time periods.
Default Behavior
-
The default time filter is set to Current Year (year-to-date).
-
When opening the Events tab, the Time filter is preselected and visible in the filter screen.
-
Edge case: On January 1, the filter remains set to Current Year, even if few or no events are available.
Accessing the Time Filter
The Time filter is available under Events.
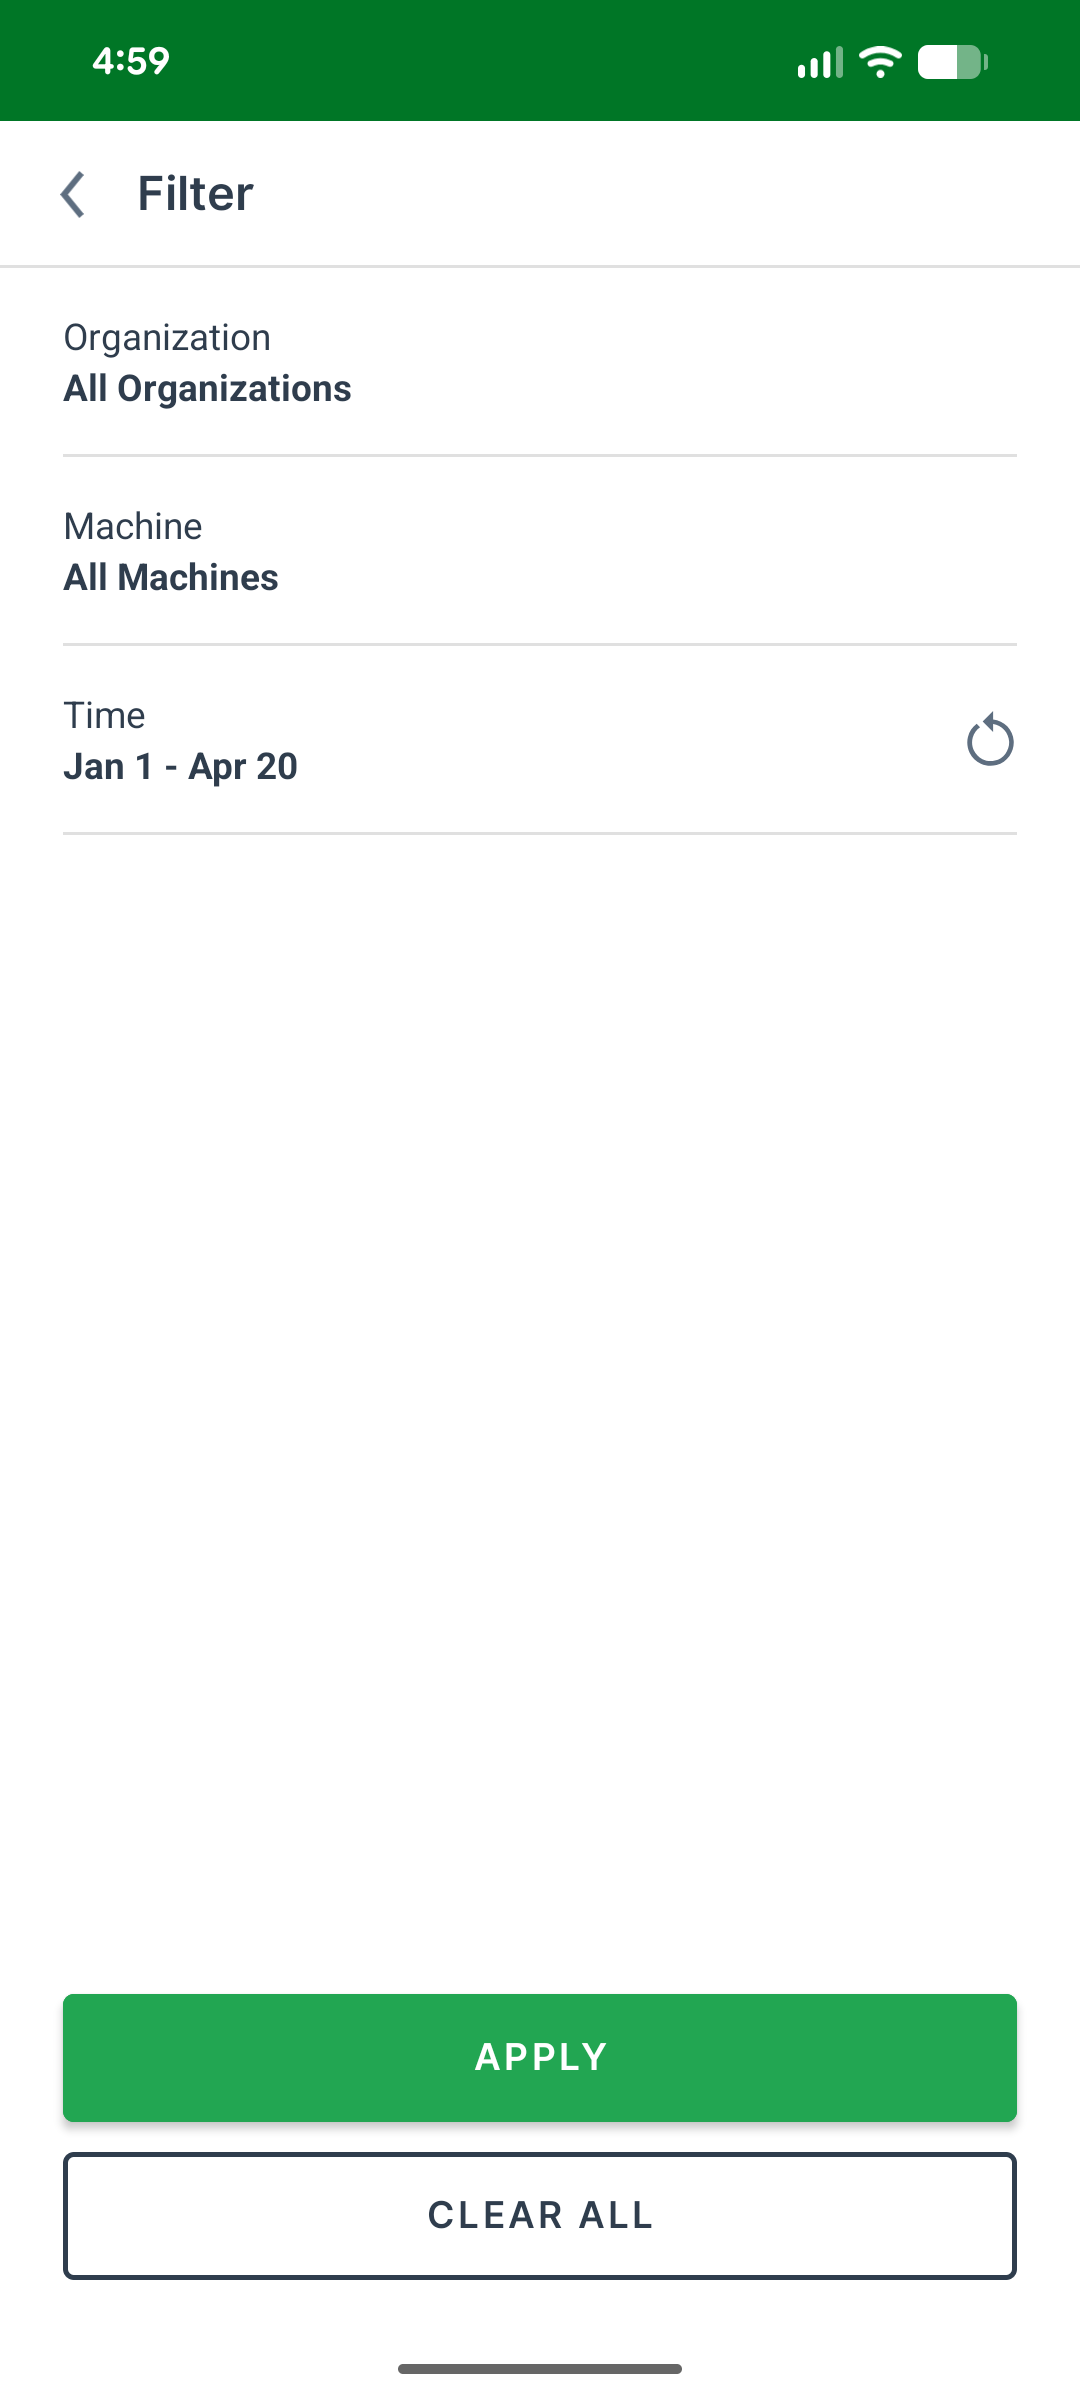
-
Select Time to open the dedicated Time Filter screen.
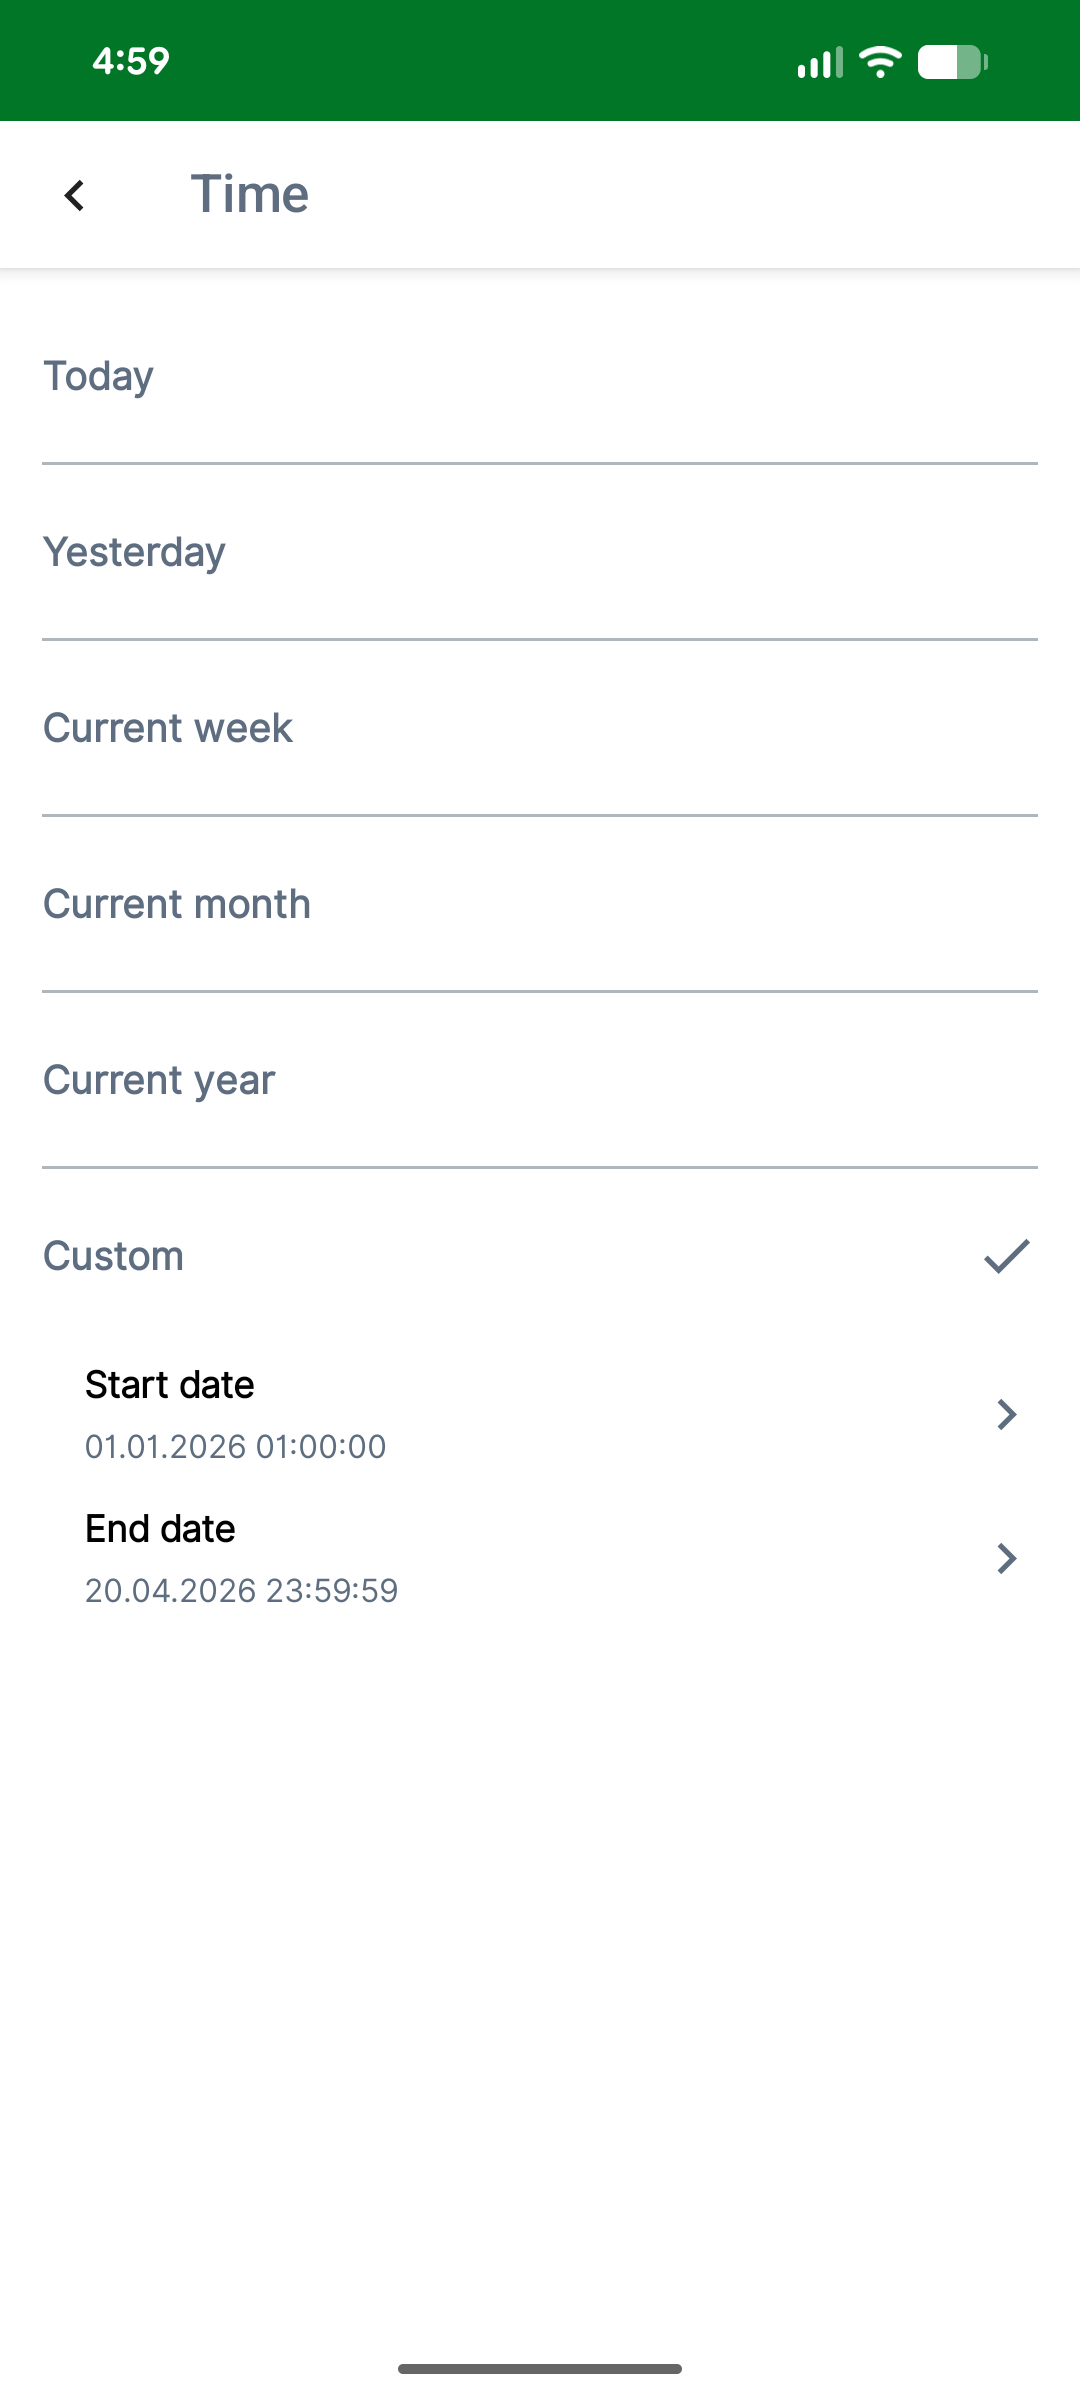
Available Options
The following predefined time ranges are available:
-
Today
-
Yesterday
-
Current Week
-
Current Month
-
Current Year (default)
-
Custom
-
The selected option is highlighted.
-
The selection persists when navigating back to the screen.
Custom Time Range
Selecting Custom enables a date range selection.
-
A date picker is displayed on the same screen.
-
Users can select:
-
Start date
-
End date
-
Select Done to confirm the selection and return to the main filter screen.
-
Previously selected dates remain visible when reopening the filter.
Returning to Filter Screen
After confirming the selection:
-
The selected time filter is displayed in the Time field.
-
Predefined values are shown as labels (e.g., Current Week).
-
Custom ranges are displayed as formatted dates (e.g., Nov 1 – Nov 10).
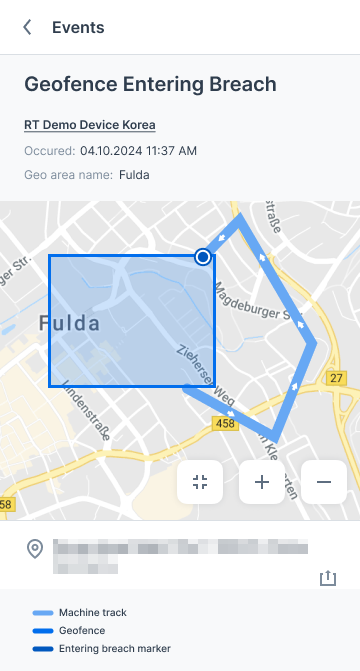
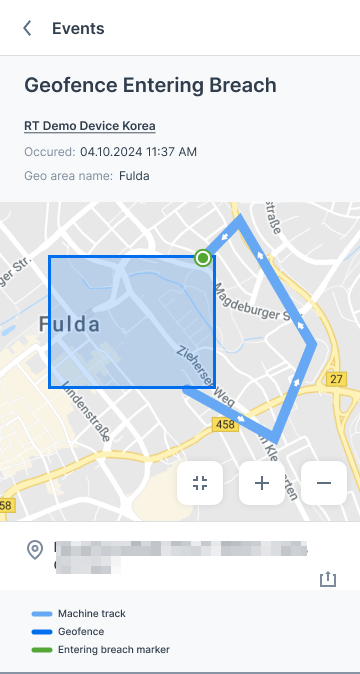
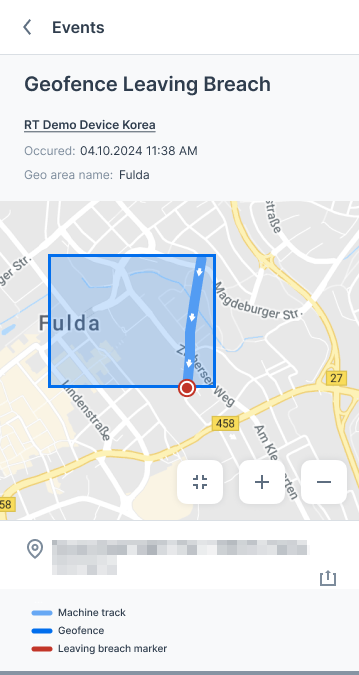
2.5.3. Events Details
Selecting an event opens a detailed view with the following information:
-
Event title (e.g., "Geofence Entering Breach" / "Geofence Leaving Breach")
-
Timestamp of the breach
-
Machine name
-
Geofence area name
-
Location and address
-
Map displaying:
-
Geofence area
-
Machine track for ±15 minutes from the event time
-
Direction of the track
-
-
Breach marker:
-
Red for Leaving breach
-
Green for Entering breach
-
-
Zoom in/out and reset controls
-
Legend
2.5.4. Location Sharing
Users can also share the location of a Geofence event:
-
Share address
-
Share coordinates
This feature enables easy communication of location information with relevant stakeholders.
See also Share Live and Static Location.
3. Settings
The Settings screen provides the following menus:
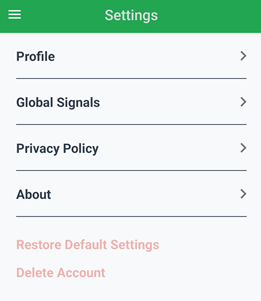
3.1. Profile
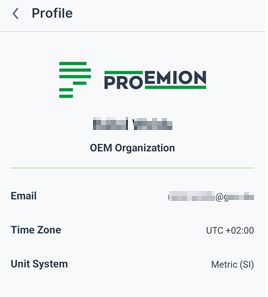
The Profile menu shows the following information:
-
App/Company logo
-
Complete name of user
-
Organization of user
-
E-Mail address of user
-
Timezone of user
-
Unit system of user
3.2. Global Signals
The Global Signals lists all signals used.
The order can be changed here by the users themselves.
Read how signals are used in the Machine Companion App in the chapter Signals List.
3.3. Language Support
The application supports multiple languages.
Currently, the supported languages include:
-
English
-
German
-
Italian
-
French
This multilingual support allows interacting with the app in the preferred language.
3.4. Privacy Policy
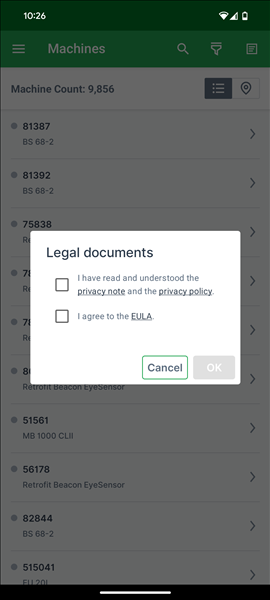
Upon launching the app or logging in, users will be presented with a privacy policy popup if they have not accepted the latest version of either:
-
the Mobile Privacy Note, or
-
the Platform Privacy Policy.
to continue using the app, users must consent to both policies.
If the user taps "Close" to decline, they will be logged out of the app.
The Mobile Privacy Note also remains accessible at any time via the Settings menu.
The app displays the privacy policy documents according to the preferred language (based on your phone settings) and captures the consent.
Supported languages are: English (is also the fallback), German, French and Italian.
4. FAQ
4.1. Does the list of Signals in the Machine Companion App only display standard signals?
The Machine Companion App ensures that the required signals are always highlighted.
The standard app is configured for below standard signals.
All white-labeled variants support both standard and custom signals, which can be configured during the initial app setup.
For more information, see Signals List.
4.1.1. Standard signals
The following signals are the Proemion standard signals that can be displayed in the Machine Companion App:
| Signal Label | Customer Metric Key |
|---|---|
Total Operating Hours |
value.common.machine.hours.operation.total |
Idle Operation Hours |
value.common.machine.hours.idle.total |
Time To Next Service |
value.common.machine.service.hourstonextservice |
Total Distance Traveled |
value.common.machine.distance.total |
Fuel Level |
value.common.engine.fuel.level |
AdBlue Level |
value.common.engine.def.level |
Fuel Efficiency |
value.common.engine.fuel.efficiency.current |
Total Fuel Consumption |
value.common.engine.fuel.used.total |
Idle Fuel Consumption |
value.common.engine.fuel.idle.total |
Energy Consumption |
value.common.engine.energy.total |
Remaining Battery Capacity |
value.custom.machine.battery.stateofcharge |
Remaining Battery Time To Empty |
value.custom.machine.battery.timetoempty |
Machine State |
value.common.machine.state.numeric |
StarterBatteryVoltage |
value.common.machine.battery.voltage |
TelematicsControlUnitBatteryVoltage |
value.common.cu.battery.voltage |
4.2. Are custom metrics supported for the Operating Hours, Fuel, and Electric tabs on the machine details page?
Yes, the data displayed in the Operating Hours tab, Fuel tab, and Electric tab on the machine details page can support custom metrics in white-labelled variants.
4.3. Can the graphs be customized in the white-labelled variant?
Proemion recently enhanced the operating hours graph for white-labelled variants, see Operating Hours tab.
OEMs can now tailor the visualization according to their preferred signal (up to 3), aggregator, time range, color schemes, visualization types (bar or line) and bucket size during the initial app setup.
Proemion plans to extend this customization options to other graphs
5. Service and Support
The latest versions of the drivers, software, firmware, and documentation are available in our Document Library.
Do you need help or want to report a bug?
Visit Proemion for more information, or raise a ticket at Support.
5.1. Firmware Updates and Support
|
Version: 11.0.988