Machine Tracking
Machine Tracking enables you to track the route and signal values of a machine for a specific time-frame
The machine route is represented as connected geo positions on a map. Signal values are displayed as graph data points that correspond to a geo marker on the map.
Machine Tracking is accessible via the marker icon ![]() in the Machine Master Data widget, which is usually to be found in the Machine Page.
in the Machine Master Data widget, which is usually to be found in the Machine Page.
Note
Location history access must be set by an organization admin and is necessary to use this feature.
Configuration
-
Click the marker icon
 in Machine Master Data to open the machine tracking page.
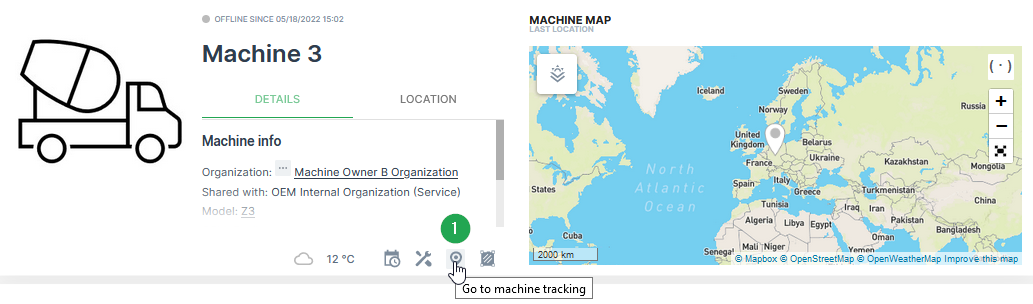
Figure 1: Open Tracking Configuration -
Adjust the settings for the time range, signal and visualisation according to your needs.
Note
The number of allowed waypoints may be limited on the map. A higher resolution view of the path is possible by limiting the displayed time range.
-
Click Apply to track the machine route on the map.
!!! note Additionally, it is possible to select a signal which can be visualised along the track. There are two options. The first option is the visualisation with a Gradient and the second option is to create a Chart in parallel.
!!! note The default color of the path tracking can be customized by selecting Settings > Portal Appearance > Theme > Map Style section.
Samples
Map with Gradient Signal Visualisation
| # | Item | Description |
|---|---|---|
| 1 | Time Range | Define the time range for the track. Please be aware that there is only a maximum time period of 7 days possible when a signal along the tracks needs to displayed. |
| 2 | Signal | Select the signal which needs to be visualized along the track. |
| 3 | Signal Visualisation | Gradient, see Map/Location Reporting |
| 4 | Gradient Options | See Map/Location Reporting |
| 5 | Print PDF | Option to export the track to a PDF. |
| 6 | Overlay | See Maps Overlay. |
| 7 | Zoom Options | With these buttons the size and the center of the map can be optimized. |
| 8 | Machine & Signal Name | The selected machine and signal is shown here. |
| 9 | Map Legend | This legend shows the grouped signal values and the assigned colours for the track. |
| 10 | Waypoint Popup Window | Shows position and signal value. |
Note
A mouse click on a waypoint on the map opens a popup window with the exact position, time stamp and the value for the selected signal.
Map with Chart Signal Visualisation
| # | Item | Description |
|---|---|---|
| 1 | Time Range | Define the time range for the track. Please be aware that there is only a maximum time period of 7 days possible when a signal along the tracks needs to displayed. |
| 2 | Signal | Select the signal which needs to be visualized along the track. |
| 3 | Signal Visualisation | Gradient, see Map/Location Reporting |
| 4 | Track options | See Map/Location Reporting |
| 5 | Print PDF | Option to export the track to a PDF |
| 6 | Overlay | See Maps Overlay |
| 7 | Zoom Options | With these buttons the size and the center of the map can be optimized. |
| 8 | Signal Chart | The chart for the selected signal and time range is shown here. |
Note
A mouse click on a waypoint on the map opens a popup window with the exact position and time stamp. Additionally, the corresponding value of the selected signal is marked at the chart.