Diagnostic Cases
Diagnostic Cases allow secure real-time diagnostics and remote connectivity to components in the machine’s local network during active operation.
A Diagnostic Case is triggered whenever a diagnostic session is started, either through:
- Realtime Mode (CANlink® mobile 3000 family): live CAN message streaming, or
- Remote Machine Tunnel (RMT) (CANlink® mobile 10000 family): secure remote access without CAN message transmission.
Diagnostic Session in Realtime Mode require tools such as the Proemion Remote Service Tool application, the Proemion SoftGateway or a custom application.
RMT sessions are initiated via the DataPortal; depending on the type of service accessed through the tunnel, additional local tools may be required to establish a secure connection.
For more information on Remote Machine Tunnel, see the RMT documentation.
Diagnostic Cases by Contract
The DataPortal manages the number of Diagnostic Cases based on machine's hosting contracts and Platform-wide limits. It enforces usage limits across both diagnostic mechanisms (Realtime Mode & RMT). Some contract types include a fixed number of Diagnostic Cases per month/year, while others completely restrict diagnostic functionality.
In general, there are two contract types:
- Device Contracts: Limit of Diagnostic Cases monthly per device.
- Platform Contracts: Limit of Diagnostic Cases annually per contract for the whole fleet pool.
Note
It is recommended to conclude a Platform Contract to ensure seamless access to real-time functionalities and optimized fleet management. The Platform Contract includes a defined annual limit of Diagnostic Cases applicable to the entire fleet. This enables efficient use of real-time diagnostics and monitoring across all connected machines.
Note
Please contact your Sales representative for more information about the contracting options.
Contract Enforcement
Once the Diagnostic Case limit is exceeded:
- Both Realtime Mode sessions AND RMT sessions are blocked.
- No new Diagnostic session can be started
- Regular data logging (.clf) remains unaffected, i.e. devices can still go online and connect with the DataPlatform and transmit machine logged data.
Diagnostic Case Counting and Display Logic
All diagnostic sessions initiated within the configured case window (default: 4 hours) are grouped into the same Diagnostic Case. Once the window expires, the next newly started session creates a new Diagnostic Case. A single Diagnostic Case can therefore include one or multiple diagnostic sessions.
Both mechanisms start Diagnostic Cases and are counted uniformly toward contract limits.
The number of available Diagnostic Cases — i.e., the remaining limit value — is updated once per day. However, the number of used Diagnostic Cases is updated immediately when a new case is started. Diagnostic sessions initiated by the Proemion Support team do not count against your contract quota. Only Diagnostic Cases of the last 24 months can be displayed.
Diagnostic Case Attribution and Traffic Rules
Diagnostic Cases are attributed to contract limits based on the following rules:
- Device Contract first: If a machine has a Device Contract with remaining Diagnostic Cases, each new Diagnostic Case is counted against this device-level monthly limit.
- Fallback to Platform Contract (FDP): If the device-level limit is exhausted or no Device Contract exists, Diagnostic Cases are counted against the annual fleet-wide limit of the Fleet Diagnostics Package (FDP).
Traffic attribution depends on the contract type:
- FDP-attributed cases: For Diagnostic Cases counted against the FDP contract, the data traffic generated by RMT sessions contributes to the FDP traffic limit.
- Device-attributed cases: Diagnostic Cases counted against a Device Contract do not contribute to the FDP traffic limit; Device Contracts do not enforce traffic limits. The behavior is identical for Realtime Mode and RMT sessions.
New diagnostic sessions (Realtime Mode or RMT) are rejected only when both the device-level limit and the FDP fleet limit are fully exhausted.
Diagnostics Page in the DataPortal
To access the Diagnostics page in the DataPortal the following requirements must be met:
- A contract must include Diagnostic Cases in its Contract Details.
- The user needs the Machine:Maintain Permission Set.
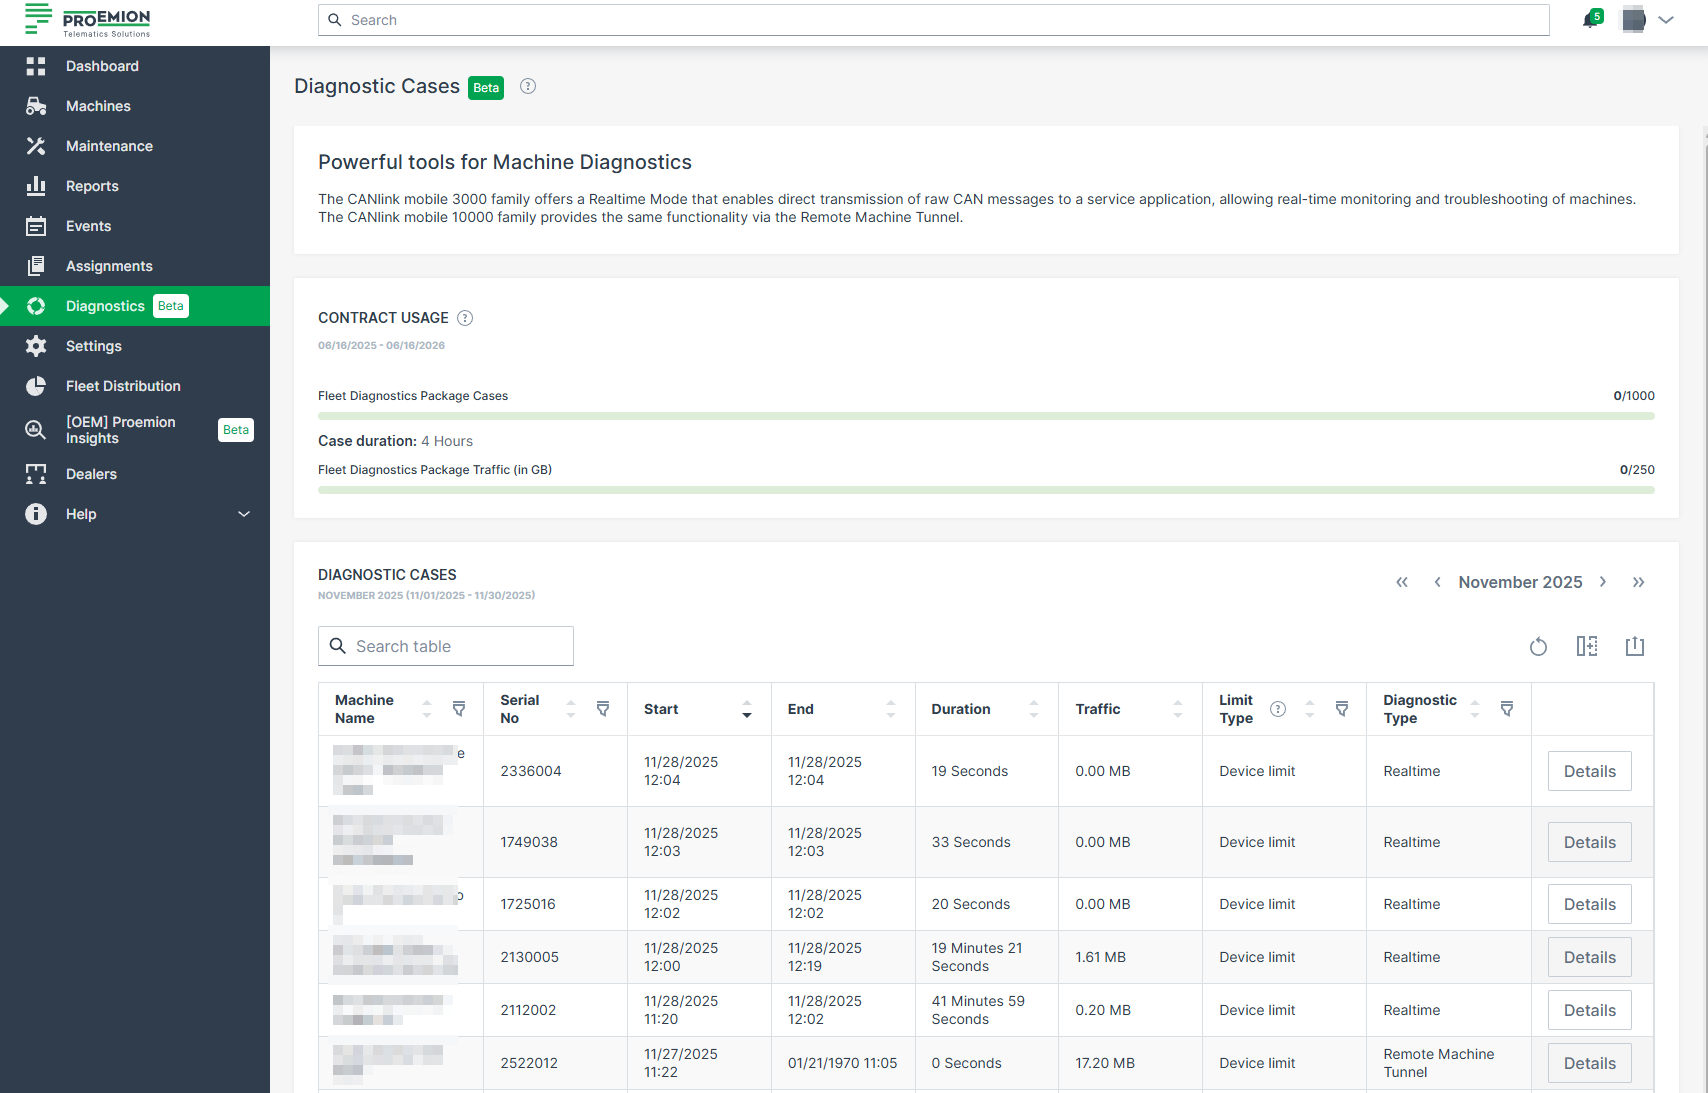
On the Diagnostics page you can view all Diagnostic Cases for the selected time period, including active sessions, past sessions, and the corresponding contract usage.
This includes Diagnostic Cases triggered by both Realtime Mode and Remote Machine Tunnel (RMT) sessions.
The page consists of two sections:
Diagnostic Usage Overview
This section summarizes the Diagnostic Case consumption for the currently active contract period. In the example screenshot below the following information are displayed:
-
Fleet Diagnostics Package Cases: The number of Diagnostic Cases used versus the allowed limit.
-
Case duration: The length of the configurable case window (default: 4 hours).
-
Fleet Diagnostics Package Traffic: Traffic consumed by Diagnostic Cases attributed to the Fleet Diagnostics Package (FDP).
This information helps you quickly assess current usage in relation to contract limits.
Diagnostic Cases Table
The table lists all Diagnostic Cases for the selected month. Each entry represents one Diagnostic Case, which may include several diagnostic sessions grouped within the case window.
| Column | Description |
|---|---|
| Machine Name | The name of the machine for which the Diagnostic Case was created. |
| Serial No | The machine’s serial number. |
| Start / End | Begin and end timestamps of the Diagnostic Case. For active cases, the remaining time until the case window expires is shown. |
| Duration | Total duration of all sessions included in the Diagnostic Case. |
| Traffic | Data volume generated during the Diagnostic Case. For cases attributed to a device contract, this value is informational only (no traffic limit applies). |
| Limit Type | Indicates to which contract limit the Diagnostic Case is attributed. Possible values: • Device limit – per device per month • Fleet pool – per fleet per year |
| Diagnostic Type | Shows which mechanism initiated the Diagnostic Case. Possible values: • Realtime – triggered by a Realtime Mode session • Remote Machine Tunnel – triggered by an RMT session |
Details Page
A Details button is available for each entry to open the Diagnostic Case Details page, where all sessions belonging to that case are listed individually.
To view more details about a specific Diagnostic session for the current month, proceed as follows:
-
Click on the Details button at the end of the line of a machine.
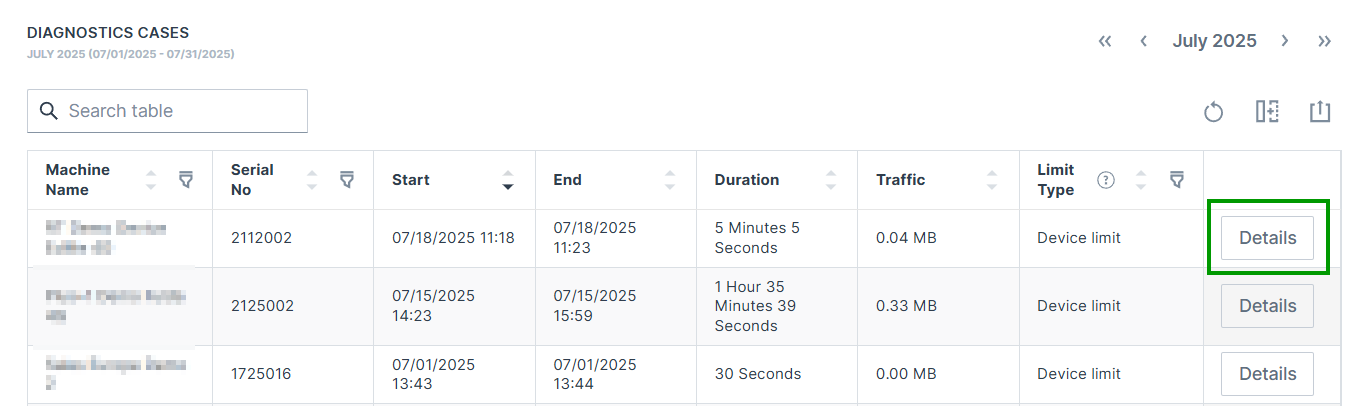
Figure 2: Diagnostic Case Details button -
The Diagnostic Case Details page opens.
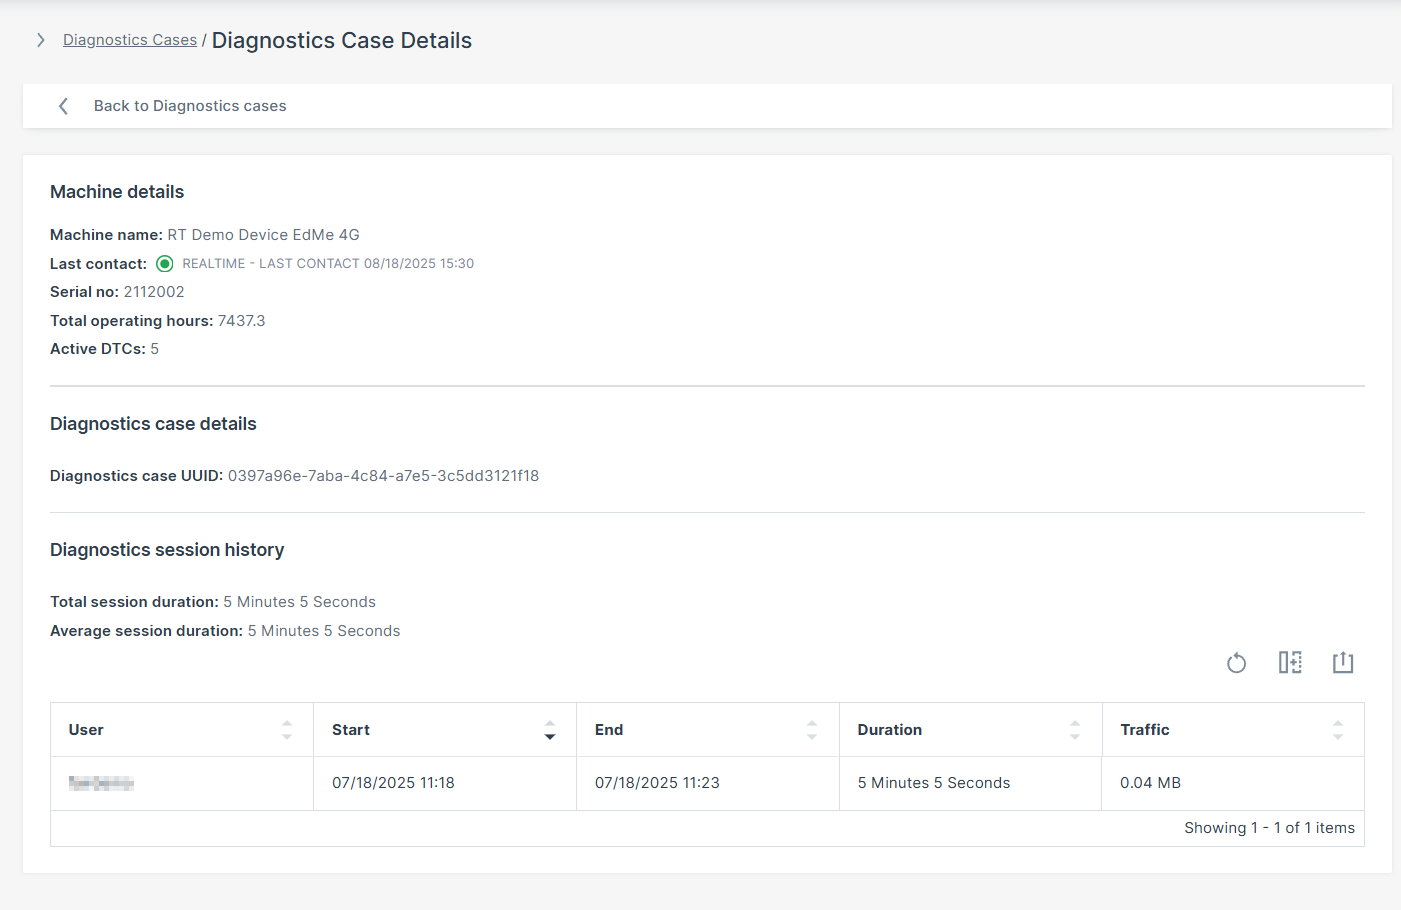
Figure 3: Diagnostic Case Details Page
In the following table you find the description of the displayed details.
| Field | Description |
|---|---|
| Machine Name | The registered name of the monitored machine/device. |
| Last Contact | Timestamp of the last successful communication. REALTIME indicates an active realt-time connection. OFFLINE indicates no current real-time connenction. |
| Serial Number | Unique hardware identifier assigned to the machine. |
| Total Operating Hours | Total accumulated runtime of the machine in hours. |
| Active DTCs | Number of currently active Diagnostic Trouble Codes (DTCs). |
| Diagnostics case UUID | Unique identifier (UUID) associated with a specific Diagnostic Case, used for session tracking and backend reference. |
| Total Session Duration | Combined time spent in all Diagnostic sessions. |
| Average Session Duration | Average duration of a Diagnostic session. |
| User | The DataPlatform user that initiated the session. |
| Start | Start timestamp of the Diagnostic session. |
| End | End timestamp of the Diagnostic session. |
| Duration | Total length of the Diagnostic session. |
| Traffic | Amount of data transmitted during the Diagnostic session (in MB). |
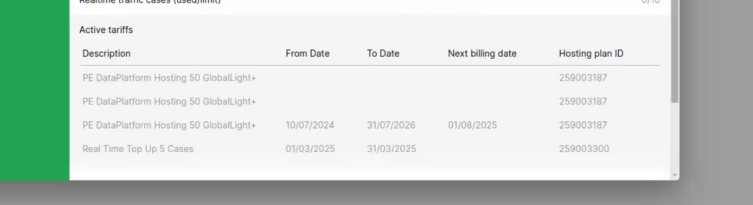
The count and the number of available Diagnostic Cases is displayed in the Contract Details:

Add Additional Diagnostic Cases per Device
If a specific machine requires more Diagnostic Cases than your current hosting contract allows, DataPortal will block the initiation of new Diagnostic sessions for that machine once the quota is exceeded.
You may request a one-time Diagnostic Case top-up to temporarily increase the monthly limit for a specific machine when additional capacity is needed and no fleet-level Platform contract is available. This top-up applies only to the specified calendar month, is not a permanent change to your contract, and is intended for exceptional, short-term use cases. Unused top-up cases do not carry over to future months. Top-ups are billed separately based on the requested amount and duration.
To request additional Diagnostic Cases use the Request Diagnostic Cases form.
Once confirmed, a new row titled Real Time Top Up [requested number] Cases appears in the Active tariffs list (see image below) and the Diagnostic traffic cases (used/limit) number increases accordingly.