Machine Details
Open Machine Details for any machine from either the list or map view in Machines, to view the machine's data across several tabs.
Note
Machine Companion App always displays machine data in the user's configured time zone, regardless of the machine's actual location. For further information, see Date & Time.
General Tab
The General tab shows the machine's status, work metrics, and geolocation:
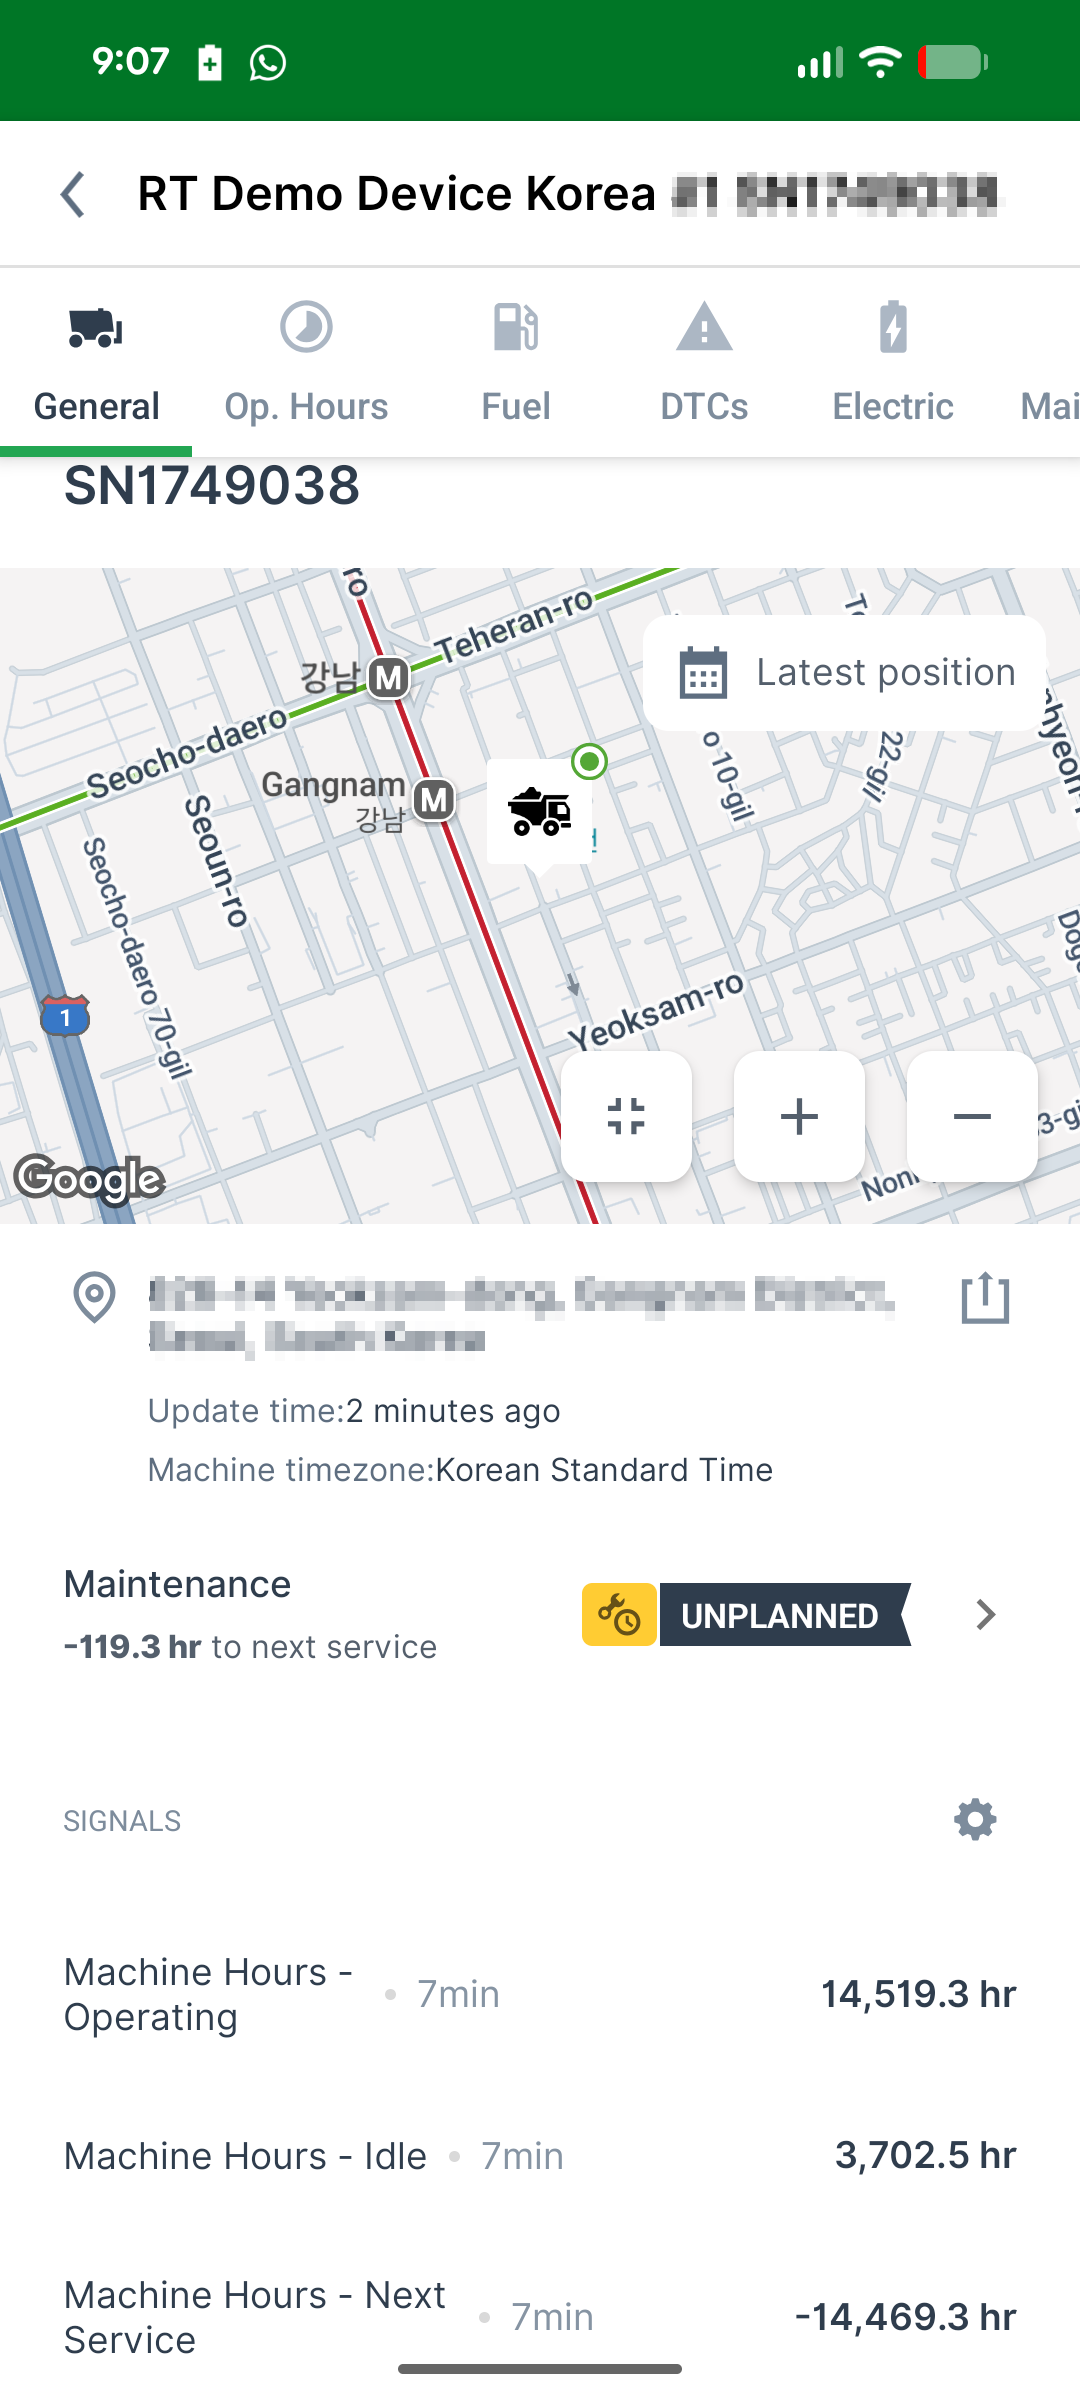
- Location history plotting within preconfigured time ranges (requires the Location:History Permission Set).
- Geolocation details, including the option to share the location or navigate to the machine, see Share Live and Static Location.
- Maintenance status indicators show the color-coded status of each maintenance task, including upcoming, overdue, skipped, and completed tasks, based on either the Proemion maintenance feature or the "Hours to next service" metric. Select a task to view its details.
- Zoom controls (Zoom In, Zoom Out, Reset) to adjust the map view and select a specific machine.
Signals List
The Signals list in the General tab shows essential Proemion standard machine signals and, if defined, aliased signals instead of the standard ones. The list shows the most recent update time and value for each signal available to the user for the selected machine:
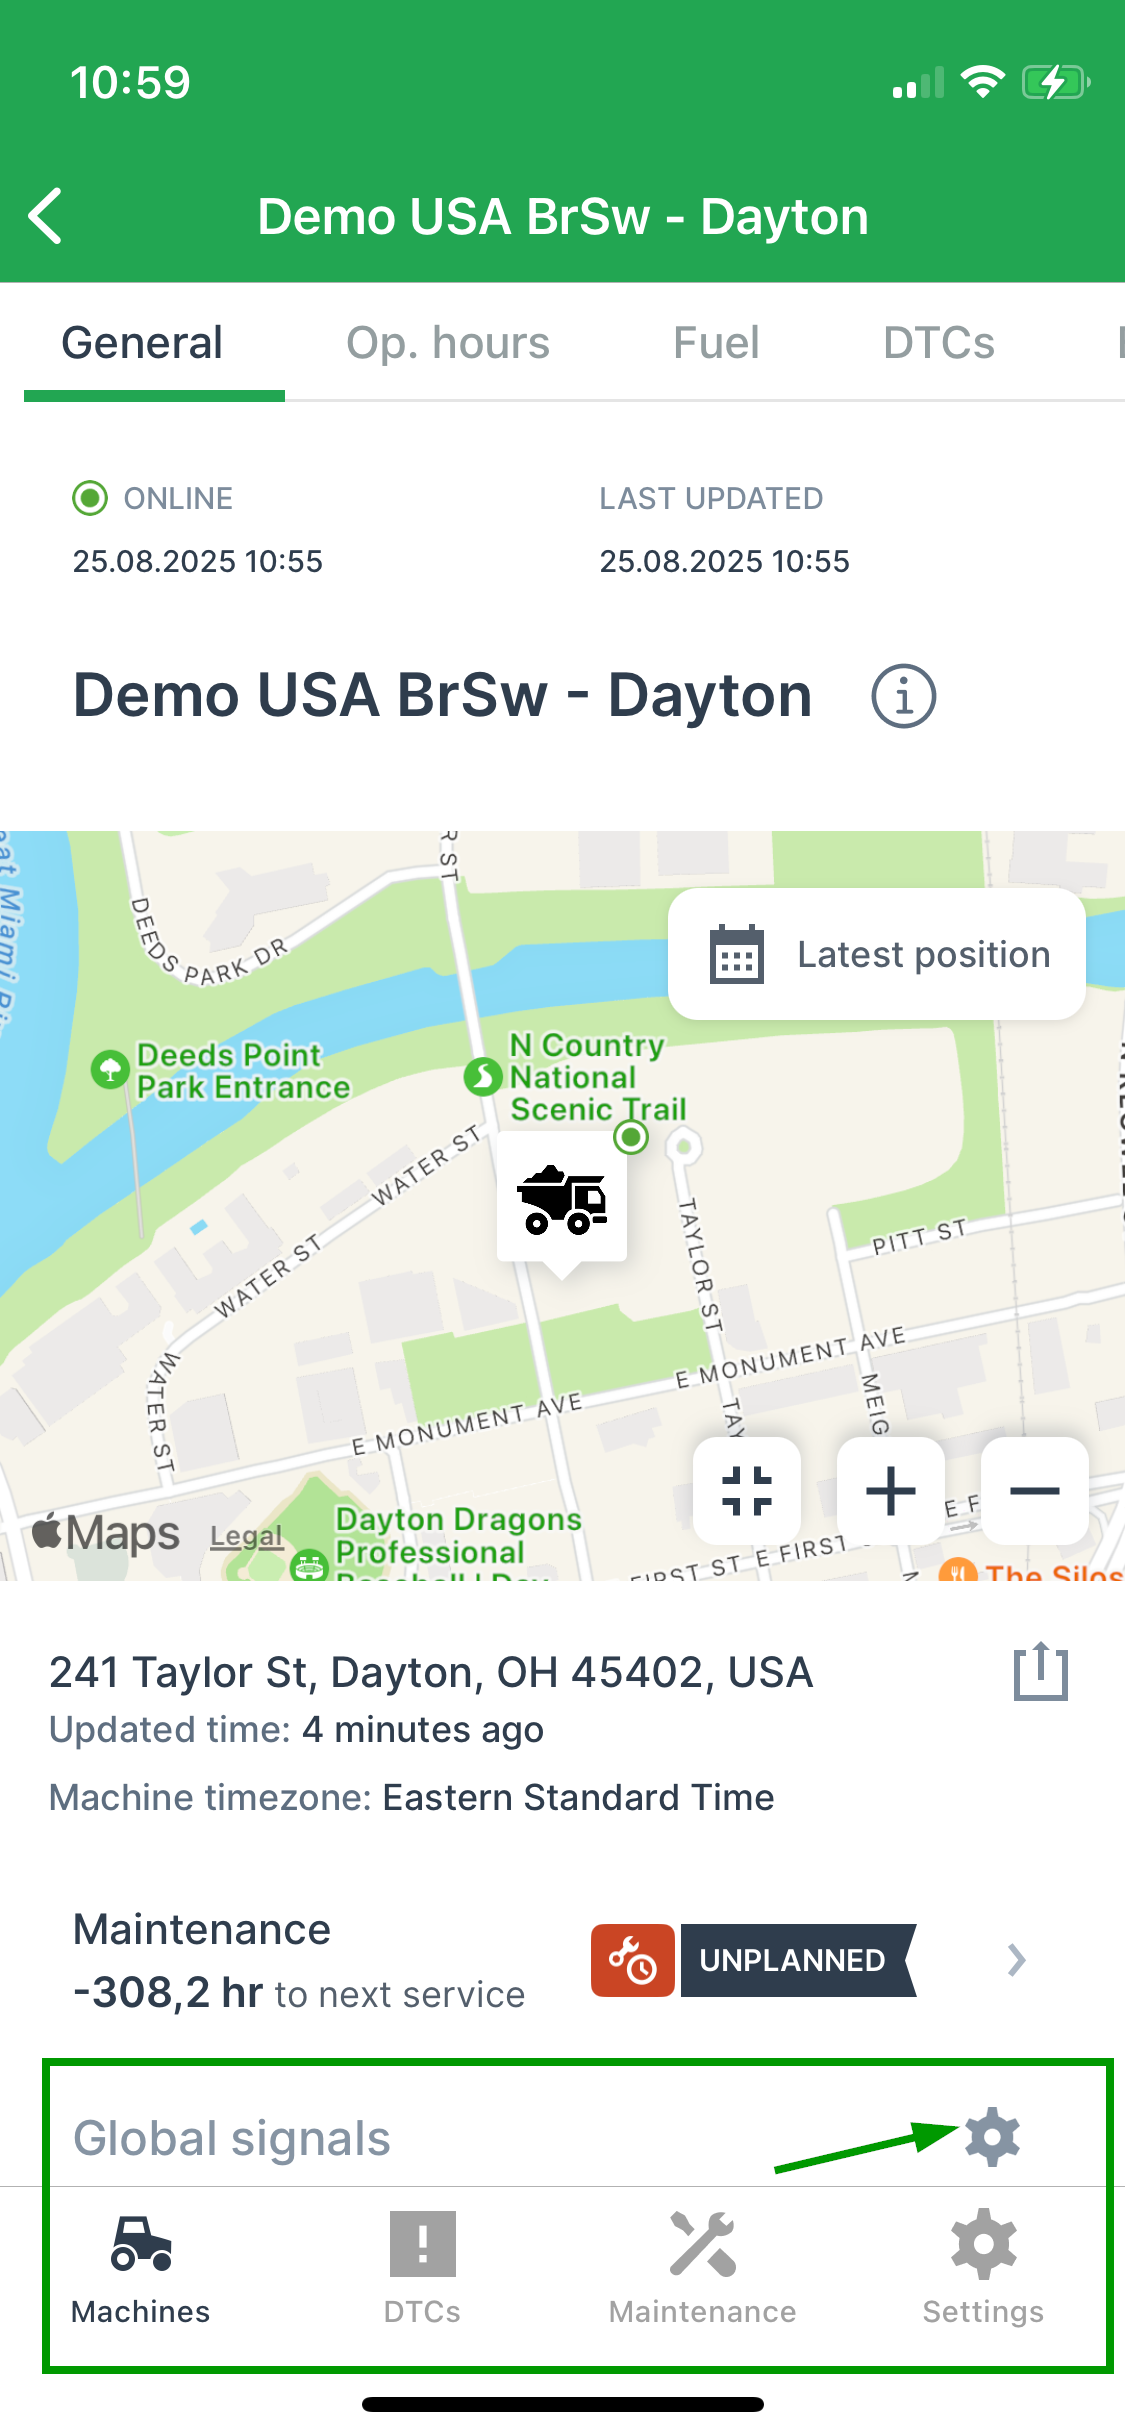
Adapt the Signals list
The list can be customized to display the required machine signals within the app, based on the OEM configuration:
- Signal names and units are localized based on the user's preferred language (English, German, or Italian) and unit system. The localization follows the device settings.
- Machine owners can prioritize the order of signals by dragging and dropping them according to their individual importance, see Reorder Signals. The set of signals used for your Machine Companion App is listed in the Global Signals menu.
Custom Signals
For white-labeled variants, the signal list additionally supports both standard and custom signals based on the OEM preferences, which can be configured during the initial setup.
Reorder Signals
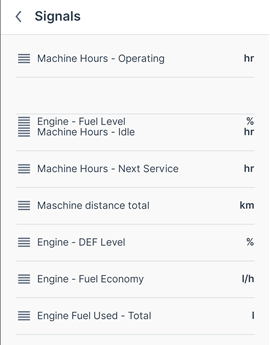
Machine owners can reorder the list of signals by priority using drag-and-drop. Reordering the signals changes their position shown in the General Tab of each machine.
Change the order via the Global Signals menu or through the settings icon in the General tab.
Select and hold a signal, then move it to the desired position:
Share Live and Static Location
Use the following options within the General tab to share the machine's location:
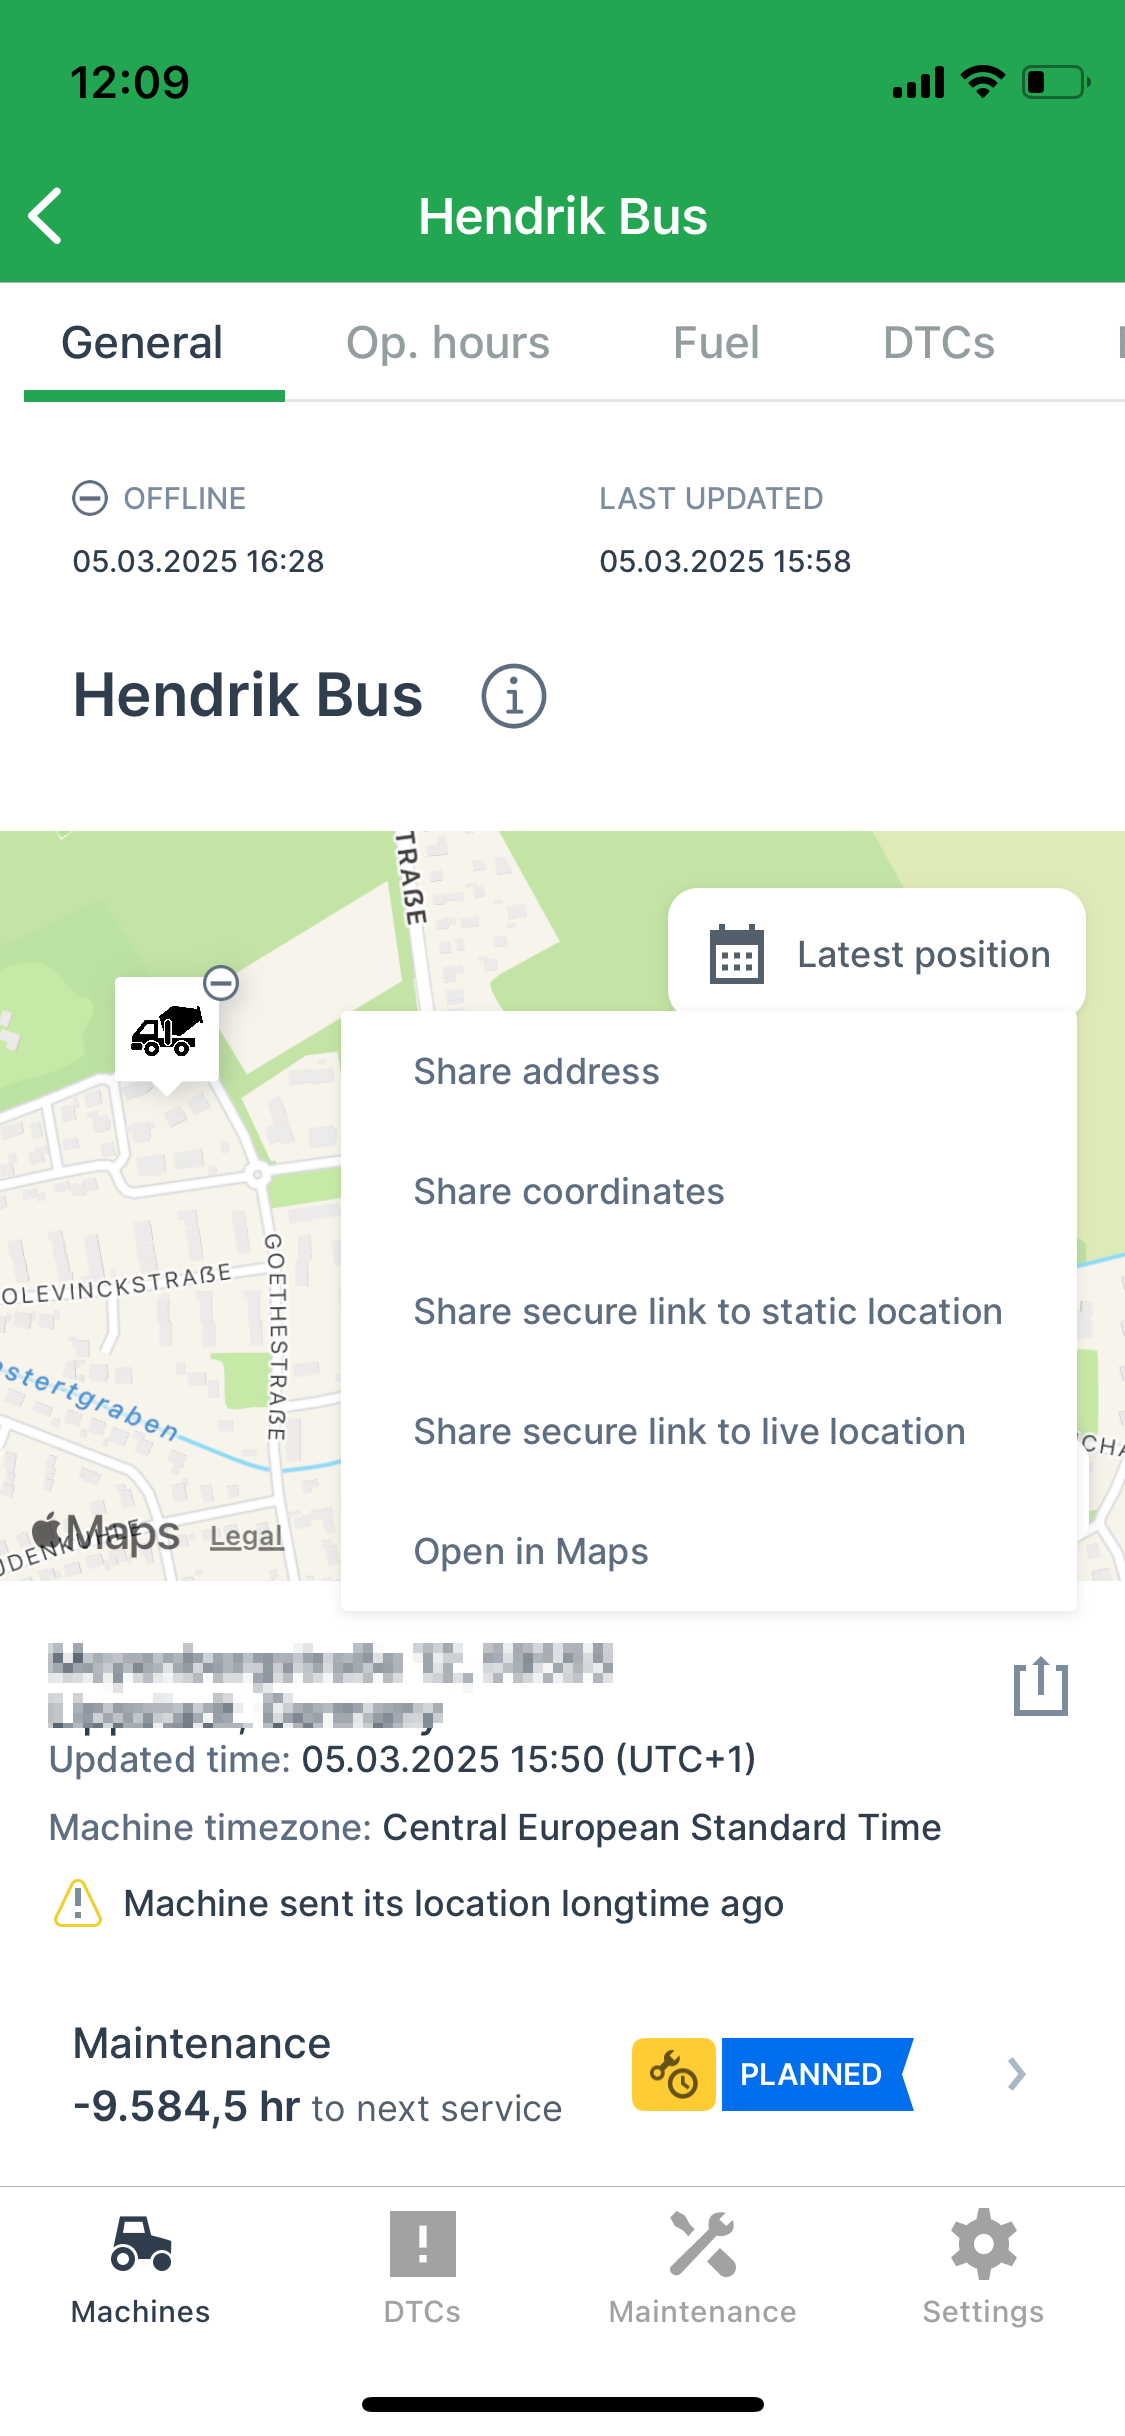
See Copy & Share location in the DataPortal manual, since the sharing options work the same way in both products.
Operating Hours Tab
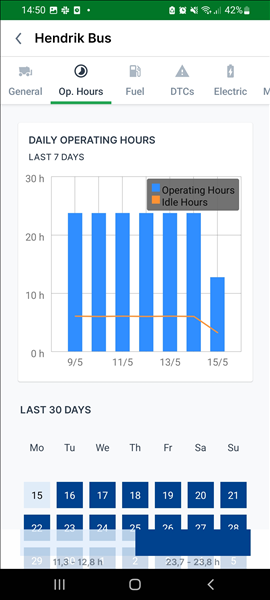
The Operating Hours tab features a daily operating hours graph that shows both operating and idle hours for the past 7 days. It also includes a heatmap showing the operating hours for the last 30 days in a calendar view, with each day color-coded by value:
Customization
OEMs can customize both the graph and the heatmap for white-labeled variants during the initial setup.
For the Operating Hours graph:
- Choose preferred standard or custom signals (up to 3 signals with the same measurement unit).
- Tailor by aggregator and time range.
- Select the color scheme.
- Choose between bar or line charts.
- Customize the bucket size.
- Set a fallback signal to use if the primary one is unavailable.
Note
The graph is normally based on a time period of 7 days and the heatmap on 30 days.
For the Operating Hours heatmap:
- Choose the operating hours signal the heatmap is based on, for example "engine hours total" or "machine hours total".
- Select the duration, e.g. 7 days or 30 days.
- Set a fallback signal to use if the primary one is unavailable.
Fuel Tab
The Fuel tab shows the current fuel level, efficiency, and consumption.
Note
The Fuel tab is enabled only if the machine has the corresponding signal configured.
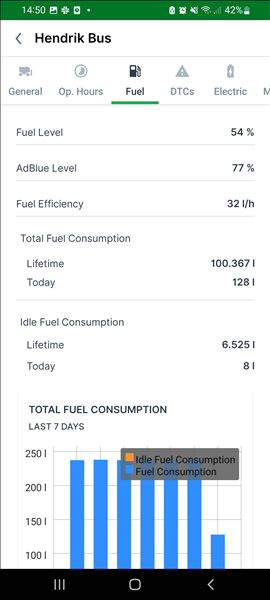
The same threshold icons appear next to each machine in Machines List.
Customization
OEMs can customize both the list and graph visualization for white-labeled variants on the iOS platform during the initial setup.
- Choose preferred standard or custom signals (up to 3 signals with the same measurement unit).
- Tailor by aggregator and time range.
- Select the color scheme.
- Choose between bar or line charts for the graph.
- Customize the bucket size.
- Set a fallback signal to use if the primary one is unavailable.
DTCs Tab
The DTCs tab shows the active DTCs reported by the machine:
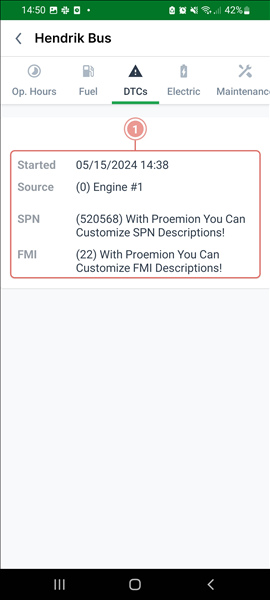
The DTC details show the following information:
- Source: the hardware on the machine containing the error, e.g. "Engine #1".
- Suspect Parameter Number (SPN): the description of the error, e.g. "oil level".
- Failure Mode Identifier (FMI): the kind of error, e.g. "exceeding or falling below value ranges", "short-circuits at the sensor", "incorrect update rate", or calibration errors.
The same DTC icons appear next to each machine in the Machines List.
Note that the DTCs screen shows the DTCs of all machines.
Electric Tab
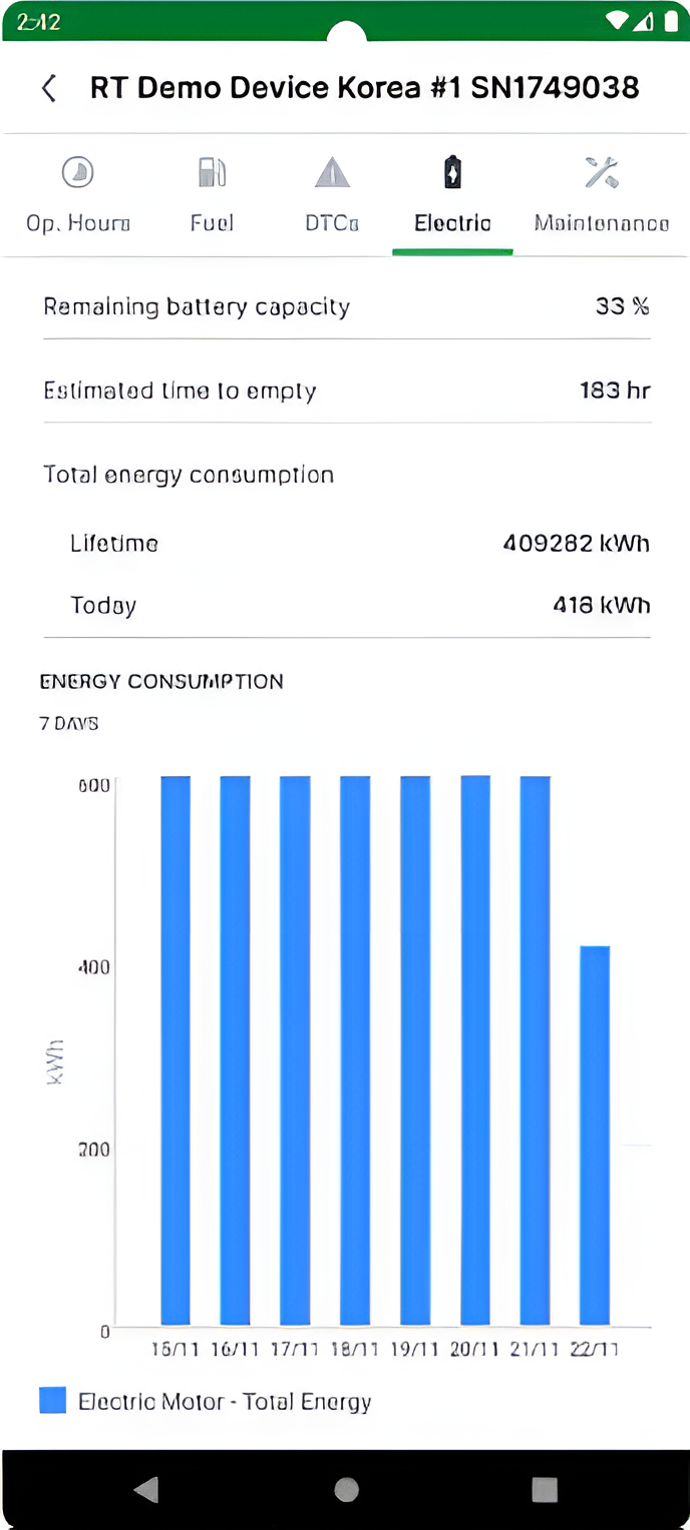
The Electric tab shows the battery and energy consumption.
Note
The Electric tab is enabled only if the machine has the corresponding signal configured.
Customization
OEMs can customize both the list and graph visualization for white-labeled variants during the initial setup.
- Choose preferred standard or custom signals (up to 3 signals with the same measurement unit).
- Tailor by aggregator and time range.
- Select the color scheme.
- Choose between bar or line charts.
- Customize the bucket size.
- Set a fallback signal to use if the primary one is unavailable.
Maintenance Tab
The Maintenance tab shows all maintenance tasks of the selected machine:
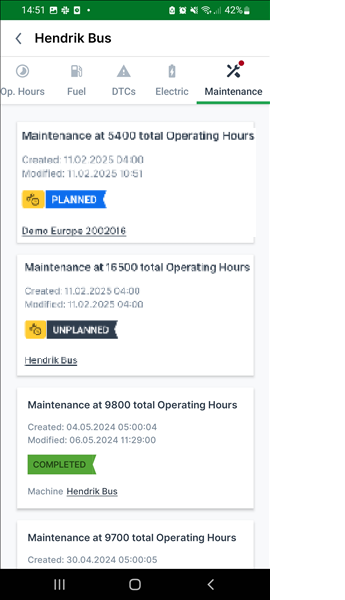
Select a maintenance task to view its details.
The same maintenance icons appear next to each machine in the Machines List.
Note that the Maintenance screen shows the maintenance tasks of all machines.