Machines
The Machines screen shows the inventory of available machines, presented in both list and map views.
In both views, you can:
- Search machines.
- Sort by Machine, Model, Organization Name, or Service due dates.
- Filter by Machine Mode (Online, Offline, or Not applicable), Model, Organization, and Warnings (for Fuel and AdBlue).
Status Icons
Both the list and map views show warning icons at a glance, for example when fuel or AdBlue levels are low, or when a machine has active diagnostic trouble codes (DTCs). They also show icons for the color-coded status of maintenance tasks, such as overdue, upcoming, completed, or skipped. Select a machine from either view to see the detailed tabs behind each icon.
- Low Fuel Level:

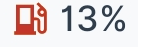 Details appear in the Fuel Tab.
- Yellow: the fuel level is available and is above 15 % and at or below 20 %.
- Red: the fuel level is below 15 %.
- Low AdBlue Level:

 Details appear in the Fuel Tab as well.
- Yellow: the AdBlue level is available and is above 15 % and at or below 20 %.
- Red: the AdBlue level is below 15 % (Android only).
- Active Diagnostic Trouble Codes (DTCs):
 Details appear in the DTCs Tab.
- Red: at least one DTC is active.
- Maintenance:
 Details appear in the Maintenance Tab.
Maintenance tasks are color-coded:
- Grey: skipped.
- Green: completed.
- Red: overdue.
- Yellow: upcoming, i.e. hours remaining until the next service.
Machines List
The list view shows each machine as a row with its status icons for quick scanning:
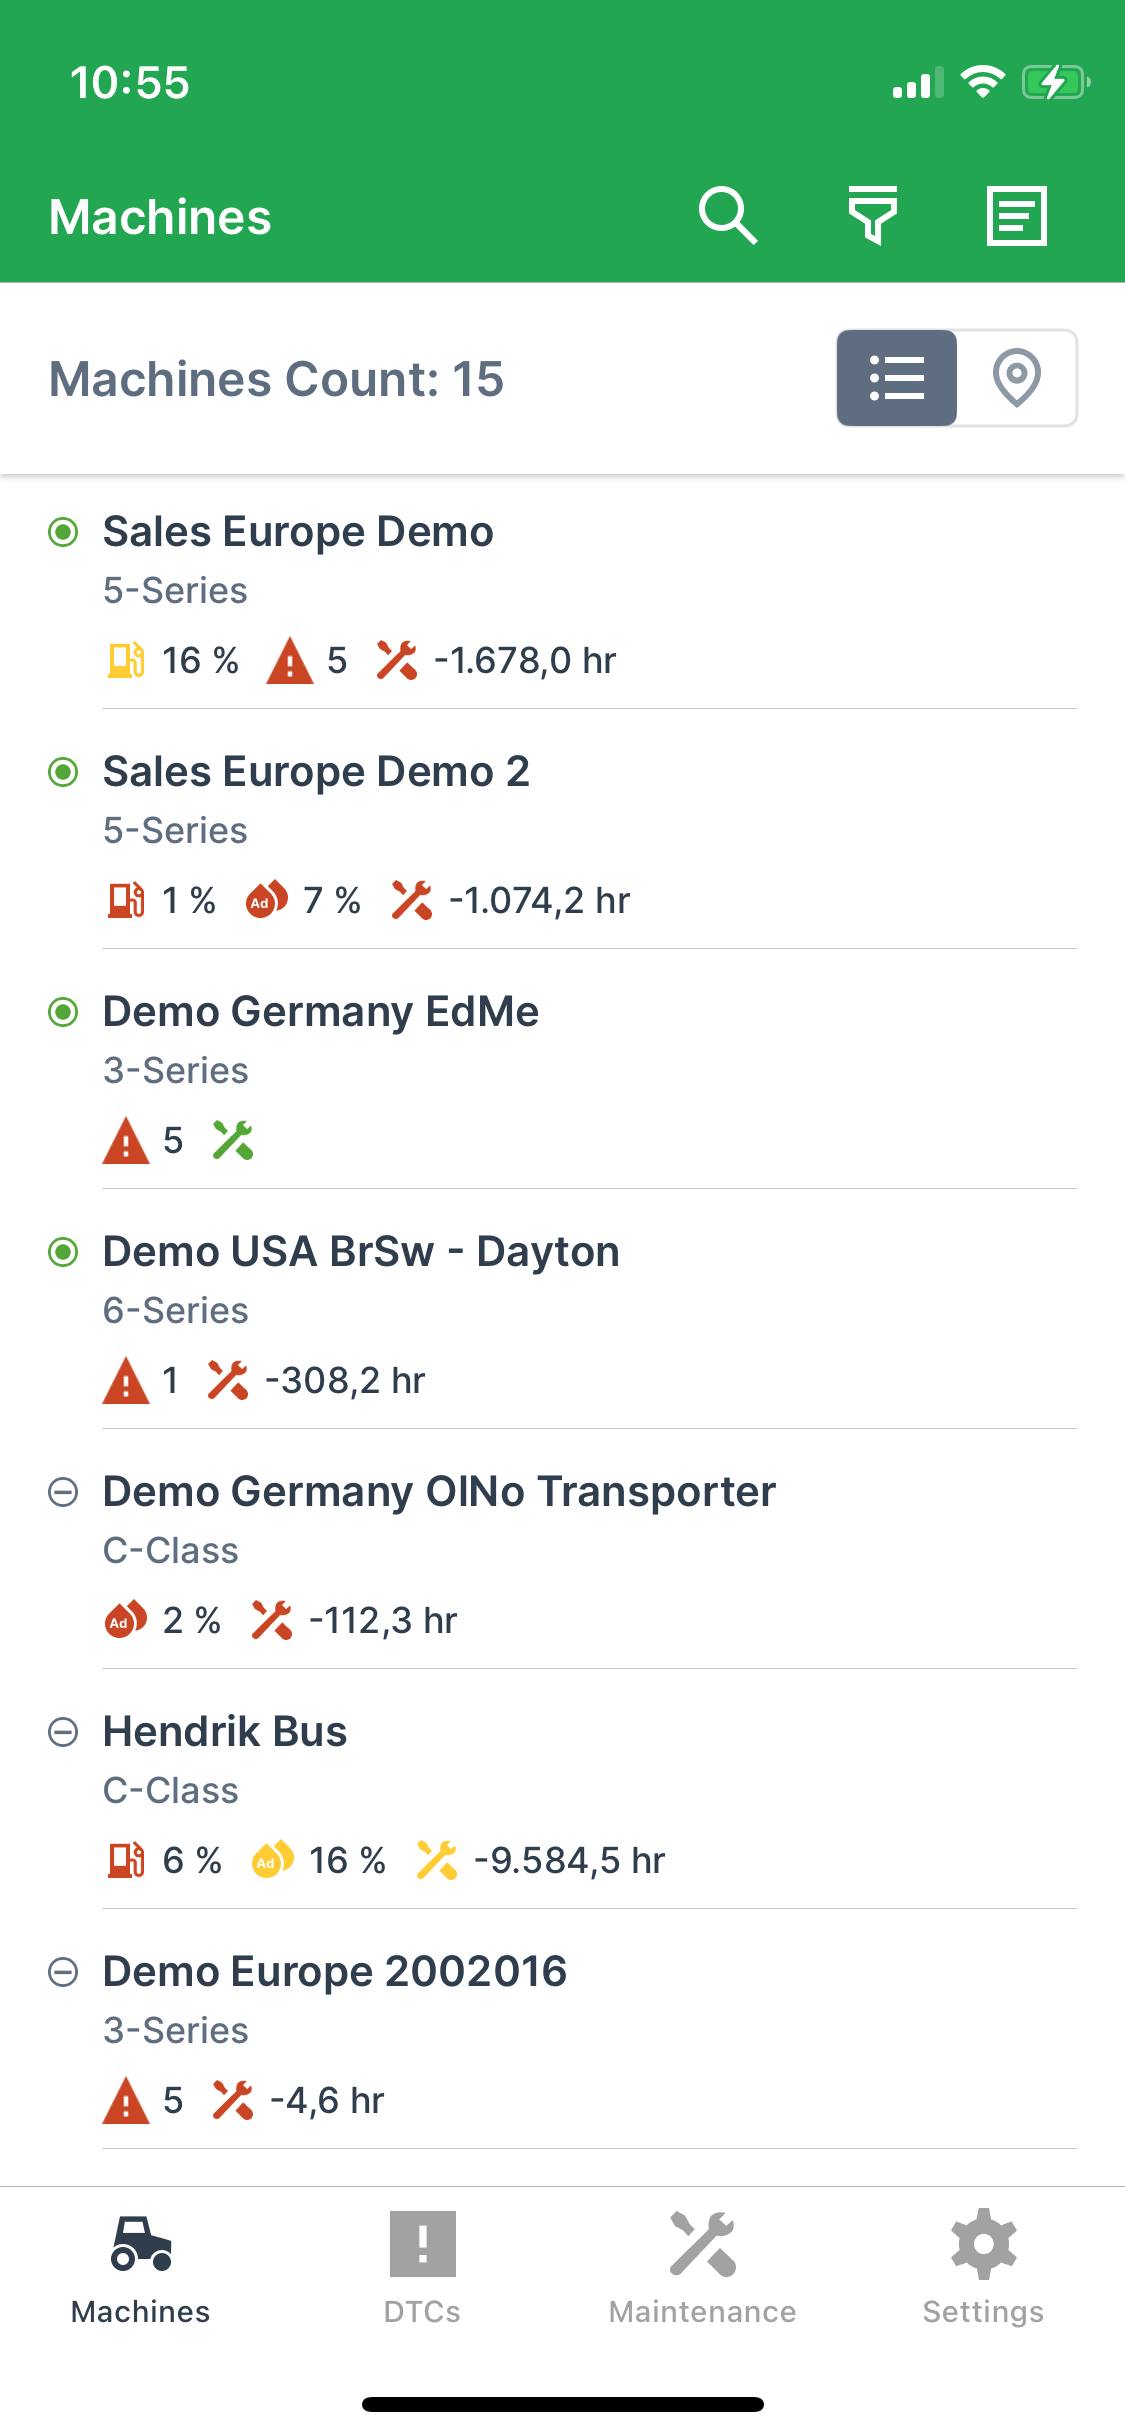
- Select a machine to open its Machine Details.
- Icons for maintenance tasks, fuel or AdBlue levels, and active DTCs appear as described under Status Icons.
Machines Map
The map view plots the same machines geographically and additionally offers:
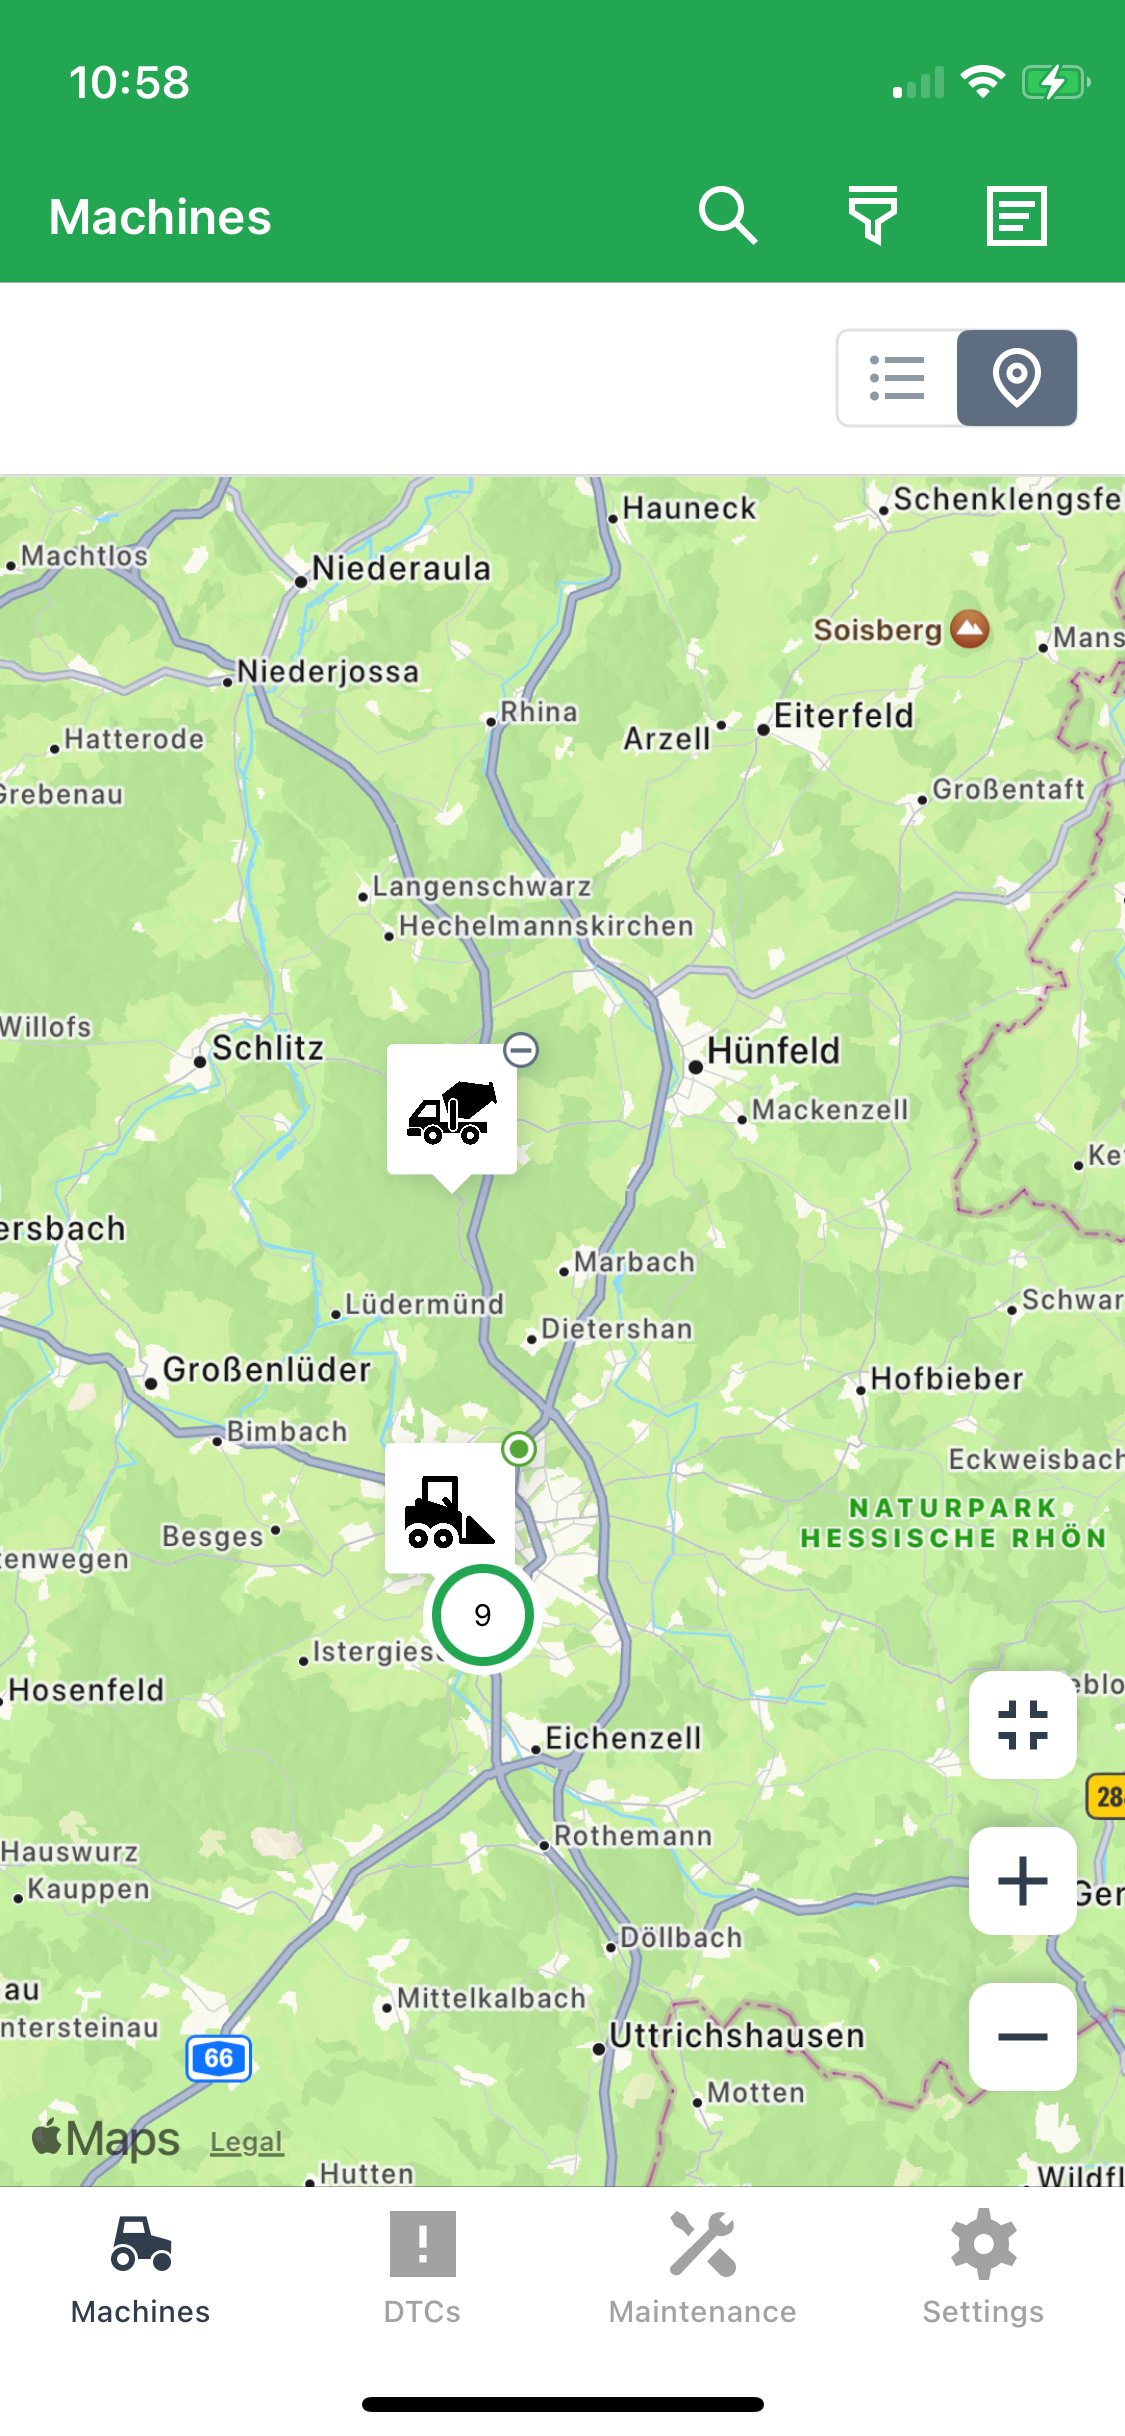
- Machine clusters for better accessibility; zooming in reveals more detail, down to individual machines. For details on cluster behavior, see Map view in the DataPortal manual.
- Machines shown with their model asset icon and online/offline status (enable this via the Themes Behavior option).
- Zoom controls (Zoom In, Zoom Out, Reset) to adjust the map view and select a specific machine.
- Location data and navigation options, to open the machine details or start Google Navigation to the machine's location.
- The same icons for maintenance tasks, fuel or AdBlue levels, and active DTCs as in the list view.
- A warning when location data is outdated.
Selecting a machine from either view opens its Machine Details screen, where you can monitor the machine's metrics across several tabs.