Dashboards for Machine Owners Guide
Purpose of this Guide
Who Is This Guide For?
This guide is intended for the person responsible for administrating dashboards and machine details pages, since they provide a trustworthy representation of machines to end users.
Why Machine Details Pages Matter
Dashboards and machine details pages in the DataPortal are the most frequently visited pages by dealers and machine owners. Their ease of use is therefore critical to how these users perceive your brand and services, and each user segment looks for different information on these pages.
User research showed that machine owners were dissatisfied with the information delivered to them on machine details pages. A follow-up study gathered more detail on what makes a good machine details page for a machine owner, and this guide reflects the knowledge gained from that research.
Following this guide ensures that machine owners, the owners of your machines, get the most value out of the DataPortal by providing them with the information they need to meet their goals through well-crafted machine details pages.
Tip
The DataPortal also offers a dedicated way to configure machine details pages by organization type, see Machine Page Layout in the DataPortal User Manual for the current recommended approach.
What This Guide Provides
This guide provides:
- A description of the core information machine owners look for when using the DataPortal, see The Machine Owner.
- A sample template for machine details pages tailored to machine owners, see Sample Template for an MO-oriented Machine Details Page and Structure of the Sample Template.
- General rules for visualizing machine data so it's easy for machine owners to understand, in case the sample template needs extending, see Working with Machine Details Pages.
Applying this guide to your machine details pages leads to:
- Machine owners who are more satisfied with your product and services.
- Higher customer satisfaction scores.
- Less frustration and fewer complaints from machine owners.
Machine owners are the proprietors of the equipment you produce as an OEM, and they usually own machines from more than one brand. Even if a customer of yours holds only one or two machines of your brand in the platform, that customer likely has other machines from different OEMs as well. Configuring the DataPortal to make the right information easily accessible to machine owners is therefore an opportunity to differentiate your offering from the competition.
The Machine Owner
Machine owners typically track machine activity for billing or accounting purposes. For example, a rental company leases a machine out to a third party, or a construction company wants to reflect the use and wear of a machine on a specific project in its books.
Machine owners mainly focus on two topics: recent machine activity and machine health.
Recent Machine Activity
When monitoring recent activity, machine owners want to understand:
- The amount of work the machine has delivered, expressed for example in operating hours, material throughput in tons, or load counts.
- The number of consumables used to deliver that work, such as fuel, DEF, or electric energy, and the resulting CO2 footprint.
- Whether the machine has been operated according to best practices, for example by comparing idling time against working time to demonstrate efficient use.
- Whether the machine stayed within defined thresholds for specific components, such as the weight loaded in a single load, speed, or engine RPM.
Machine Health
For machine health, machine owners want to understand whether the machine is ready and safe to operate. Helpful information for this includes:
- The level of every consumable needed to operate the machine, such as fuel, DEF, oil, or battery state of charge.
- Any active problem with the machine, such as warning lamps or trouble codes.
- Upcoming or overdue scheduled maintenance.
Most machine owners visit the portal to quickly check a machine's health and recent activity. Keep data visualizations simple and self-explanatory, since machine owners want to reach their goal fast and appreciate intuitive visualizations over feature-rich or complex ones.
Working with Machine Details Pages
Working with Machine Details Pages
If the sample template described in Sample Template for an MO-oriented Machine Details Page doesn't cover everything you need, use the following guidelines to extend it and visualize machine data in a way that machine owners can easily understand:
Organizing Layouts
Organize machine details page content by audience, topic, and time range.
Audience
The DataPortal lets you organize users and machines into organizational units structured as a tree, reflecting your company's organizational structure and managing visibility and access to machines.
Each organizational unit can also be qualified with an Organization Type, indicating whether it belongs to your company (OEM type), your dealership network (Dealer type), or one of your end customers (Machine Owner type). Since organization types align closely with user audiences in the portal, create separate Dashboards and Machine Page pages for each audience.
Tip
In the DataPortal, go to Settings > Administration > Organization Structure and check that every organizational unit in your tree is qualified with the correct organization type.
Topic
Machine owners are interested in two main topics, machine health and recent activity, which break down further into a more detailed taxonomy:
- Machine activity
- Location & Tracking: the machine's current location and its recent track.
- Work Delivered: the amount of work delivered in business-meaningful units. Depending on the asset type, this can take different forms, for example Total load count and Total weight loaded for an excavator.
- Consumption: the amount of consumables used, such as fuel level, battery level, or AdBlue level.
- Machine health
- Faults: active DTCs and DTC history.
- Consumable Levels: the levels of consumables needed to operate the machine.
- Scheduled Maintenance: upcoming and overdue maintenance that could put the machine at risk if not serviced in time.
- Operational Safety: any signal reflecting an aspect of machine use that's critical to operational safety, for example engine oil temperature, engine speed, machine speed, tilt angle, or engine load.
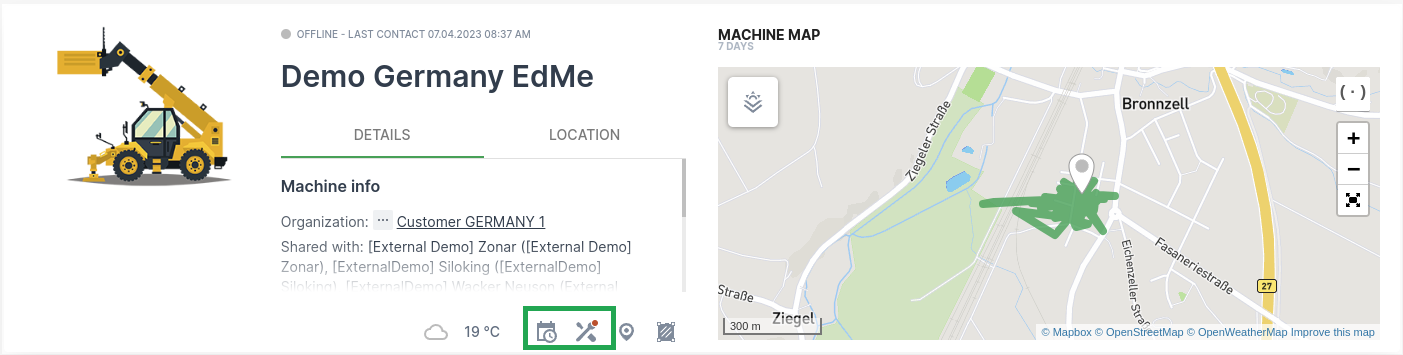
If the maintenance feature is active, the machine master data widget already shows whether a machine needs maintenance:

If the DataPortal's maintenance feature isn't in use, a signal like Hours to next service can serve the same purpose.
Create one page layout for each of the two main topics, activity and health, and use this taxonomy to organize widgets within each layout. Depending on how many signals your fleet uses to represent each topic, consider moving lower-level topics out into their own layout.
Time Range
Currently, the time range for data visualization is configured on a widget-by-widget basis, which can lead to a layout that mixes completely different time ranges on the same page and confuses users. Create layouts where all widgets use the same time range.
Note
With Machine Pages by Organization Type - Migration Guide, you can organize machine details pages by audience and topic. Contact Service and Support if you don't have access to this feature yet.
A sample setup for machine owner-targeted machine details pages could include:
- A home layout with the machine's activity for the last 7 days.
- An alternative layout with the machine's activity for the last 30 days.
- An alternative layout with the machine's health status.
Use Colors Consistently
Use a limited palette of colors, and apply it consistently across data visualizations in different widgets, so that users can easily understand what's being represented.
Colors can serve two purposes: identifying signals, or conveying meaning.
Identify Signals
Displaying a signal with the same color every time makes it easy to identify in different data visualizations. This approach has a drawback: as the number of signals displayed grows, so does the number of colors needed, which can result in a palette too large to tell one color from another.
Convey Meaning
Color can also add semantics to a data visualization, the same way traffic lights use red, green, and yellow to express stop, move on, and a transition between the two.
Approach 1: "Health"
Use a small set of colors, such as green, red, and grey, to express a healthy, unhealthy, or neutral situation respectively.

Approach 2: "Maximum, Minimum, and Average"
Use the same green, red, and grey palette to express minimum, maximum, average, and current values respectively.
Approach 3: "Current Value"
Use a high-contrast color, such as black, to represent the current value.
The semantics of colors can change between approach 1 and approach 2 and still be understood from context. If mixing them isn't convenient for your case, use different shades of red, green, and grey for health versus maximum/minimum/average values.
Conveying meaning through color is the recommended approach, since it's more expressive and keeps the number of colors used limited, making the information easier to read.
Keep the Layout Cohesive and Beautiful
When laying out widgets on the canvas, keep the result cohesive and visually balanced.
Cohesive
Organize related aspects of the machine together, for example by signal or topic. A topic groups related signals, for instance an engine topic combining engine state, engine speed, and engine temperature signals, or a billing/accounting topic grouping operating hours with consumables.
Add a divider to separate blocks of content from each other.
Beautiful
Think of widgets as bricks in masonry work: gaps in rows or columns make the wall look unfinished. Avoid leaving gaps between widgets in a layout.
Simplify Visualizations
The DataPortal offers extensive visualization features and flexibility, which can tempt you to use many different, sophisticated visualizations, or to mix several signals into one visualization. This level of complexity may work well for an internal OEM audience, but not for machine owners.
Machine owners are interested in a limited set of machine data and have little time to spend understanding it. They need to understand both the data being visualized and the visualization itself (plot, gauge, heat map, and so on). The more signals and visualization types a layout uses, the harder it becomes for a machine owner to understand the machine data. To keep layouts simple:
- Reduce the number of different widgets and visualization options. Keep the widget types and visualizations you use limited, and once you find a good configuration for a category of signals, reuse it consistently for all of them.
- Use only one signal per widget where possible. Reducing the number of signals in a widget simplifies the visualization, especially when signals use different units and the widget would otherwise need multiple axis scales. Showing two signals in a single widget can still make sense to reflect their correlation, for example operating hours with fuel consumed, distance traveled with fuel consumed, or load count with total weight handled. The same correlations remain visible when using one signal per widget and placing the related widgets next to each other.
Less is better.
Organizing Widgets in a Layout
Make a layout look compact by aligning widgets wherever possible.
Horizontally Aligning by Topic or Signal
For example, the following row is all about engine speed measured in RPM. Two different widgets provide visualizations of the same signal.
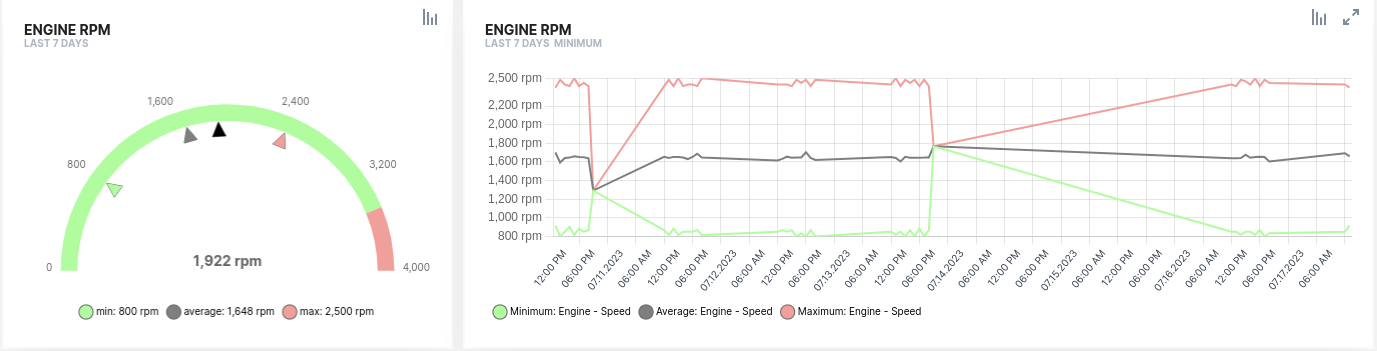
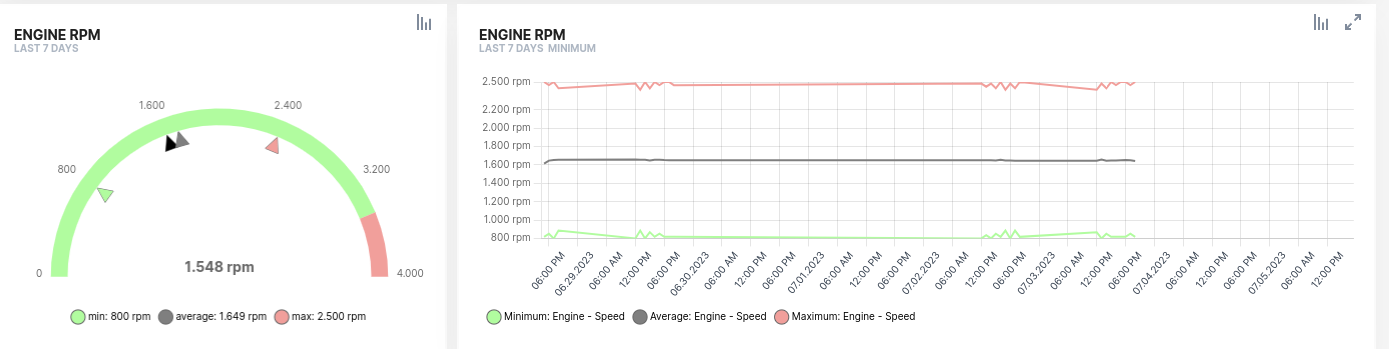
The widget on the left shows the maximum, minimum, average, and current engine speed values over the last 24 hours, letting the user spot misuse in recent hours. The widget on the right shows the full history of the maximum, minimum, and average engine speed values hour by hour. If misuse took place, this lets the user drill down further to see whether it was accidental or ongoing, and when it happened.
Vertically Aligning by Visualization Pattern
Once you find a good set of visualizations for a signal or topic, you can apply the same set, or pattern, to other signals of a similar nature, reusing it across layouts.
For example, the following two rows use the same structure to visualize two signals, engine speed in the upper row and machine speed in the lower row. Since the visualizations are identical for both signals, once a user understands the story told by the first row, they can apply the same understanding to the second row, which reduces cognitive load and makes layouts easier to understand.
Let the User Drill Down
Widgets serve as entry points for reports. Users can click the report icon on any widget to navigate directly to a preconfigured report they can further customize to their needs. Reports are also the only way a user can export their machine data for use in email workflows, billing, and other business activities.
Enable reports for machine owner users, since it's the only way they can drill down into their machine data and export it for sharing outside the DataPortal.

Sample Template for an MO-oriented Machine Details Page
This chapter provides a sample template for a machine details page that visualizes the data most commonly of interest to machine owners across OEMs and industries.
A Foreword on Standard Signals
Proemion recommends a set of Proemion Standard Metrics with defined semantics, so that all stakeholders understand what a signal represents and the unit it uses to express its magnitude.
For example, many machines track the total distance traveled. Naming this signal distance_traveled and expressing it in leagues, which isn't a standard metric or imperial unit, still delivers the metric to the DataPortal, but prevents users from:
- Selecting their preferred unit system, metric or imperial, and getting the value accordingly.
- Delivering cumulative distance traveled data in an ISO 15143-3 (AEMP) compliant format.
- Using the metric in the Machine Companion App, see Machine Companion App (Google Play).
Using the standard value.common.machine.distance.total signal key, the length.KILOMETER unit, and the counter signal type (see PDC Value Definition) instead lets the platform:
- Support the signal automatically in the Machine Companion App.
- Represent the values in both supported unit systems, converting between them automatically.
- Make the signal immediately available through the AEMP API without additional configuration, if a user wants to export their machine data that way.
Using standard signals means many DataPortal features work out of the box, and new features become available as they ship, without extra configuration effort.
This guide uses a subset of standard signals that applies to most machines across industries, to illustrate a minimal configuration for machine details pages focused on the interests of a machine owner:
- Location (degrees):
value.common.machine.geo.latitude,value.common.machine.geo.longitude - Fault codes:
value.common.machine.caution.code,value.common.machine.diagnostic.trouble.code - Total distance traveled (kilometers):
value.common.machine.distance - Total operating hours (hours):
value.common.machine.hours.operation.total - Total number of loads, for example for earth moving machines or elevator platforms:
value.common.machine.load.count.total - Total weight loaded (kilograms):
value.common.machine.load.total - Current diesel exhaust fluid level:
value.common.engine.def.level - Current fuel level:
value.common.engine.fuel.level - Current oil level:
value.common.engine.oil.level - Total fuel used (liters):
value.common.engine.fuel.used.total - Machine speed (kilometers per hour):
value.common.machine.speed - Engine speed (revolutions per minute):
value.common.engine.speed
Tip
In the DataPortal, go to Settings > Machine Data Management > Signal Catalog to check how many of the standard signals your fleet already covers. Covering all standard signals isn't required. Covering a few of the core signals listed above already unlocks most of the platform's potential.
Structure of the Sample Template
The following template is structured into two machine page layouts, each focused on one of the two main topics of interest to the machine owner: machine activity and machine health. Each layout uses the taxonomy described in Organizing Layouts, which breaks these two topics down further.
The sample template presents the questions a machine owner is trying to answer, followed by the data visualization that best answers that question.
Activity Topic
Location
Where is my machine today? Does it have any scheduled maintenance?
Work
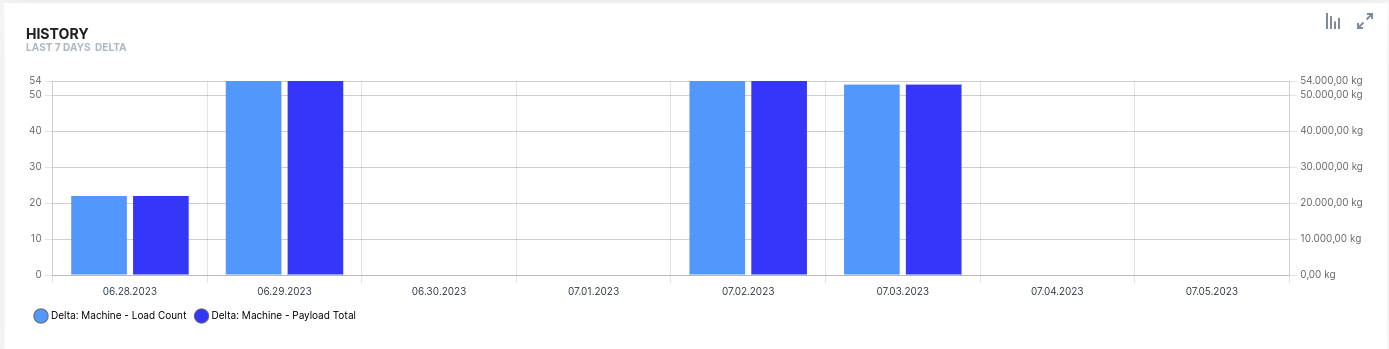
What has the machine been doing in the last 7 days? How much work has it delivered in hours each day?
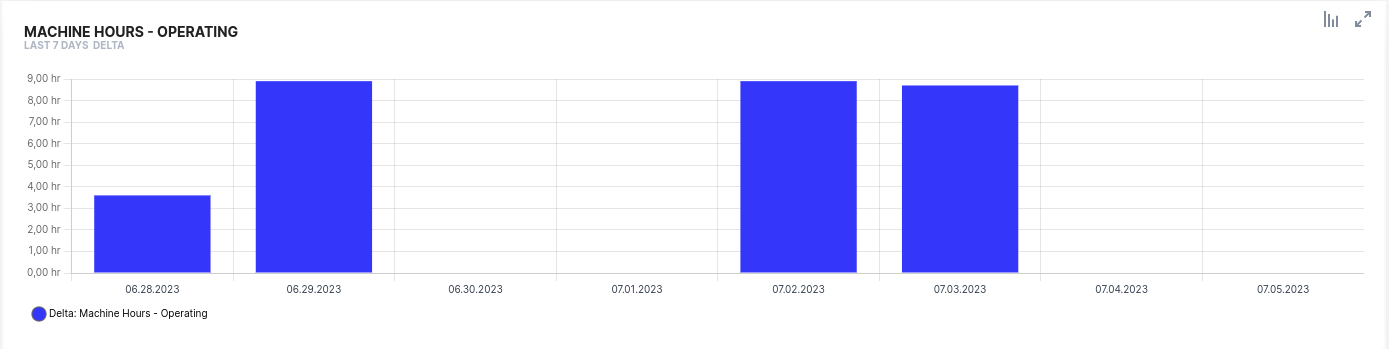
The amount of work delivered by a machine depends on its asset type. For example, an earth moving machine delivers Total load count and Total weight loaded signals. This example combines the two signals in a single widget to show their correlation, but you could show the same information just as well by plotting each signal in its own widget and aligning the two widgets vertically.
How much work has it delivered in number of loads and weight handled each day?
Consumption
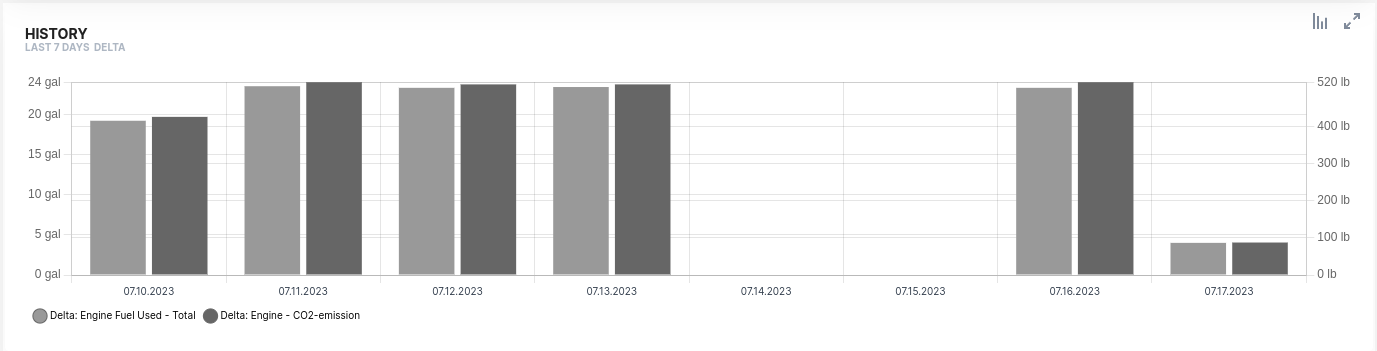
What amount of consumables has been consumed? In this case, how much fuel was consumed each day, and what was the CO2 footprint?
Health Topic
Faults
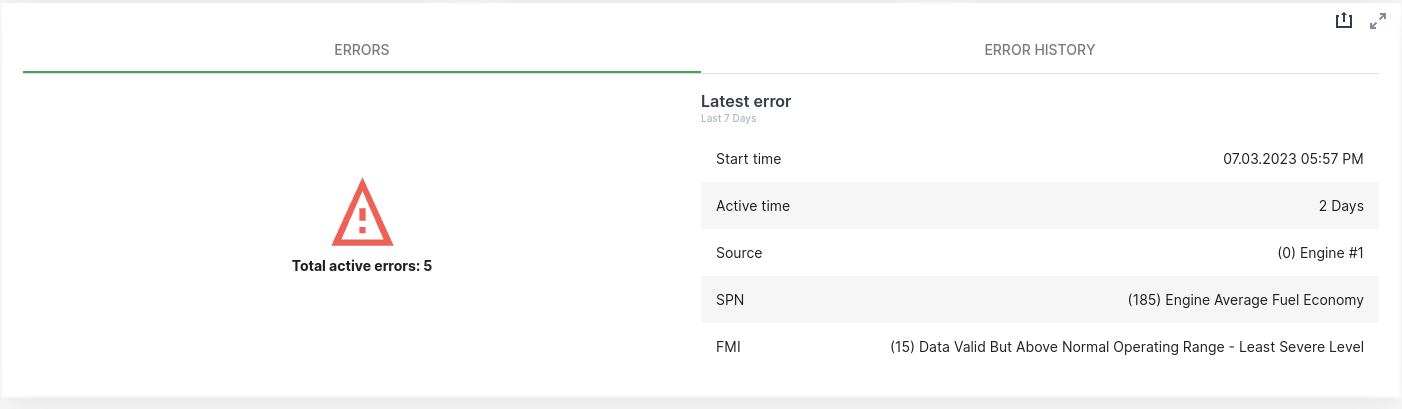
Does the machine have any active problem? Has it had any problem recently?
Maintenance
Where is my machine today? Does it have any scheduled maintenance?
If the maintenance feature is active, the machine master data widget already provides access to the maintenance topic out of the box.
If the maintenance feature isn't in use, consider adding the latest value of a signal representing Hours to next service, or a state signal indicating whether a machine needs maintenance.
Consumables
Is the machine ready for work today?

Operational Safety
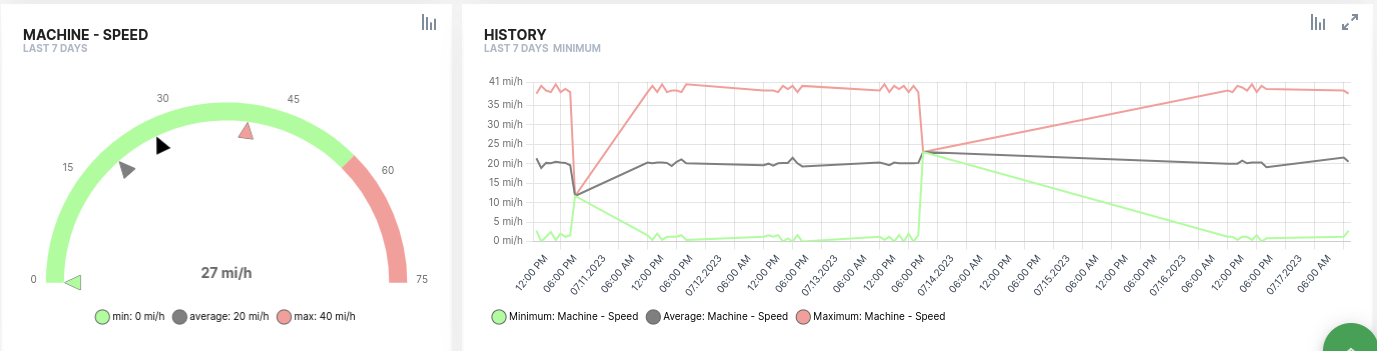
The following two examples show how to represent proper machine use within a recommended operating range.
The first example looks at engine speed in revolutions per minute:
- On the left, the maximum, minimum, average, and current values over the last 7 days show whether the machine was operated beyond the recommended threshold at any point.
- On the right, the history of the maximum, minimum, and average values shows, if a violation occurred, whether it happened once or repeatedly, and when.
Is the engine being operated according to the OEM's recommendations?
Is my machine driven at speeds within legal and safety recommendations?
The second example applies the same visualization to machine speed data, showing whether the machine was driven at speeds beyond those recommended. This also illustrates reusing a visualization pattern, see Vertically Aligning by Visualization Pattern for the general approach.
Service and Support
The latest versions of the drivers, software, firmware, and documentation are available at Document Library.
Do you need help or want to report a bug?
Visit Proemion for more information, or raise a ticket via Support.
Firmware Updates and Support
To ensure the best performance and security of your devices, we strongly recommend always installing the latest firmware provided by Proemion.
Please note:
We do not provide technical support for issues caused by outdated firmware.
Errors resulting from outdated firmware are considered non-qualified errors and are not covered by warranty or support.
Regular firmware updates are essential to maintaining the functionality of your devices.
If you need assistance with the update process, please contact our Service and Support.
For more information on the Firmware Update, check the device manual of your device at the Document Library.