Organizing Widgets in a Layout
Make a layout look compact by aligning widgets wherever possible.
Horizontally Aligning by Topic or Signal
For example, the following row is all about engine speed measured in RPM. Two different widgets provide visualizations of the same signal.
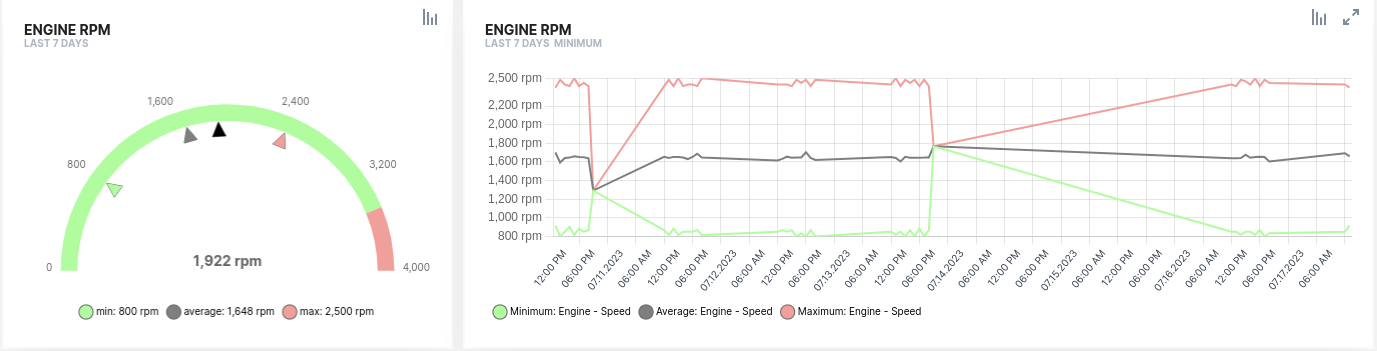
The widget on the left shows the maximum, minimum, average, and current engine speed values over the last 24 hours, letting the user spot misuse in recent hours. The widget on the right shows the full history of the maximum, minimum, and average engine speed values hour by hour. If misuse took place, this lets the user drill down further to see whether it was accidental or ongoing, and when it happened.
Vertically Aligning by Visualization Pattern
Once you find a good set of visualizations for a signal or topic, you can apply the same set, or pattern, to other signals of a similar nature, reusing it across layouts.
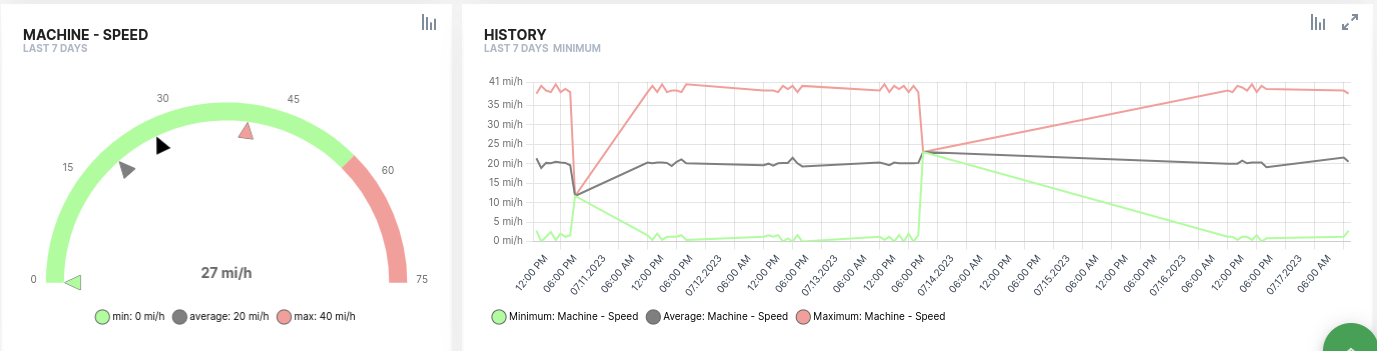
For example, the following two rows use the same structure to visualize two signals, engine speed in the upper row and machine speed in the lower row. Since the visualizations are identical for both signals, once a user understands the story told by the first row, they can apply the same understanding to the second row, which reduces cognitive load and makes layouts easier to understand.