Structure of the Sample Template
The following template is structured into two machine page layouts, each focused on one of the two main topics of interest to the machine owner: machine activity and machine health. Each layout uses the taxonomy described in Organizing Layouts, which breaks these two topics down further.
The sample template presents the questions a machine owner is trying to answer, followed by the data visualization that best answers that question.
Activity Topic
Location
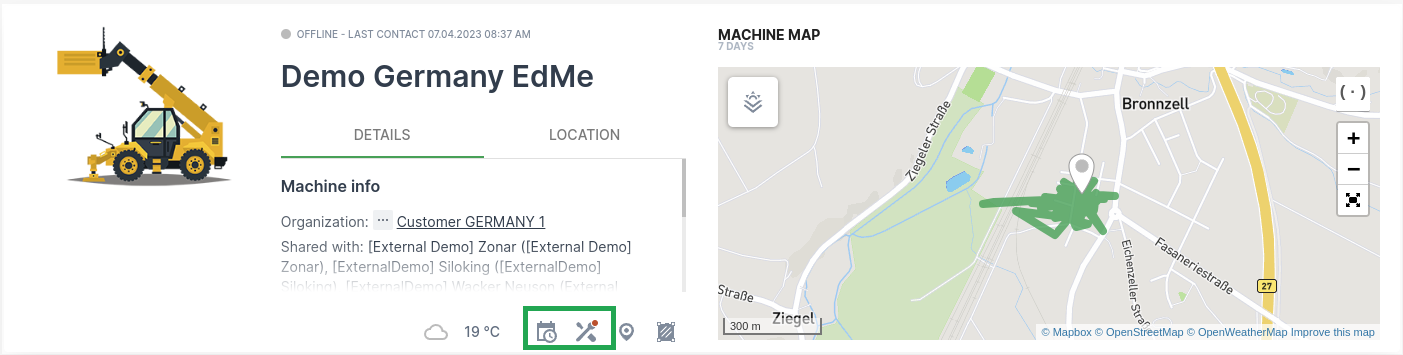
Where is my machine today? Does it have any scheduled maintenance?
Work
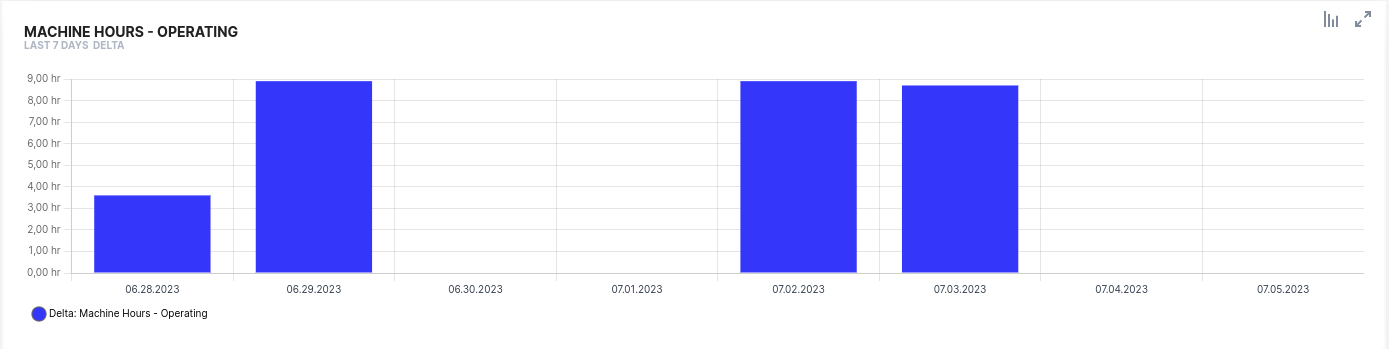
What has the machine been doing in the last 7 days? How much work has it delivered in hours each day?
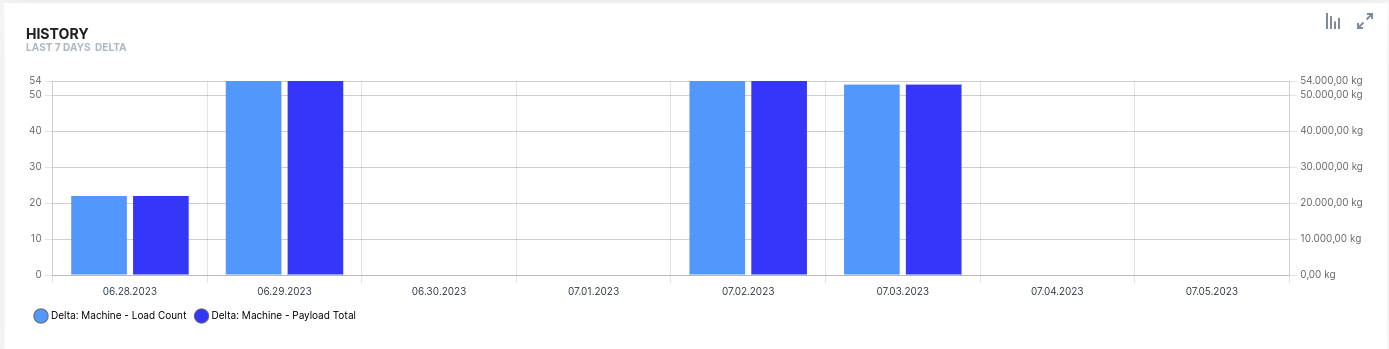
The amount of work delivered by a machine depends on its asset type. For example, an earth moving machine delivers Total load count and Total weight loaded signals. This example combines the two signals in a single widget to show their correlation, but you could show the same information just as well by plotting each signal in its own widget and aligning the two widgets vertically.
How much work has it delivered in number of loads and weight handled each day?
Consumption
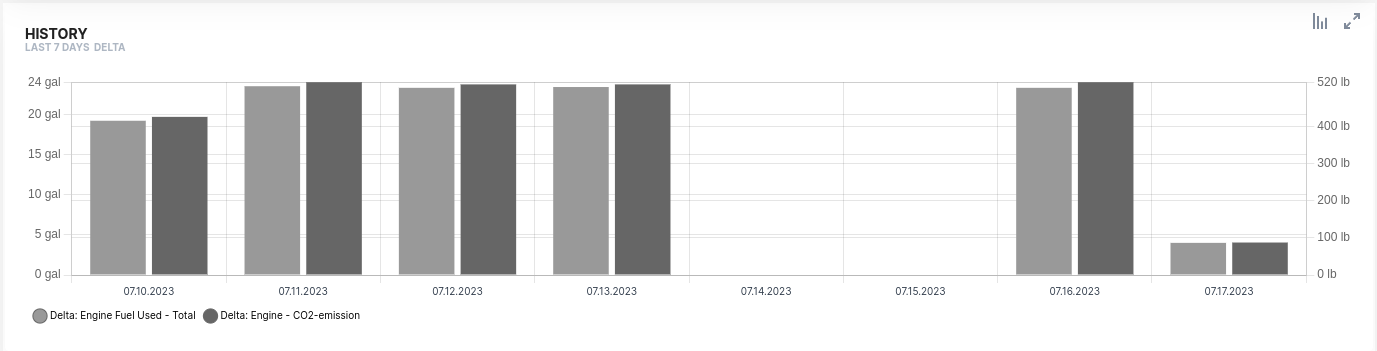
What amount of consumables has been consumed? In this case, how much fuel was consumed each day, and what was the CO2 footprint?
Health Topic
Faults
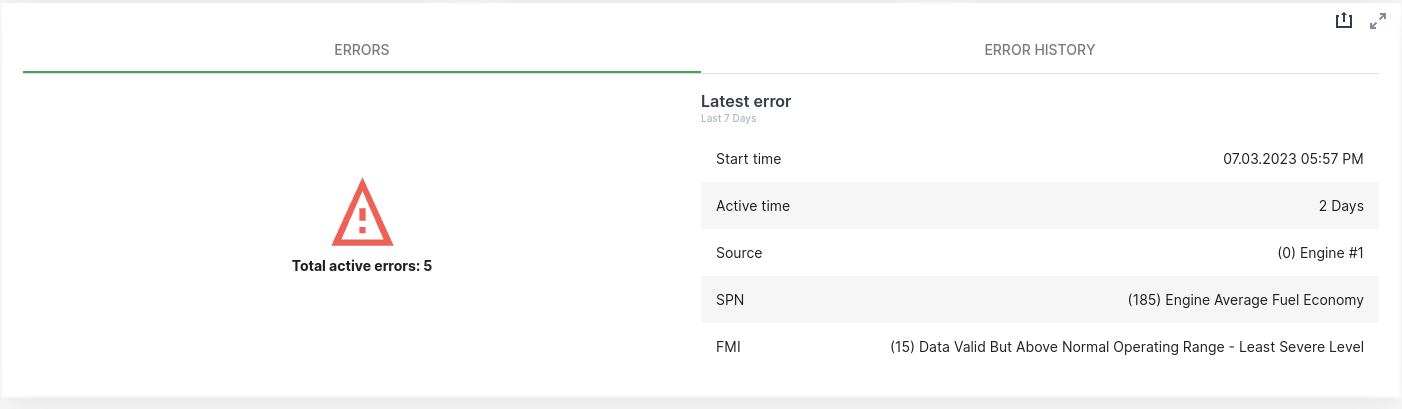
Does the machine have any active problem? Has it had any problem recently?
Maintenance
Where is my machine today? Does it have any scheduled maintenance?
If the maintenance feature is active, the machine master data widget already provides access to the maintenance topic out of the box.
If the maintenance feature isn't in use, consider adding the latest value of a signal representing Hours to next service, or a state signal indicating whether a machine needs maintenance.
Consumables
Is the machine ready for work today?

Operational Safety
The following two examples show how to represent proper machine use within a recommended operating range.
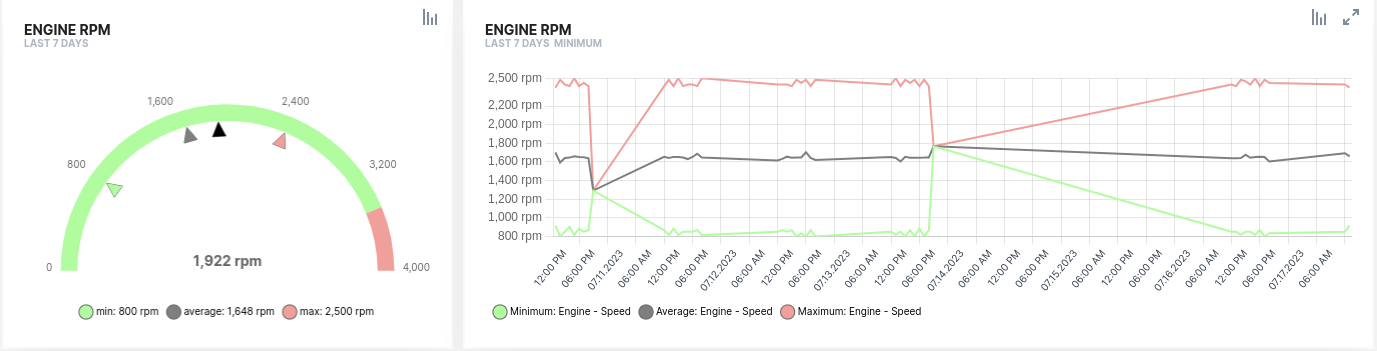
The first example looks at engine speed in revolutions per minute:
- On the left, the maximum, minimum, average, and current values over the last 7 days show whether the machine was operated beyond the recommended threshold at any point.
- On the right, the history of the maximum, minimum, and average values shows, if a violation occurred, whether it happened once or repeatedly, and when.
Is the engine being operated according to the OEM's recommendations?
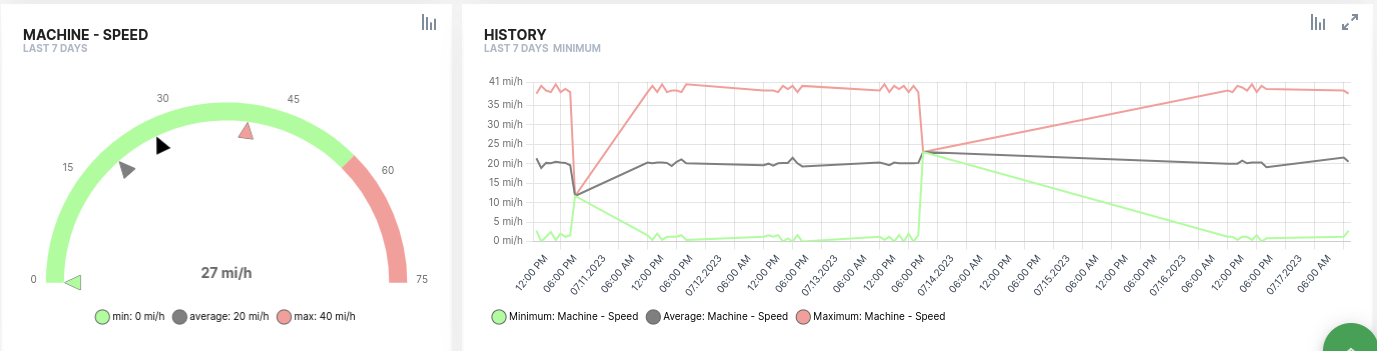
Is my machine driven at speeds within legal and safety recommendations?
The second example applies the same visualization to machine speed data, showing whether the machine was driven at speeds beyond those recommended. This also illustrates reusing a visualization pattern, see Vertically Aligning by Visualization Pattern for the general approach.