Use Colors Consistently
Use a limited palette of colors, and apply it consistently across data visualizations in different widgets, so that users can easily understand what's being represented.
Colors can serve two purposes: identifying signals, or conveying meaning.
Identify Signals
Displaying a signal with the same color every time makes it easy to identify in different data visualizations. This approach has a drawback: as the number of signals displayed grows, so does the number of colors needed, which can result in a palette too large to tell one color from another.
Convey Meaning
Color can also add semantics to a data visualization, the same way traffic lights use red, green, and yellow to express stop, move on, and a transition between the two.
Approach 1: "Health"
Use a small set of colors, such as green, red, and grey, to express a healthy, unhealthy, or neutral situation respectively.

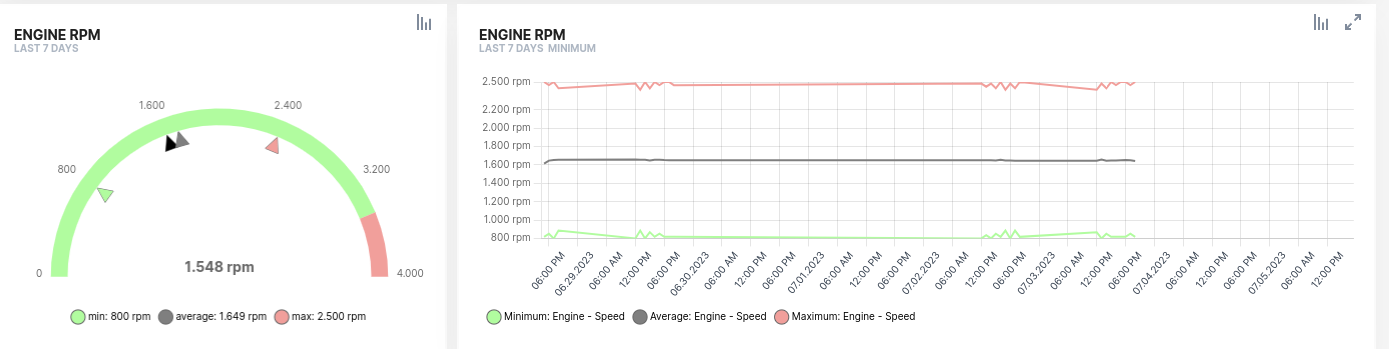
Approach 2: "Maximum, Minimum, and Average"
Use the same green, red, and grey palette to express minimum, maximum, average, and current values respectively.
Approach 3: "Current Value"
Use a high-contrast color, such as black, to represent the current value.
The semantics of colors can change between approach 1 and approach 2 and still be understood from context. If mixing them isn't convenient for your case, use different shades of red, green, and grey for health versus maximum/minimum/average values.
Conveying meaning through color is the recommended approach, since it's more expressive and keeps the number of colors used limited, making the information easier to read.