Basic Configuration - DataPlatform
Introduction
This chapter explains how the Proemion DataPlatform must be configured to correctly interpret, decode, and display the downsampled and logged CAN data received from the TCU.
You will learn how to define signals in the Signal Catalog, configure binary data parsing using a PDC, and assign the configuration to a machine so that logged CAN data becomes visible in the DataPortal.
DataPlatform Configuration
Before we can start sending messages to the CAN bus and expect to see anything on the DataPortal, the DataPlatform needs to know what to do when it receives binary data from the TCU.
To set this up, first a signal needs to be added to the Signal Catalog and a parsing definition needs to be set in the PDC.
Note
Proemion is currently in the process of transitioning PDC functionary into the Signal Catalog, but for now the binary TCU data interpretation definition is a little fragmented.
Signal Catalog
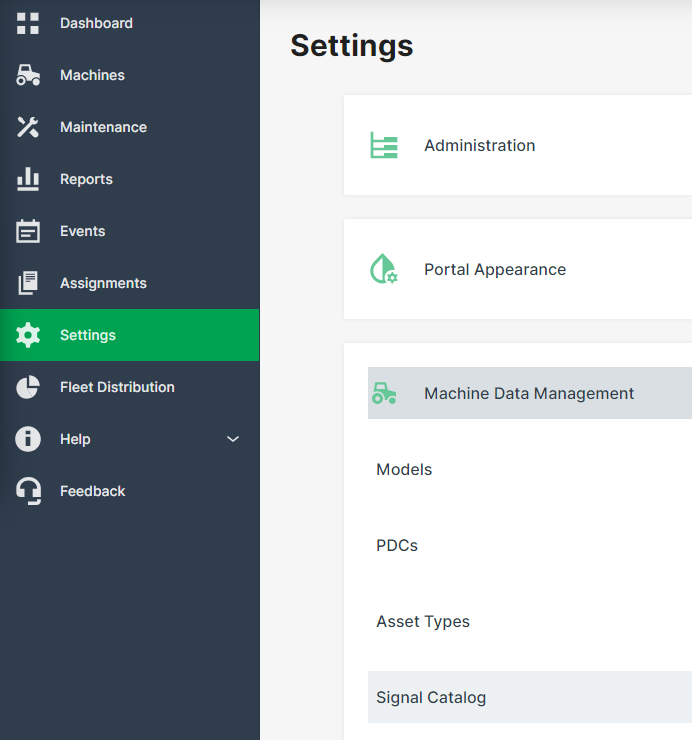
Open the Signal Catalog.
https://dataportal.proemion.com > Settings > Machine Data Management > Signal Catalog
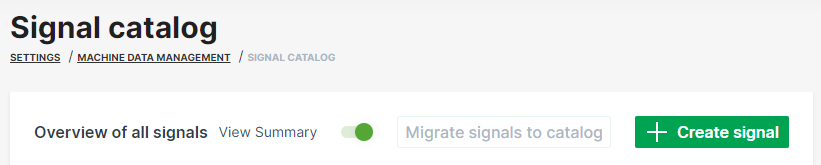
Create signal adds a new signal to the DataPlatform.
In the Declaration page, set Metric Type=Standard and Signal Key=value.common.engine.fuel.level.
In the Data page, set Decimal Places=0, Min Value=0, Max Value=100, and leave the Logical Type=Measurement unchanged.
In the Label page, set English Signal Label=Fuel Level and Create the signal.
PDC
Note
The functionality available in the PDC file is gradually being transitioned to the Signal Catalog. Until this transition is complete, the DataPlatform configuration is split between the Signal Catalog and the PDC.
For this example, we have prepared the required PDC, which you need to download from the link below, and upload it to the DataPlatform.
Cyclic_Input_Downsampling_and_Logging.pdc
But before we upload it, let's take a look at some elements that it is important to understand how they function.
PDC Identifiers
Each PDC is uniquely identified in the DataPlatform by its uuid and customerVersion attributes. The PDC Name and Description are there only to make it easier for us humans to find what we are looking for.
The uuid must remain the same, while the customerVersion must be incremented with every new PDC revision.
Note
The Name and Description attributes can be changed between versions as long as the uuid remains unaltered.
<!-- uuid4 and semver versioning -->
<DataConfig uuid="47037538-d99c-4d94-ae8b-fc89e33acb4c" customerVersion="0.1.0" ... >

  <!-- PDC Name -->
  <Name xsi:type="MessageDefinition">
    <Label lang="en" value="Proemion Global Telematics Configuration Guide"/>
  </Name>

  <!-- PDC Description -->
  <Description xsi:type="MessageDefinition">
    <Label lang="en" value="Downsampled Signal Logging"/>
  </Description>

  ...
Parsing Definition
Go back to the Signal Catalog and take note of the Signal Key. This is the link between signals and the PDC.
The parsing definition tells the DataPlatform how to read the binary data and assign it to signals.
Note
The value definition has now been fully migrated to the DataPlatform's Signal Catalog.
For convenience, below are the relevant signal elements we will be configuring in the DOD.
| ELEMENT | VALUE |
|---|---|
| ACRONYM | fuel_level |
| INTERFACE | CAN1 |
| FORMAT | STANDARD_11_BIT |
| CAN ID | 0x200 |
| START BIT | 0 |
| BIT-LENGTH | 8 |
| DATA TYPE | UNSIGNED_INT |
| SCALING | None |
| OFFSET | None |
  ...

  <ValueDefinitions>
    <ValueDefinition key="value.common.engine.fuel.level" managedByDataPlatform="true"/>
  </ValueDefinitions>

  <ParsingDefinition>

    <!-- INTERFACE: src="CAN" channel="1" -->
    <BinaryStreamDefinition src="CAN" channel="1">

      <!-- CAN ID: canId="0x200" -->
      <!-- FORMAT: canIdLength="11" -->
      <CanMessage canId="0x200" canIdLength="11" mask="0x7FF" protocolStyle="GENERIC">
        <Values>

          <!-- START BIT: startPos="0" -->
          <!-- BIT-LENGTH: length="8" -->
          <!-- BYTE ORDER: endianness="LITTLE" -->
          <!-- DATA TYPE: signed="false" -->
          <IntValue startPos="0" length="8" endianness="LITTLE" signed="false" continueOnLastPostion="false">

            <!-- signal catalog reference -->
            <valueDefinition ref="value.common.engine.fuel.level"/>

          </IntValue>
        </Values>
      </CanMessage>
    </BinaryStreamDefinition>
  </ParsingDefinition>

  ...
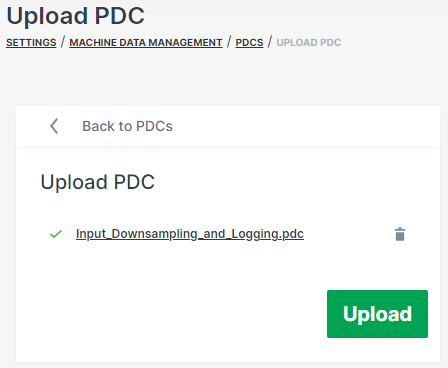
Upload PDC
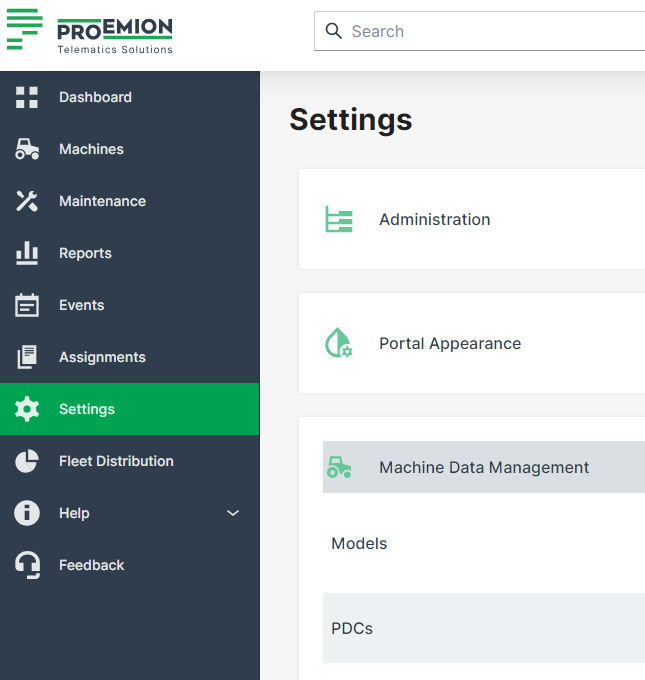
Go to PDC management.
Settings > Machine Data Management > PDCs
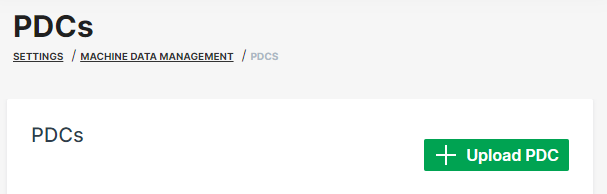
Clicking on Upload PDC and following the prompts results in the PDC being validated before executing the final Upload instruction.
Assign PDC to Machine
The PDC is now available on the DataPlatform, but there is no binding between the machine and the PDC. We will follow the bench test workflow by assigning the PDC directly to the machine (PCAN-USB in our case).
Machines > click on the machine to view its page > MANAGE MACHINE > Properties > PDC > Name > Version > UPDATE
Info
If this was a production project, we would probably want to assign the PDC to multiple machines with a single operation. This is normally done by assigning to all machines of a particular model.
We are now ready to send the first test data!
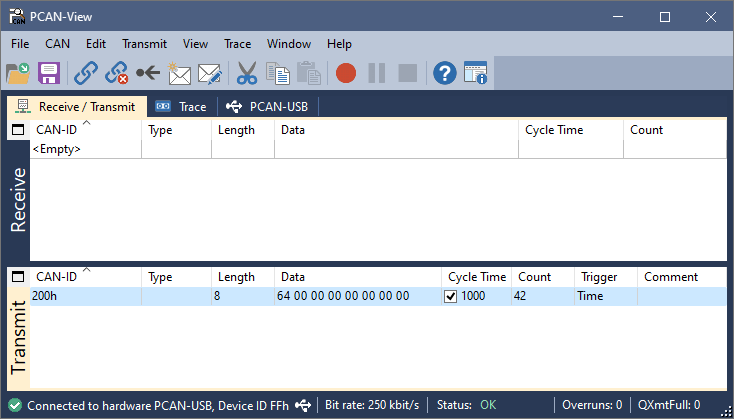
Send CAN Data
We will use PCAN-View to send some test data, initially by setting fuel_level to 100%.
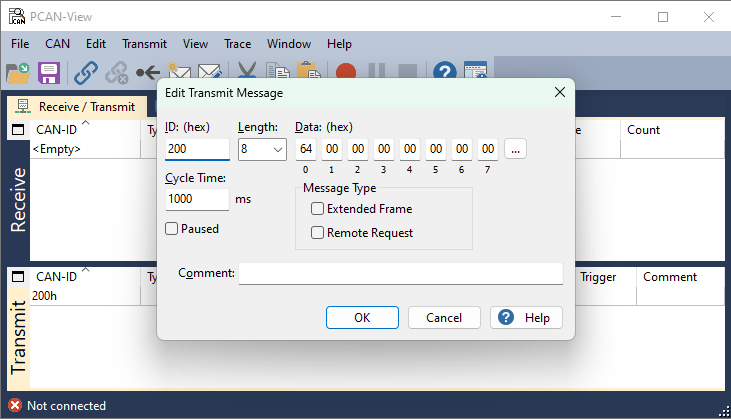
Feel free to test sending different values, but remember, since the downsampling cycle time is 1 minute, make value changes at least 1 minute apart in order to see the value on the DataPortal.
Expedite Data Transmission
We would normally expect to see some data on the DataPortal after a minute or so, but actually nothing seems to be appearing on the machine page yet.
This is due to how the CANlink® mobile packs up the data before sending it to the DataPlatform, which we have not optimized yet.
The details of this sending-data-to-the-DataPlatform logic will be explained in a later chapter. For now, we will simply force the CANlink® mobile to send all pending data immediately by setting Logging - Send File Command=1 using the Write to device button.
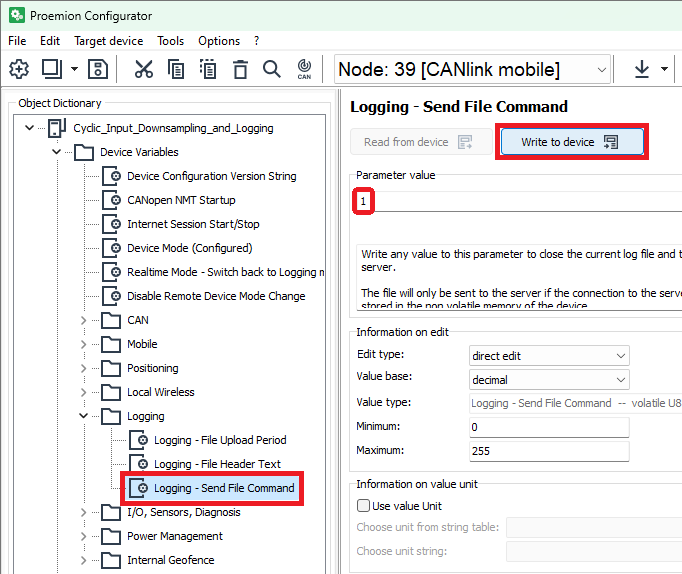
Info
Data pending transmission is saved in log files, hence the name Send File Command.
View Machine Data
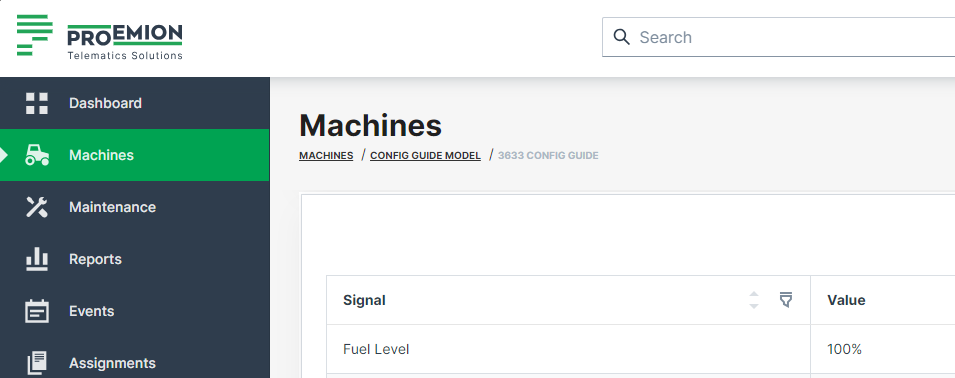
The machine page on the DataPortal should show the Fuel Level at 100%.
Note
It takes several seconds for the machine data to be available on the DataPlatform after the TCU has transmitted it. This processing latency can be tracked on the DataPlatform Status monitoring page.
When the machine page is loaded, a request is sent to the DataPlatform for the latest data, the appropriate response is received, and the machine page renders the received data.
While viewing the machine page, the DataPortal does not automatically make any further requests for the latest data.
To instruct the DataPortal to periodically request the latest machine data, the REFRESH function needs to be activated.

Troubleshooting
If something is not working as expected:
- Ensure the correct test Tx data is set on PCAN-View.
- Cross check the DOD: Cyclic_Input_Downsampling_and_Logging.dod