https://docs.proemion.com/docs/datascience/
Introduction
Proemion develops DataScience features that can help organizations to gain added value from the machines' data.
This enables organizations to make better decisions based on the insights into the fleet and customer behaviour.
The DataScience Manual describes the use cases of the features, how to configure the standard metrics and other signals in the PDC for those features and how to activate and use them in the DataPortal.
Feature Description
The Counter Guard feature is based on the predefined signal Counter, see Proemion Standard Metrics, that is used by the DataPortal.
In the DataPortal, the Counter Guard detects inconsistencies events in the counter signal data.
As an example, this is relevant for the following features listed below (see DataPortal User Manual):
- Cluster Heat Map, Counter, Gauge widgets, see Widget Catalog.
-
Maintenance Tasks
-
Machine Actions
-
Assignments reporting tool
The Counter Guard feature is an included DataPortal feature.
Use Cases
Signals defined as counter can be calculated in order to analyze their usage/consumption/operation over time.
The Counter Guard can be also used by OEMs to check for inconsistencies in the data sent by machines, i.e.to have a continuous counter e.g.in case of erroneous resets by the machines.
By applying patches to the machine controllers, they will then get clean data which is a precondition to use it for other DataScience applications and features.
Thereby, the Counter Guard can be a basis for other DataScience features.
The Counter Guard consists of two sub-features for detecting issues with counters, these are:
Counter Violation Detection
The Counter Violation Detection sub feature detects counter violation events in machine counters.
A counter violation is a period in the time series in which the signal behaved suspicious.
This is done by checking the monotonicity of the time series.
The monotonicity is interrupted by peaks (change of counter direction), therefore Counter Guard checks if peaks occurred in the given time series.
For each peak group a counter violation event is created, it includes a snippet of the time series in which the suspicious behavior was observed.
Note
The approach detects peaks independent of the counters context and direction.
This excludes the solution from detecting contextual outliers.
Warning
Counter resets (intended or not) will be considered as counter violation.
Note that signals can be ignored, see Configuration.
Invalid Increase Detection
The Invalid Increase Detection sub feature detects invalid increase events on increasing hour based counters (e.g.operating hours counter).
An invalid increase is a period in the time series in which more hours were logged than time has passed.
This is done by dividing the time series into sessions of work and comparing the sum of the deltas of time passed in hours to the sum of the deltas of hours logged within a session.
For each session, where the sum of hours logged exceeds the sum of time passed by more than the hours time exceedance threshold, an event is created.
A session is defined by the time passed between logs in hours.
If this delta between two data points is greater than the minimum session distance the machine is considered to have a break in operation and therefore the session has ended.
A session needs to have the minimum session data points to be eligible for invalid increase detection.
By using the sum of deltas of the hours logged, the solution is resistant against resets and spikes (e.g.caused by unintended machine start/stop behavior) as long as the value returns to its pre-error value.
Those cases are already covered by the Counter Violation Detection.
Activation
In the DataPortal, you can activate the Counter Guard feature via the Feature Switch, see Feature Switch.
You can then view the events/notifications in the DataPortal via Event Functionality.
Configuration
The Counter Guard is a built-in system function, see Counter Guard Signals.
No special metrics need to be transferred to use this function.
Signals to be checked for monotonicity must be defined as category xsi:type="Counter" in the PDC Value Definition.
Note
By default, SIM traffic is ignored (for more information on the signal key, see Proemion Standard Metrics → "Proemion System Metrics").
Note that other signals can be ignored, too.
To implement this, contact your Proemion representative.
Feature Description
Fuel Guard detects fuel refill and loss as well as DEF/AdBlue fuel events.
An alarm is sent to the DataPortal when one of these events occurs.
This functionality differentiates between normal fuel consumption patterns and abnormalities (possibly labelled as tank leak or theft for example).
A DataPortal event essentially informs you about such events in the interest of further investigation.
The Fuel Guard feature is a paid DataPortal feature, see also Activation.
Use Cases
The Fuel Guard feature detects four different types of fuel events.
They are Fuel Refill (Refuel), DEF/AdBlue Refill, and Fuel Loss, and DEF Loss events.
These event types provide insights into the fuel supply for the fleet of machines.
The Refill event happens when someone fills up a machine with Fuel (Refuel event) or AdBlue (DEF/AdBlue Refill event).
These events are displayed in the Events menu of the DataPortal, see also DataPortal User Manual → "Event Functionality".
DEF/AdBlue Refill Event Detection
The DEF/AdBlue Refill event detection detects rapidly changing (positive changes) in the fuel level data.
Fuel Loss Event Detection
The Fuel Loss event detection works like the inverse function of the Refill event detection.
That might be a tank leak or even theft.
It detects decreasing rapid changes in the fuel level data.
Activation
In the DataPortal, you can activate the Fuel Guard feature via the Feature Switch, see Feature Switch.
Note
To enable the Fuel Guard feature, it must be ordered beforehand.
To do so, contact your Proemion representative.
After activating the Fuel Guard feature, the fuel events are going to be listed in the Events section from the next day on, see Event Functionality.
Configuration
To receive the following Fuel Guard events, your machine needs to deliver the following signals.
These need to be configured in the PDC.
-
Define the signals as described in the following table within the PDC, see PDC Manual → "ValueDefinition".
Consider that signals that are required for a certain function should be recorded at the same time.Signal Signal Key Fuel Level value.common.engine.fuel.levelDEF/AdBlue Level value.common.engine.def.levelFuel Consumption Total (to determine "Fuel Loss" and "DEF/AdBlue Loss") value.common.engine.fuel.used.total -
The following events can be then obtained via the REST API, see Events, to be shown in the DataPortal.
Warning
The system uses buckets of 5 min and there must be a minimum of 20 buckets with data of the required signals each day - The minimum data points of
20are required for a daily run.
It is recommended to record the data every 5 min (180000 ms).
The logging interval should NOT be greater than or equal to 10 minutes (360000 ms).
Otherwise, the detection does not work properly.Parameter Values Additional Information Event keys for Historical Weather Data Fuel Refill (Refuel) - event.common.consumables.fuel.refillDEF/AdBlue Refill - event.common.consumables.def.refillFuel Loss - event.common.consumables.fuel.lossDEF Loss - event.common.consumables.def.lossIgnore machines name : ["Test", "Demo"]cu.name : ["missing"]model.name : ["missing", "Default"]Can be used to exclude machines from being visible for other users. Bucket size e.g.180000 ms 5 minutes
Feature Description
The DataScience feature Geo Presence Report focuses on the analysis of machines data in a given time frame and area, that is, performing analysis such as "Total Operating Hours" and "Fuel Consumption" on the identified machines.
Use Cases
Based on the defined geo area, reports can be created that show which machines are in the defined area and for how long.
A geo area can be e.g.a construction site in the form of a polygon, rectangle or circle.
The analysis supports customers in understanding (i.e. besides the regular invoices/paperwork) how the machines have been used in one or many construction sites.
Activation
The final product is the Geo Presence report in an Excel format that encompasses the sub-reports described in Analysis / Sub-Reports.
The report is sent via email.
To automatically generate the Geo Presence report, proceed as follows:
- Activate the Geo Areas feature, see Add Geo Areas.
- Set the organization properties like EMAIL and FREQUENCY, see Configuration parameters.
The script that generates the report runs on a daily basis at around 4 AM UTC.
Configuration
The geo areas are maintained via the REST API.
Proemion can set up a REST API endpoint for your organization and provide you the according documentation.
The parameters to be configured to fetch time series data are the following.
Note
The bucket size is automatically adjusted according to the Frequency property.
If it is below 7 days, the script pulls data using a bucket size of 2 minutes, otherwise 10 minutes.
| Parameter | Values | Additional Information |
|---|---|---|
| feature.geo.key | feature.section.namedGeoAreas | |
| isTenant | True | |
| email (Org. Property) | property.custom.geo.report.email | Report receiver |
| frequency (Org. Property) | property.custom.geo.report.frequency.days | Time-range of the report / last number of days |
| last.issued (Org. Property) | property.custom.geo.report.last.issued | When the last report was issued |
| Signals | - value.common.machine.hours.operation.total | Standard metrics |
| - value.common.engine.fuel.used.total | ||
| Aggregation | delta | Applied to both signals. |
| filter.skip.last.issued | False | Disable skip last issued filter |
| default.missing.value | 0 | Fill missing values with Zero |
| "Dear customer, \<br>\<br> | English language | |
| Your Geo Presence Report for the duration of <b>{{ frequency }}</b> days | ||
| has been successfully completed and is attached in the Annex.<br><br> | ||
| This is an automatically generated email. | ||
| If you have any questions, please reach out | ||
| to your contact person.<br><br>" |
Create a Geo Presence Report
Add Geo Areas
In order to get the Geo Presence Report, you must add its Geo Areas using the Geo Areas UI in the DataPortal, see Geo Areas.
The script automatically reads the Geo Areas and processes the data.
You must provide the following beforehand:
- E-mail: the report is sent to the email that is informed by the customer.
- Frequency: Number of days to process the data, that is, Proemion generates the report based on the last n-days activity.
Detect Machine Presence
In order to detect machine presence in a given construction site and time frame, the Geo Areas along with a time frame have to be passed as parameters to the REST API that returns a list of machines within the given area and time frame.
Analysis / Sub-Reports
After identifying all machines within an area and time frame, Proemion then performs the following analysis:
- Total/Average Duration of the machine(s).
- Total Operating Hours in the area/time.
- Total Fuel Consumption in the area/time.
- The number of Geo Data Points.
-
The number of Daily Time-Series Data Points (i.e.only for Daily Breakdown).
The analysis consists of four parts that are described as follows: -
Summary Geolocation: summarizes all the aforementioned analyses per construction site.
- Presences - Activity per Site: shows all machine activities, that is, the same machine might have many activities on the same construction site, but on different days.
- Presences - Total per Machine: machine presence is summarized for the whole time frame.
Proemion see only one instance of a machine.
Feature Description
Warning
As of June 1st, 2025, this service has been temporarily deprecated. Activating the feature switch alone is no longer sufficient to enable the feature for your organization. If you're interested in accessing this feature, please contact our Sales Team to explore options.
The weather importer can support you by providing historical weather information of a machine that faces a problem that might be related to the weather conditions.
After activating the Historical Weather Data feature, the historical weather information is persisted.
Use Cases
Machines can operate under different weather conditions.
Weather conditions might have an impact on the operability of a machine and the quality of the work result of the machine.
When the Historical Weather Data feature is active it will create a history timeseries of weather data which can be used for later analysis.
In case a machine did not deliver sufficient quality in the past, the Historical Weather Data feature can be used to check whether this happened due to the weather conditions at that time.
Activation
In the DataPortal, you can activate the Historical Weather Data feature via the Feature Switch, see Feature Switch.
The Historical Weather Data feature is a paid DataPortal feature.
To enable this feature, contact your Proemion representative.
Configuration
The Historical Weather Data works only with the machines that present geolocation data, i.e.the signals are added to the PDC.
-
Define the signals as described in the following table within the PDC, see PDC Manual → "ValueDefinition".
Signal Signal Key Ambient Temperature value.common.system.external.machine.weather.temperatureWind Speed value.common.system.external.machine.weather.windspeedHumidity value.common.system.external.machine.weather.humidityAir Pressure value.common.system.external.machine.weather.airpressureUV-Index value.common.system.external.machine.weather.uv.indexPrecipitation Rate value.common.system.external.machine.weather.precipitationrate -
When the feature has been enabled, a script provided by Proemion will process the signals as defined in the table.
A Geotime filter selects only machines that have sent geo-information in the last five days.
Feature Description
The Model-Based Signals allow you to mark a model to provide model-based signals independently of a specific machine.
This allows users to see Model-Based Signals in the DataPortal and understand the efficiency of each machine-model even without owning a machine of that model.
The metrics are also available via the REST API time series, and can be used to compare a machine's consumption with the model fleet's averages or benchmark own machines with other machines from the same model.
The signals defined by the OEM for a model are managed via the PDC Manual the same as machine signals.
Contact your Proemion representative for more information.
The Model-Based Signals feature is an included DataPortal feature.
Use Case
A sample use case is the analysis of "Fuel Consumption":
The Model-Based Signals measure the performance (i.e.Key Performance Indicator - KPI) of the fuel consumption over time.
An analysis will be performed and a KPI created which focuses on the:
- Lowest (25%) - 25th percentile of fuel consumption.
25% of the machines of this model consume less fuel. - Average - Average fuel consumption of all machines of this model.
- Highest (75%) - 75th percentile of fuel consumption.
75% of the machines of this model consume less fuel.
This data will be pushed back to the DataPlatform and visualized in the DataPortal via the Capacity widget, see Widget Catalog.
To set up this process, define the signals as described in Configuration.
For more information, contact your Proemion representative.
Activation
In the DataPortal, proceed as follows:
- Activate the Model Visibility feature via the Feature Switch.
- You can adapt the model's visibility, see Model-Based Signals Visibility.
- You can additionally change the usage of the model across organizations, see Models Management in the DataPortal Manual.
Configuration
The Model-Based Signals script1 automatically runs once a day and processes data from the previous day.
For the analysis of "Fuel Consumption", proceed as follows:
-
Define the signals and the aggregation function as described in the following table within the PDC, see PDC Manual → "ValueDefinition".
Parameter Values Additional Information Signal keys for operating hours and total fuel consumption2 value.common.machine.hours.operation.totalOperating Hours and Fuel Engine Total value.common.engine.fuel.used.totalboundTo=""modelThe signal keys must be marked with boundTo="model"in the PDC to indicate the signals are provided by the model, see PDC Manual → "ValueDefinition". -
Inform your Proemion representative about the signals to analyze, the aggregation functions and other information as described in the following table.
Parameter Values Additional Information Signal keys for operating hours and total fuel consumption2 value.common.machine.hours.operation.totalOperating Hours and Fuel Engine Total value.common.engine.fuel.used.totalAggregation Delta Both signals Ignore machines name : ["Test", "Demo"]cu.name : ["missing"]model.name : ["missing", "Default"]Can be used to exclude machines from being visible for other users. Bucket size 3600000 ms 1 Hour Selected Models []List of models - Empty means all models -
The defined signals will be populated via the REST API by using the script.
-
The following metrics for each result of the analysis can be then obtained via the REST API, see Measurement of Model-Based Signals.
Name Signal Fuel Consumption lowest 25% value.custom.model.fuel_consumption_25Fuel Consumption average value.custom.model.fuel_consumption_averageFuel Consumption highest 75% value.custom.model.fuel_consumption_75
-
The script can be created together with Proemion based on your input.
Contact your Proemion representative. ↩ -
It is recommended to use the standard keys noted there, see also Proemion Standard Metrics. ↩↩
Feature Description
The Proemion Data Analytics instances are an environment which allow advanced analytics of machine related data.
The environment is a Jupyter Lab instance with a Python environment with relevant libraries preinstalled running on a remotely accessible server.
In addition, the instance provides a library called Prodata which makes all relevant resources of the Proemion DataPlatform available in the instances and does Data Analytics-relevant preprocessing of the data provided by the Proemion DataPlatform.
Find the documentation of the library at Prodata documentation.
In addition to that the instances provide:
- Reports which help to analyze commonly asked questions of machine OEMs.
-
Guides which help to get started to build own custom analyses.
Both the reports and the guides can be used as a starting point for individual analyses helping to answer questions from different stakeholders like Service, R+D, Sales, etc.
Exemplary reports and guides: -
DTC report example: DTCs in relation to number of machines per model:
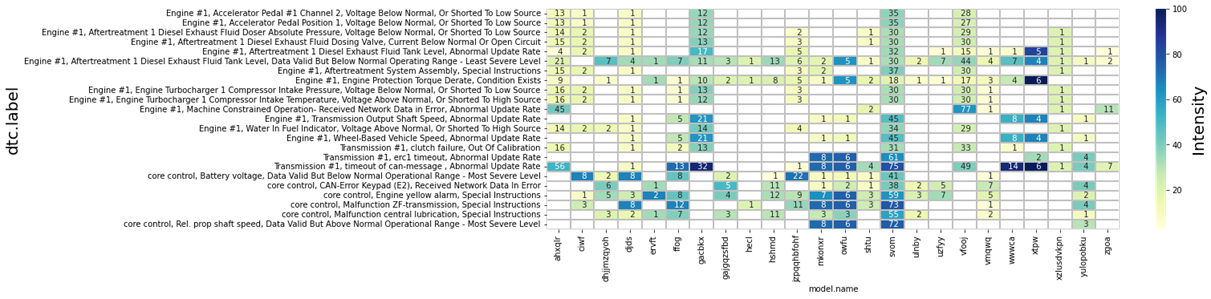
Figure 1: DTC report example: DTCs in relation to number of machines per model -
Fetching timeseries with
Prodata library: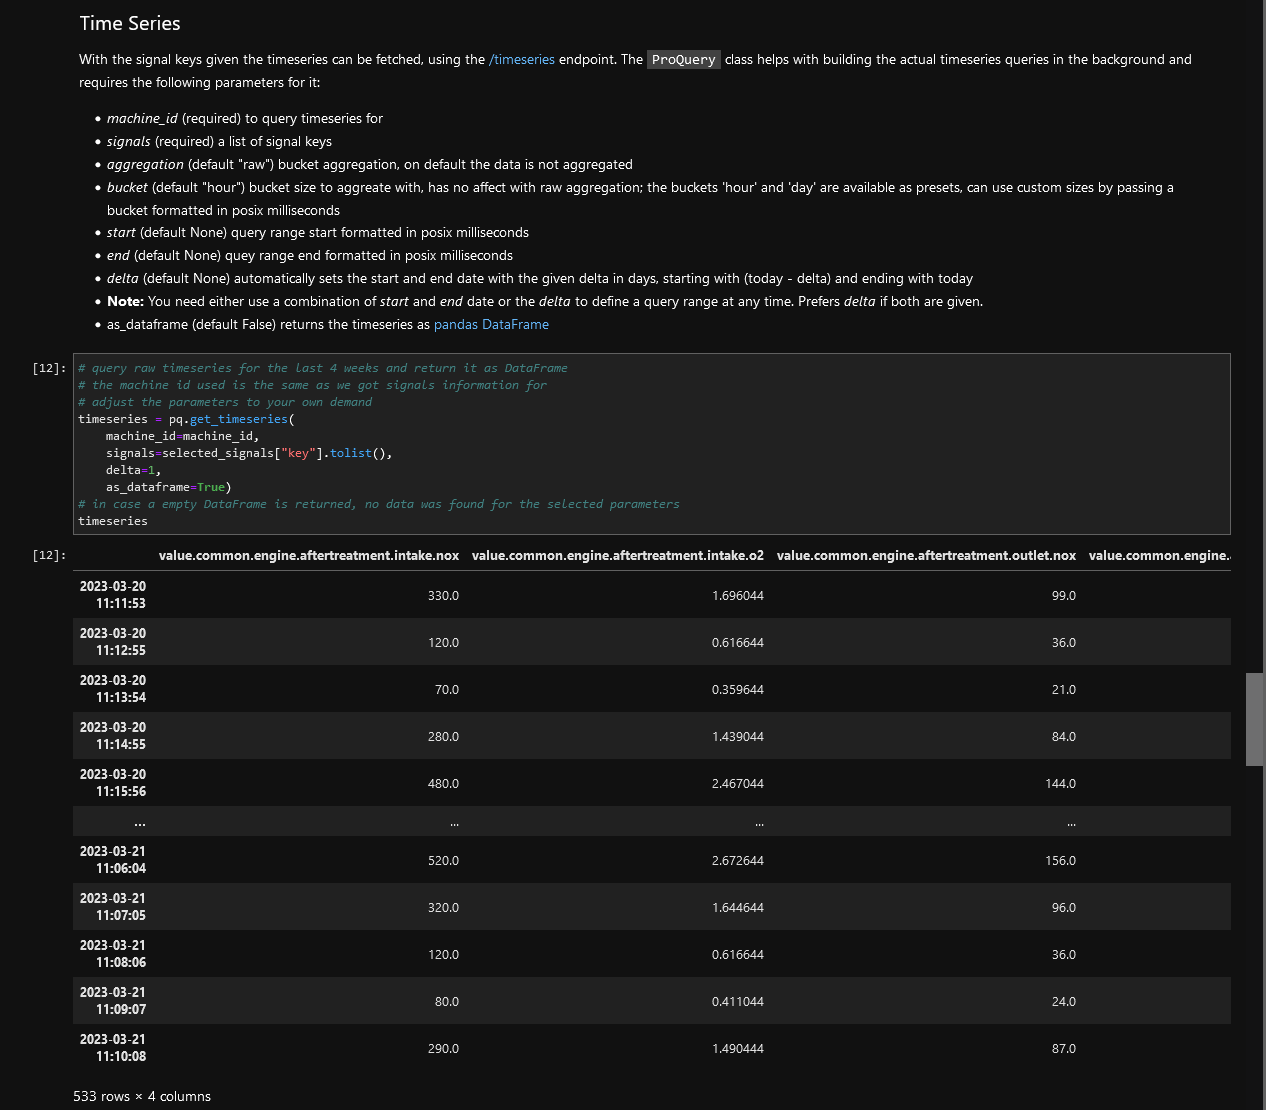
Figure 2: Fetching timeseries with Prodata library -
Sample plot with description from data exploration guide:
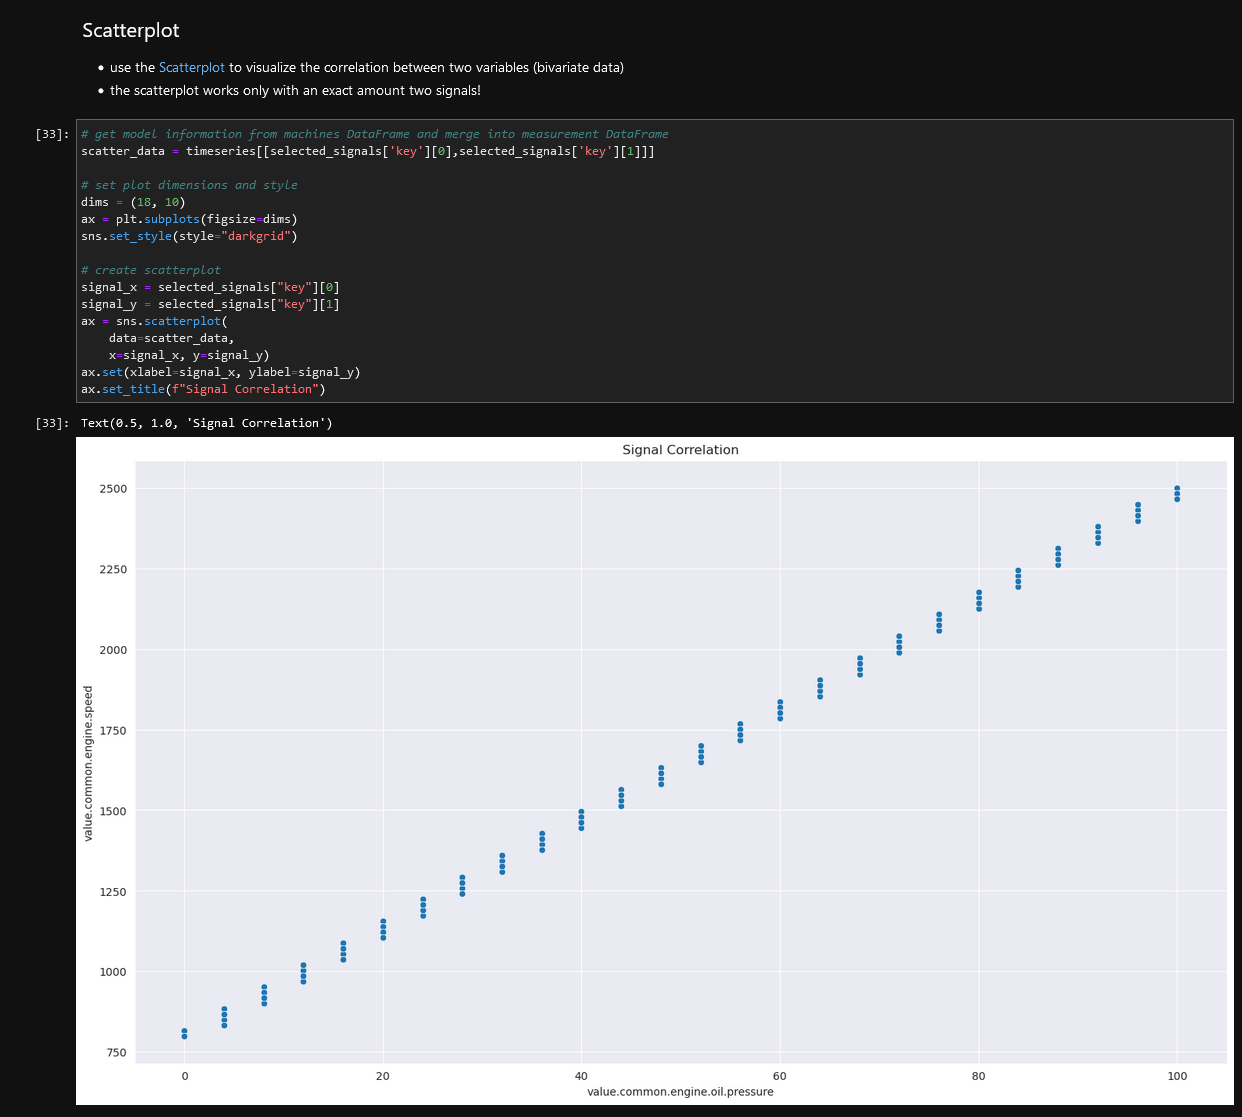
Figure 3: Sample plot with description from data exploration guide
Use Cases
In many cases, this environment which allows individual analysis of telematics data can help to answer questions of different stakeholders of the telematics solution.
Exemplary questions are:
- What is the right engine size for the next generation of a machine model?
- What are usage profiles of the machines (e.g.operating hours, temperatures, etc.)?
- Are there patterns in the data which could explain the root cause for specific machine problems seen in the field?
Activation
The Data Analytics feature is a paid DataPortal feature.
To enable it, it must be ordered beforehand; contact your Proemion representative.
In the DataPortal, you can activate the Data Analytics feature via the Feature Switch, see Feature Switch.
Configuration
The Data Analytics instances are accessible via the DataPortal.
For detailed information on how to access the instance, read Data Analytics in the DataPortal documentation.
A Data Analytics instance is available indefinitely but has to be restarted after 2 hours of inactivity.
All your data you have been uploading to your instance is available everytime you request a new instance.
The instance must be bound to your organization unit.
To implement this and the DataPortal access, contact your Proemion representative.
Service and Support
The latest versions of the drivers, software, firmware, and documentation are available at Document Library.
Do you need help or want to report a bug?
Visit Proemion for more information, or raise a ticket via Support.
Firmware Updates and Support
To ensure the best performance and security of your devices, we strongly recommend always installing the latest firmware provided by Proemion.
Please note:
We do not provide technical support for issues caused by outdated firmware.
Errors resulting from outdated firmware are considered non-qualified errors and are not covered by warranty or support.
Regular firmware updates are essential to maintaining the functionality of your devices.
If you need assistance with the update process, please contact our Service and Support.
For more information on the Firmware Update, check the device manual of your device at the Document Library.