The Remote Service Tool is used to display and evaluate machine or vehicle data with a real-time connection to a target device. |
1. Preamble
In the following chapter you find general information on the company and on the device manual.
1.1. Legal Notice
All brands and trademarks named in this document and possibly protected by third-party rights are subject without limitation to the terms of the valid trademark law and intellectual property rights of their respective registered owner.
You can find a list of the free-source and open-source software as well as copyright notes, license texts and, if applicable, the relevant source code on our website under the link: Free & Open Source Software
Observe all local and regional laws and provisions as well as the safety instructions contained in this document.
1.2. Contact
Proemion GmbH
Donaustr. 14
36043 Fulda, Germany
Phone: +49 661 9490-0
Fax: +49 661 9490-111
info@proemion.com
Proemion Corp.
US Subsidiary
241 Taylor St., Suite 301
Dayton, Ohio 45402, USA
Phone: +1 937 558 2211
Fax: +1 937 641 8787
info-dayton@proemion.com
Proemion Ltd.
373 Gangnam-daero Seocho-gu
Seoul, 06621, South Korea
Phone: +82 2 6080 9490
Fax: +82 504 484 9490
info-seoul@proemion.com
Website: Proemion
1.3. About This Manual
This document is part of the product and provides important information on the intended use, safety, installation, and operation of the devices described below. The document is intended for qualified technicians and electricians with advanced knowledge in electrical engineering and field bus systems, allowing them to estimate the risks and hazards of operating the device and to integrate it into systems with components of other manufacturers.
1.3.1. Safety Levels
The safety levels have the following meanings:
|
Severe injury or death. Probability: very high |
|
Severe injury or death. Probability: possible |
|
Slight or medium injury. Probability: possible |
|
Property damage. |
1.3.2. Symbols and formatting
The following symbols and formatting help you recognize the purpose of the
paragraphs:
|
|
|
|
|
|
| Symbol | Description |
|---|---|
|
Application options for the devices described. |
|
Indicates references to other documents, websites, etc. |
|
Description of different types. Data and descriptions that only apply to certain types are either covered in separate chapters or marked with the symbol shown here. |


2. About the software
The Remote Service Tool is used to display and evaluate machine or vehicle data of a target device.
The software can be downloaded from our Download Center.
The main features are:
-
Perform a realtime evaluation of diagnosis data online during operation of the target device
-
Evaluate archived logfiles which have been logged by the Remote Service Tool
| The visual depiction of the machine or vehicle data is based on a DBS configuration file. This file must be created in accordance with the the CAN bus specification of the target machine. |
| The target device must be connected to a communication gateway that receives the machine data on the CAN bus and transfers it to the Remote Service Tool. |
2.1. Warranty and liability
Proemion assumes no liability for defects caused by normal wear, external influence, and errors of installation, operating, or maintenance. This also applies if the customer or third parties modify the devices, any accessories, or the software without the approval of Proemion.
2.2. Service and Support
The latest versions of the drivers, software, firmware, and documentation are available in our Document Library.
Do you need help or want to report a bug?
Visit Proemion for more information, or raise a ticket at Support.
2.2.1. Firmware Updates and Support
|
3. Getting Started
3.1. (SSO) Login
The Remote Service Tool allows to log in with both SSO and username/password.
3.1.1. Default URL
You can set a default URL that will fetch the login information and will be set as the default URL for logging into the Remote Service Tool.
Depending on the user settings, the SSO login and/or the native login with username/password or both will be enabled.
Proceed as follows:
-
In the Remote Service Tool, open Options > Preferences.
-
Add the REST API URL, e.g.
https://dataportal.proemion.com/api/.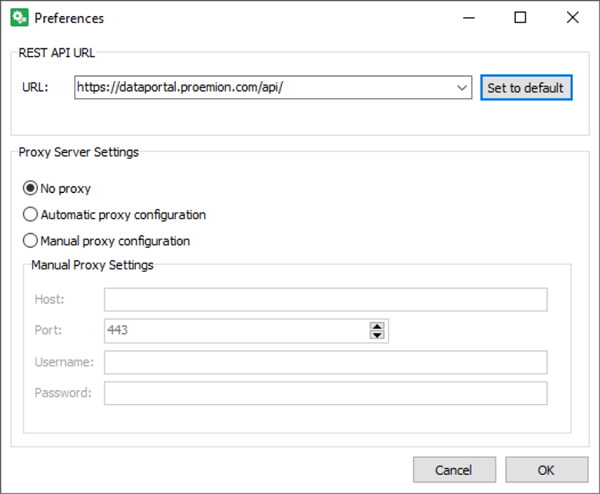 Figure 1. Login URL
 -
Confirm with OK.
To log in, proceed as follows:
-
Open the Remote Service Tool.
-
Click the connection settings icon
 in the toolbar.
The Connections settings dialog window opens.
-
Select Internet in the Communication path field.
The "Internet connection settings" section opens: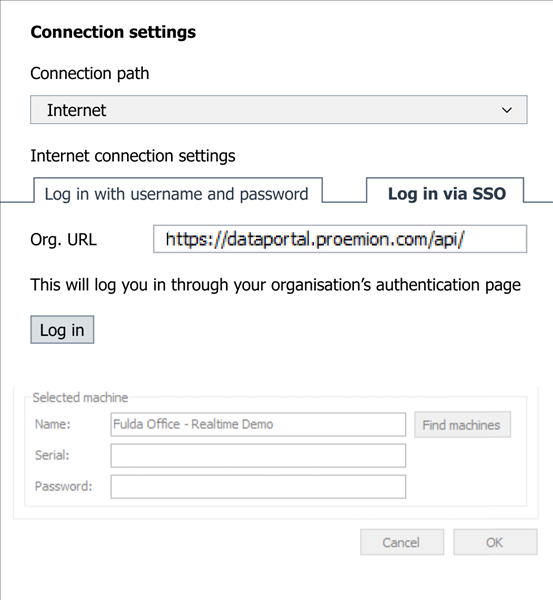 Figure 2. Connections settings
 -
Depending on your settings, you can now choose the following tabs to log in with username/password or to use the SSO-login.
In both cases, you can select the Remember me option to store the login information.-
Log in with username and password: Enter your credentials and click Log In.
-
Log in via SSO: You may change the REST API URL or add it here, if not done yet, see Default URL and click Log In.
This opens the external login mask in the browser where you can enter the SSO credentials.
When the login was successful, it will return to the Remote Service Tool.
-
Now you can start using the Find machines option in this dialog or other features within the Remote Service Tool.
To log out from both the Remote Service Tool or SSO, proceed as follows:
-
Open the connection settings icon
in the toolbar. -
Select Internet in the Communication path field.
-
Choose the tab that you used for logging in.
-
Click the Log Out button and confirm again in the dialog.
You have successfully logged out.
3.2. Create Remote Service Tool Configuration for PGN 61444 SPN 190
The following chapters describe the first steps required for the visual representation of a machine value. It also contains useful information on configuring and establishing a connection with a telematics unit.
The following example describes the necessary steps for displaying the engine speed, SPN 190 of PGN 61444 with priority 0x6 and source address 0x00 according to the J1939-71 standard. So this description is based on the assumption that a 29 bit CAN message with the CAN identifier 0x18F00400 is present at the connected CAN bus and is transmitting the current engine speed.
| In case that there is already an existing Remote Service Tool configuration with the corresponding settings available, you can directly start with Device Connection and Visualization of PGN 61444 SPN 190. |
-
Make sure that the latest version of the Remote Service Tool from the Download Center is installed on your pc.
-
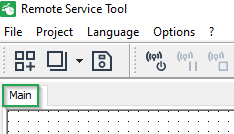
Start the Remote Service Tool software.
✓ The software is started with a blank project.
-
Make sure that in menu Project → Edit mode enabled (Ctrl+E) is active.
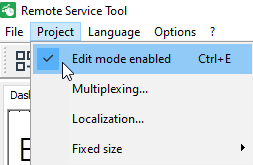
-
Right mouse click in the Main tab.
-
Click on Add element.
-
Select Gauge from the available elements.
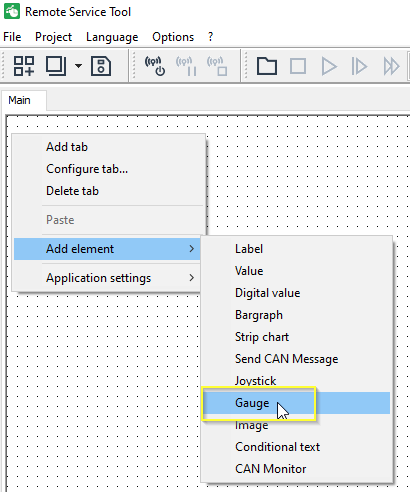
✓ The Gauge element is added to the main tab of your Remote Service Tool configuration.
-
Right click on the new gauge element and click on configure.
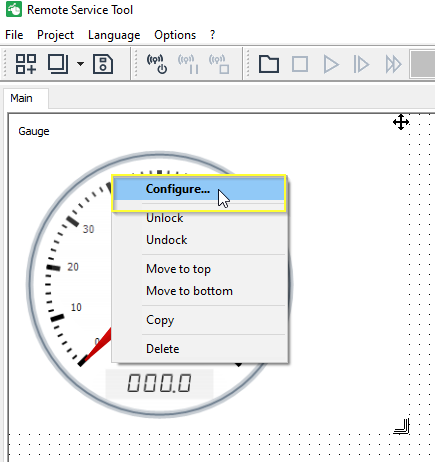
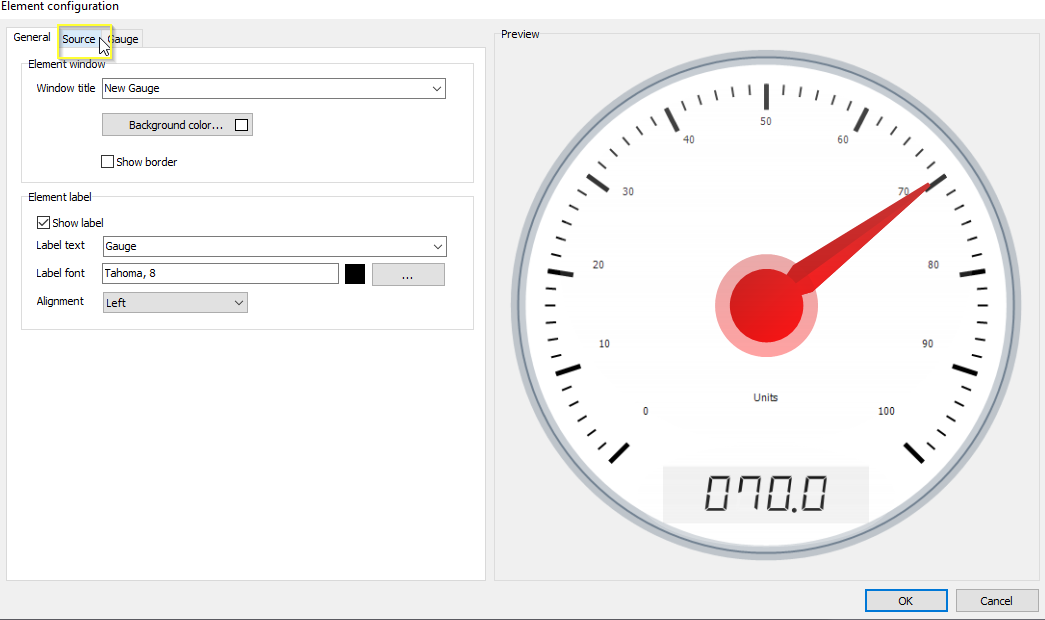
✓ The configuration dialog for the gauge element is opened.
-
Click on Source.
-
Configure the gauge element according to the following table.
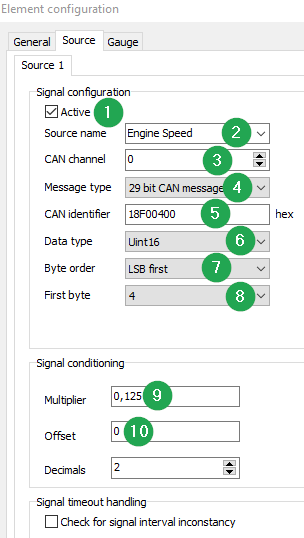
# Item Setting 1
Active
Enabled.
2
Source name
Enter
Engine Speed.3
CAN channel
Select
0for CAN1 (1= CAN2)4
Message type
Select
29 bit CAN message.5
CAN identifier
Enter
18F00400for PGN 61444 with priority 0x6 and source address 0x006
Data type
Uint167
Byte order
LSB first8
First byte
49
Multiplier
0,12510
Offset
0 -
Click on Gauge within the Element configuration dialog.
-
Enter a Maximum value of
10000.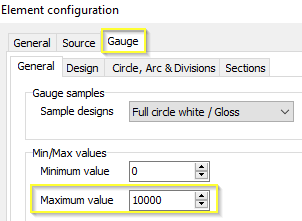
-
Click on Ok.
-
Click on the filter settings icon
 .
. -
Select Auto filter (global).
The work steps 13 and 14 are typically done when the configuration of the widgets is completed. So please just make sure that the Auto filter global is enabled once the Remote Service Tool configuration is finished. The required filter masks will be calculated then. 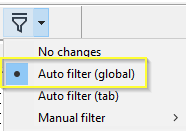
-
Press Ctrl+E to disable the Project - Edit mode.
✓ The gauge element and the required filter is configured.
In case that the correct CAN identifier is unknown, alternatively you can add a CAN Monitor element and create a CAN trace to get the right priority and source address for the PGN 61444. Please refer to chapter Create CAN Trace with CAN Monitor. -
Click on Save (Ctrl+S) to save the configuration as *.dbs file for further tests.
3.3. Device Connection and Visualization of PGN 61444 SPN 190
-
Make sure that the latest version of the Remote Service Tool from the Download Center is installed on your pc.
-
Start the Remote Service Tool software.
✓ The software is started with a blank project.
-
Click on File → Open (Ctrl+O).
-
Open the Remote Service Tool configuration file (*.dbs) with the settings as described in chapter Create Remote Service Tool Configuration for PGN 61444 SPN 190.
-
Click on the connection settings icon
. -
Select communication path Internet.
In this example a connection to a CANlink® mobile is shown. This procedure can be adapted to other communication gateways in the same manner. When establishing a connection to a local CAN-PC gateway, the Find machines work steps are not applicable. -
Enter the login credentials from your DataPlatform user.
Ensure that the user account has the required Feature Switch, permission sets and machines assigned. -
Click on Find machines.
-
Select the corresponding machine.
-
Click OK.
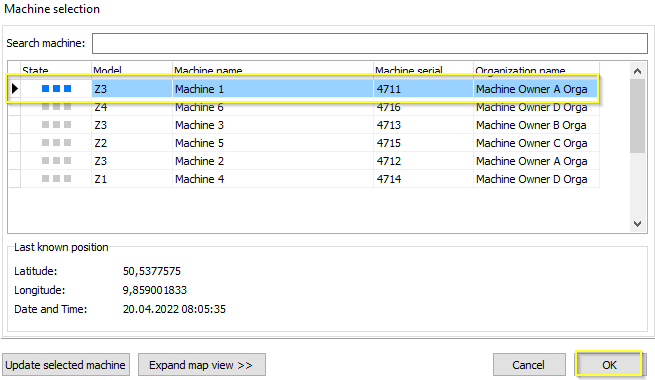
✓ The connection is being established and the CAN receive filter is written to the device.
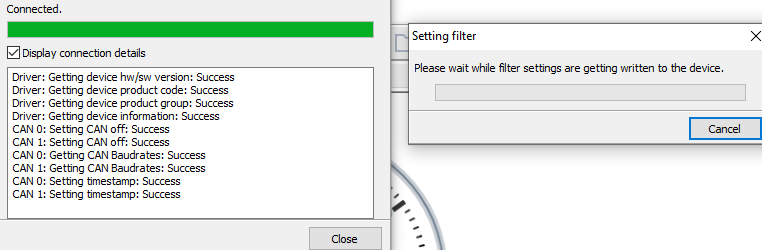
+
NOTE: In case of connection problems, please refer to chapter Connectivity Check. -
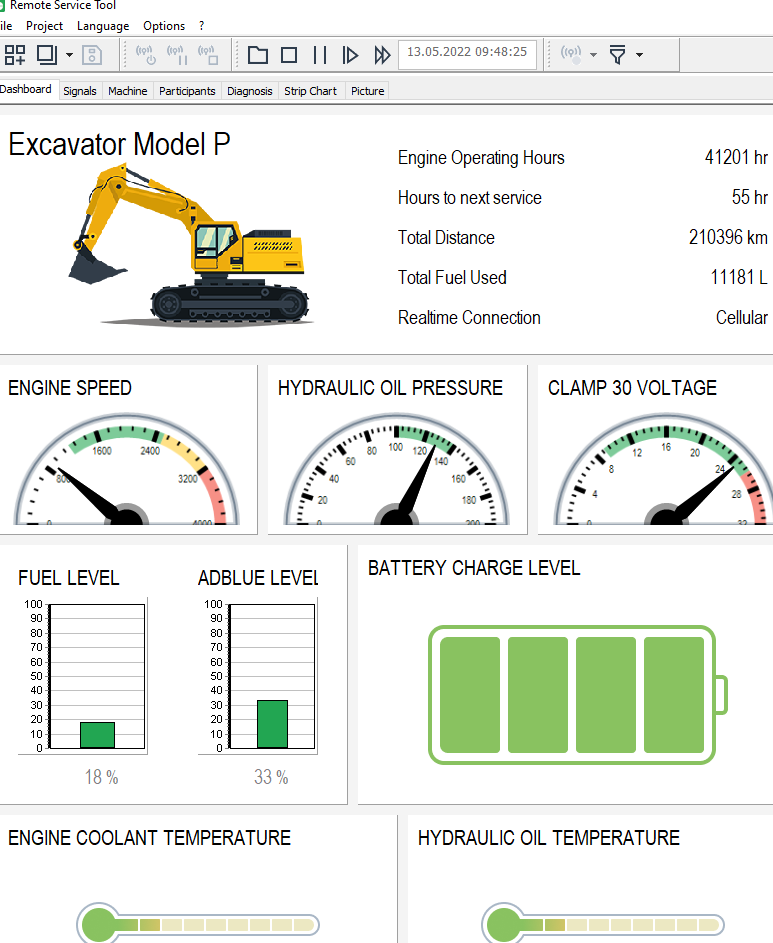
Observe the pointer needle of the gauge element.
✓ The current engine speed of the connected vehicle is displayed by the gauge element.
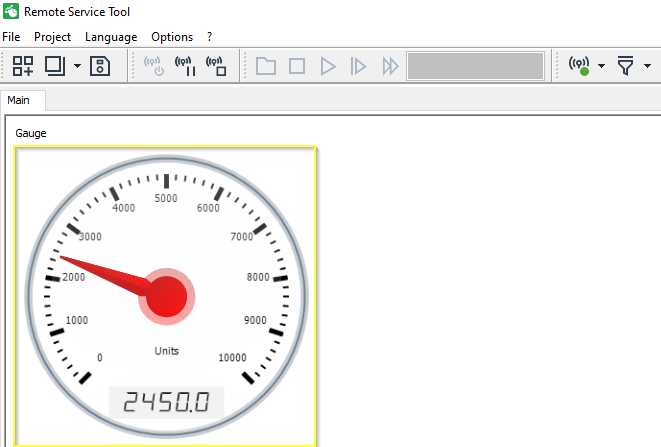
| The labels and the appearance of the gauge element can be further customized according to description in chapter Dashboard Elements. |
4. How to …
| In order to use the complete functionality of the Remote Service Tool, you have to download and install the latest version from our Download Center to your local PC. |
4.1. Use the DBS File as a Project Database
You can use Remote Service Tool to create and open the DBS file. The DBS file contains:
-
The graphic description of the display of machine and vehicle data
-
The description of machine and vehicle data available on the CAN bus of the target device
Remote Service Tool creates the DBS file in XML format, then the file can be saved to a computer hard drive.
The storage formats are:
-
XML; open format with larger file size
-
Vendor-defined, compressed binary format with smaller file size
Remote Service Tool can only open one DBS file at a time.
You can copy project parts from one DBS file to another by opening two instances of Remote Service Tool and copying the data you want using the Windows® clipboard.
4.1.1. Define the File Storage Format
-
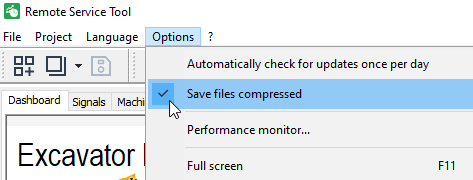
Click in the menu bar on Options → Sava files compressed to save the DBS file in a compressed format.
✓ A tick appears next to the menu option.
-
Click in the menu bar on Options → Sava files compressed to save the DBS file in uncompressed format.
✓ The tick next to the menu option is removed.
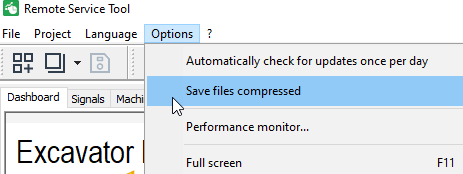
✓ This setting is saved and reproduced next time you start the program.
4.2. Communication between Target Device and Remote Service Tool
Irrespective of the DBS file used to display the machine and/or vehicle data, you must assign a communication path in Remote Service Tool. This is how you determine how the CAN bus data from the machines and/or vehicles is transferred to Remote Service Tool via a communication gateway installed in the machine or connected to the machine’s CAN bus.
4.2.1. Setting the communication gateway
-
Click on the Connect icon
to open the Communication settings window.✓ This opens the following window:
The Remote Service Tool supports the following communication gateways and their communication paths:
| Communication gateway | Communication path |
|---|---|
CANlink mobile |
Internet |
Bluetooth / USB |
serial connection to CANlink wireless (configured for Bluetooth connection) and CANview USB |
WiFi / Ethernet |
CANlink wireless (configured for WiFi connection), CANview Ethernet |
Peak PCAN-USB |
PCAN-USB CAN to PC gateway |
CG150 CAN-USB |
CAN-USB gateway device |
Depending on the chosen communication gateway, you must enter parameters for the communication paths. This is explained in the following sections.
When you click on Gateway status icon  , you can check the status of the connected gateway. It is possible to read the firmware status and the set CAN baudrate etc. , you can check the status of the connected gateway. It is possible to read the firmware status and the set CAN baudrate etc.
|
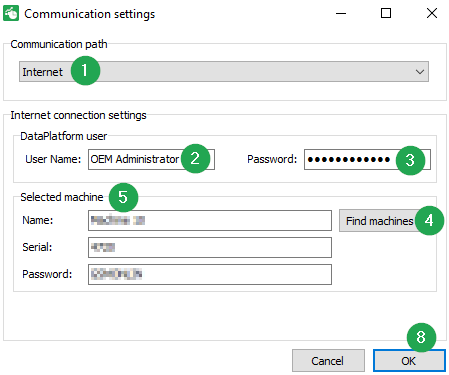
4.2.2. Connecting Internet Communication Gateway to PC and Configuration
Make sure that the respective CANlink® mobile communication gateway is online and configure the communication path as an Internet interface.
| # | Item | Description |
|---|---|---|
1 |
Communication path |
Select Internet to establish a connection to a CANlink® mobile device. |
2 |
User Name |
Enter your DataPlatform user name. |
3 |
Password |
Enter your DataPlatform user password. |
4 |
Find machines |
Button to load the list of available machines for your DataPlatform account. |
5 |
Selected machine |
Shows the selected machine and its configured remote access password. |
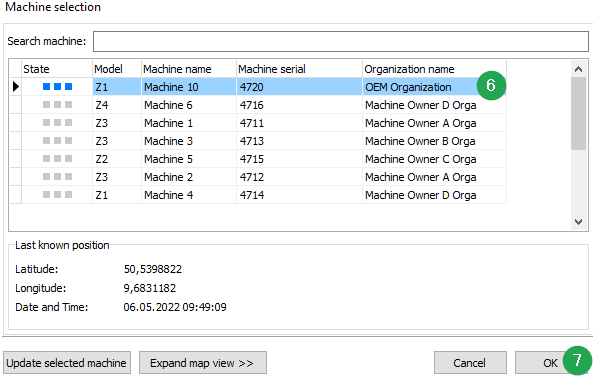
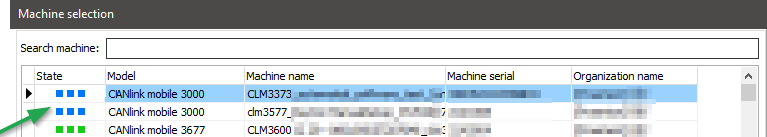
6 |
Machine selection |
Click on the required machine. The selected machine will be marked with a black triangle, see also State Indicator. |
7 |
Ok |
Click on OK to confirm the machine selection. |
8 |
OK |
Click on OK to start connecting. |
| In case of connection issues, please refer to chapter Connectivity Check |
| In the event that there are issues with user login, permissions or restricted access to machines, please get in contact with the designated DataPortal of your organization and check the assigned features and permissions. |
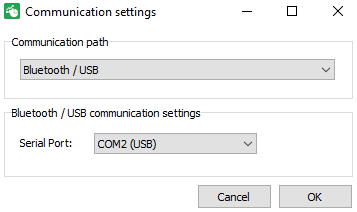
4.2.3. Connecting Bluetooth / USB Communication Gateway to PC and Configuration
Make sure that the serial connection between your pc and the required hardware is established.
| # | Item | Description |
|---|---|---|
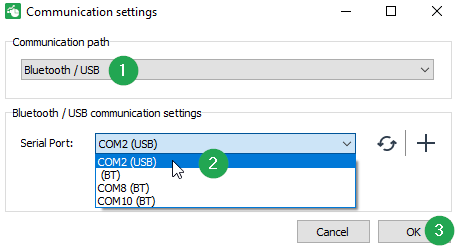
1 |
Communication path |
Select Bluetooth / USB to establish a serial connection to a CANlink wireless or CANview USB device. |
2 |
Serial Port |
Select the virtual COM port of the connected CAN-PC gateway. |
3 |
OK |
Click Ok to establish a serial connection to the selected gateway. |
4.2.4. Connecting WiFi / Ethernet Gateway to PC and Configuration
Make sure that the TCP connection between your pc and the required hardware is established.
| # | Item | Description |
|---|---|---|
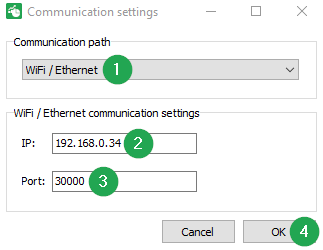
1 |
Communication path |
Select WiFi / Ethernet to establish a TCP connection to a CANlink wireless or CANview Ethernet. |
2 |
IP |
Enter the assigned IP address of the gateway within your network. |
3 |
Port |
Enter the configured port for the TCP configuration. |
4 |
OK |
Click Ok to establish a TCP connection to the selected gateway. |
4.2.5. Connecting PCAN-USB Gateway to PC and Configuration
Make sure that the PCAN-USB gateway is connected to your pc.
| # | Item | Description |
|---|---|---|
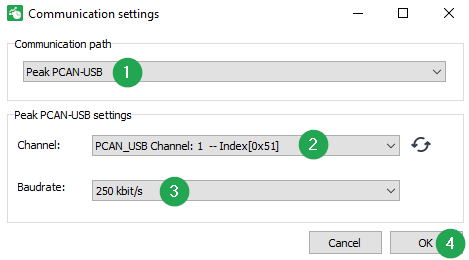
1 |
Communication path |
Select Peak PCAN-USB to establish a serial connection to a PCAN-USB gateway. |
2 |
Channel |
Select the available PCAN_USB Channel. If necessary, click on the refresh icon. |
3 |
Baudrate |
Enter the Baudrate of the connected CAN bus |
4 |
OK |
Click Ok to establish a serial connection to the selected gateway. |
4.3. Create a Configuration File
To display CAN data, Remote Service Tool requires configuration file with the file extension *.dbs which contains a complete specification of the CAN messages and their signals.
The signals and states can be displayed in different widgets, see below.
You can edit existing DBS files and create new DBS files.
4.3.1. State Indicator
The different states of a device in the Machine Selection dialog are indicated with different colors:
-
Green color:
-
Hybrid devices that have the "Online mode" (Logging and Realtime modes)" enabled, e.g. CANlink® mobile 3600 see CANlink® mobile 3600 Online feature.
-
Devices in logging/filetransfer mode.
-
-
Blue color:
-
Devices in realtime mode, e.g. devices of the CANlink® mobile 3000 and CANlink® mobile 5000 series and CANlink® mobile 3600 that have installed a firmware version < 2.0.
-
-
Gray color:
-
Devices are offline.
-
4.3.2. Enable the Edit Mode
To modify an existing or new configuration file, the Edit mode must be enabled.
-
Click in the menu bar on PROJECT→EDIT MODE ENABLED to enable edit mode.
✓ In edit mode, you can customize the display interface using tab and Dashboard elements.
Example of Dashboard elements in edit mode:
Depiction Description 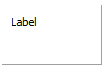
EDIT MODE is disabled
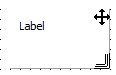
EDIT MODE is enabled. You can move
 and change the size
  of each element.
 -
Click on PROJECT→EDIT MODE ENABLED in the menu bar to quit edit mode.
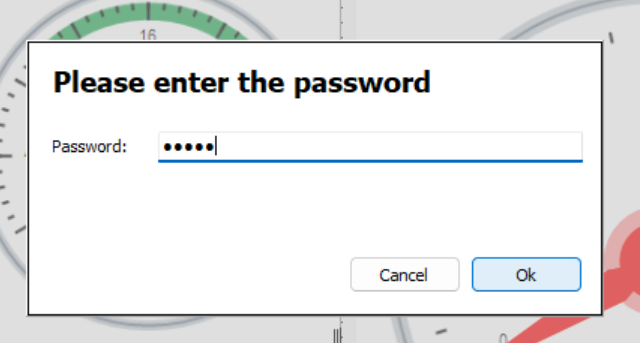
4.3.3. Project Password (Dashboard Protection)
The Remote Service Tool allows protecting a dashboard against unauthorized or unintended modifications
by using a project password.
When a project password is set, editing of the dashboard configuration is blocked unless
the correct password is entered.
This feature is intended to separate configuration users (e.g. developers or service
engineers) from standard users who should only view data.
Enable a Password-Protected Dashboard
Proceed as follows:
-
Click in the menu bar on PROJECT → EDIT MODE ENABLED as described in the previous section.
-
Click in the menu bar on PROJECT → PROJECT PASSWORD.
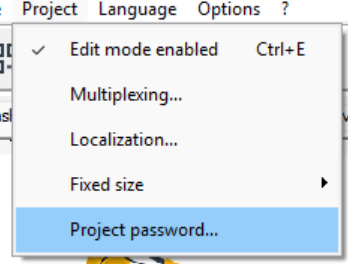
-
Enter a password and confirm it.
-
Save the project using Ctrl + S.
✓ Editing the dashboard is now protected by a project password.
✓ The dashboard can only be modified after entering the correct password.
Disable the Password Protection
To remove the password protection, proceed as follows:
-
Click in the menu bar on PROJECT → EDIT MODE ENABLED.
-
Click in the menu bar on PROJECT → PROJECT PASSWORD.
-
Remove the password by setting it to blank.
-
Confirm and save the project.
✓ The dashboard can now be edited without entering a password.
Behavior and Limitations
Please note the following:
-
The project password protects dashboard editing only.
-
Viewing data and operating dashboard elements is still possible without a password.
-
The password is project-based and stored in the DBS file.
-
There is no user or role management.
All users share the same project password. -
The protection applies to all tabs and dashboard elements within the project.
Additional Notes
Please consider the following when using the project password feature:
-
The project password is evaluated when switching to Edit Mode.
If a password is set, editing actions are blocked until the correct password
is entered. -
The project password should be documented and stored securely, as losing the
password prevents further modification of the dashboard configuration. -
When distributing DBS files, it is recommended to verify the password
protection before delivery.
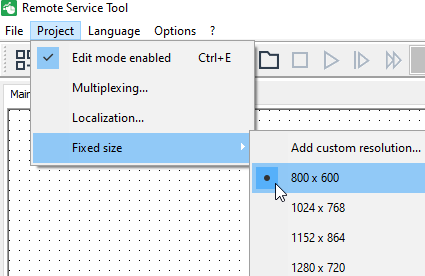
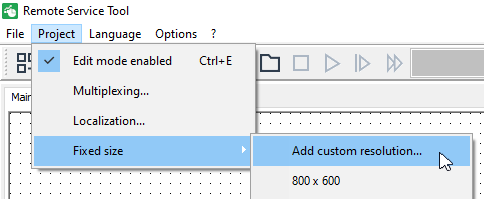
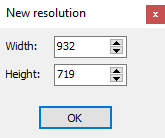
4.3.4. Set the Resolution of the Software Interface
You can either select a resolution from the list or customize the resolution of the software interface.
4.3.5. The Tab Display Concept
It is possible to structure the display element by using several tabs.
If you have not opened a DBS file, an empty tab is automatically shown, named MAIN.
Create a Tab
-
In edit mode, right-click in the empty display area of the tab to open the context menu for the edit functions.
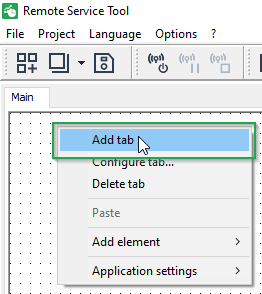
-
Click on ADD TAB to create a new tab.
✓ The new tab is added to the right of the existing tabs. You can change the order of the tabs on the display interface in edit mode using drag-and-drop.
A new tab is assigned a standard name with a consecutive number (e. g. TAB 1, TAB 2 etc.).
You can configure the name of the tab as well as further settings.
Configure a Tab
-
Right-click on the tab name to open the context menu for the edit functions.
-
Click on CONFIGURE TAB….
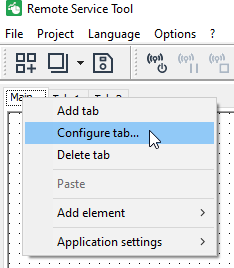
✓ The window TAB CONFIGURATION opens.
General
-
In the TAB TITLE field you can select the name you want from a list or enter a new name.
-
Click on the BACKGROUND COLOR… button to change the background color of the tab element.
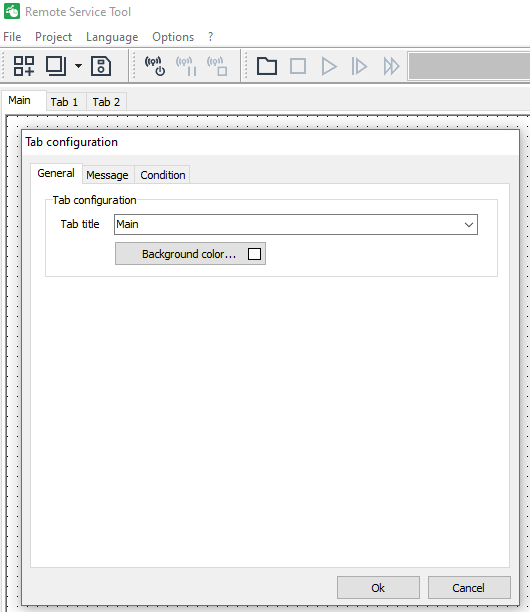
-
Click on the OK button to confirm your change.
✓ The new text is then saved to a list. You can access all the saved names in all text entry fields via this list.
Message
In the area CAN MESSAGE SETTINGS, you have the option of configuring a CAN message transmitted on the CAN bus by switching to the tab configured here during display.
| This CAN message can trigger certain actions in the machine. This requires corresponding programming at the machine end. |
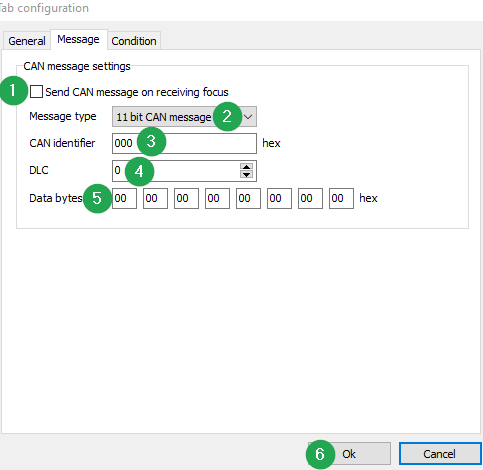
| # | Item | Description |
|---|---|---|
1 |
SEND CAN MESSAGE ON RECEIVING FOCUS |
Enable this checkbox to hide the tab until the defined CAN message has been received. |
2 |
MESSAGE TYPE |
Define whether it is an 11 or a 29-bit message. |
3 |
CAN IDENTIFIER |
Define the identifier of the CAN message as a hexadecimal value. |
4 |
DLC |
Define the number of data bytes to be transmitted (0…8) |
5 |
DATA BYTES |
Define the (bitwise) payload of the data bytes which needs to be sent. |
6 |
OK |
Click on OK to confirm the setup. |
|
Transmitting defective CAN messages can cause unwanted system reactions of the target device. Malfunctions and/or damage to the target device are possible. → Ensure the CAN messages to be transmitted contain correct commands. |
Condition
In the CONDITION SETTINGS tab, you can define a CAN message which is to be used to display or hide a certain tab during runtime.
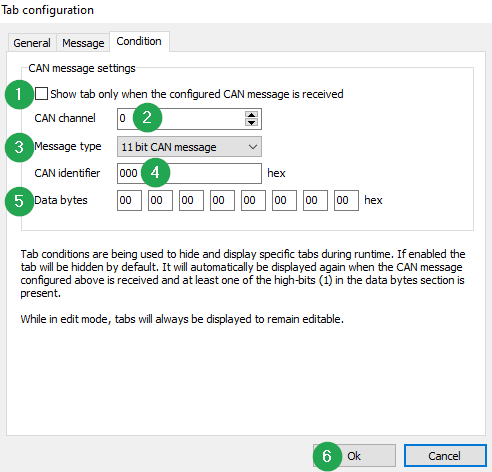
| # | Item | Description |
|---|---|---|
1 |
SHOW TAB ONLY WHEN THE CONFIGURED CAN MESSAGE IS RECEIVED |
Enable this checkbox to hide the tab until the defined CAN message has been received. |
2 |
CAN CHANNEL |
Define the CAN channel (channel 0 = CAN1 interface at the CANlink® mobile) |
3 |
MESSAGE TYPE |
Define whether it is an 11 or a 29-bit message. |
4 |
CAN IDENTIFIER |
Define the identifier of the CAN message as a hexadecimal value. |
5 |
DATA BYTES |
Define the data bytes to be received (0…8). You can assign hexadecimal values to them in the DATA BYTES fields. |
6 |
OK |
Click on OK to confirm the setup. |
4.3.6. Create a Dashboard Element in a Tab
Within the defined tabs, you can arrange and configure the evaluation and display elements.
-
Right-click on a tab name to open the context menu.
-
Click on the context menu item ADD ELEMENT.
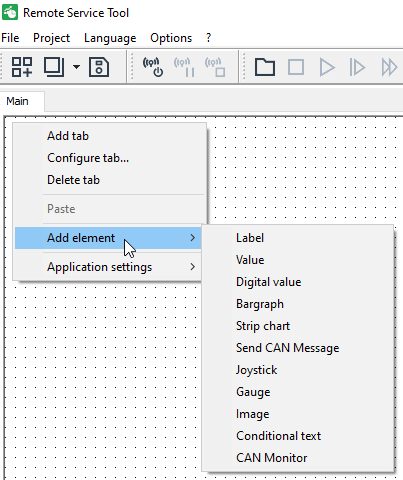
-
Click on a Dashboard element in the submenu.
-
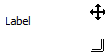
Move the Dashboard element onto the display interface.
-
Use drag-and-drop to position the Dashboard element on the display interface.
-
Click on the edge of a Dashboard element and drag the edge out or in to change the size of the Dashboard element.
-
Right-click on a Dashboard element to open the context menu. You can configure each Dashboard element by clicking on the menu item CONFIGURE …. Alternatively, double-click on its display area.
5. Dashboard Elements
The following Dashboard elements are available:
| Element | Description |
|---|---|
The Dashboard element LABEL displays a text. You can edit and format the text. |
|
The VALUE Dashboard element displays a numerical value received through a CAN message. |
|
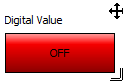
The Dashboard element DIGITAL VALUE shows a digital value that has been received through a CAN message. |
|
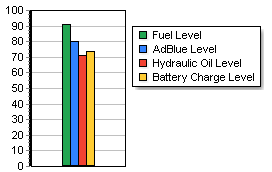
The Dashboard element BARGRAPH shows up to 5 different values in the form of a bargraph. |
|
The Dashboard element STRIP CHART shows up to 5 different values in the form of a strip chart. |
|
With the Dashboard element SEND CAN MESSAGE, you create and configure a button you can use to transmit a configurable CAN message to the remote CAN network. |
|
The Dashboard element JOYSTICK displays up to 5 different values in the form of bar diagrams and/or freely configurable axes. |
|
The Dashboard element GAUGE displays a value in the form of a tachograph/gauge. |
|
The Dashboard element IMAGE enables you to display graphics using configurable conditions. |
|
The Dashboard element CONDITIONAL TEXT enables you to display different texts using configurable conditions. |
|
The CAN MONITOR Dashboard element enables the display of received CAN messages. |
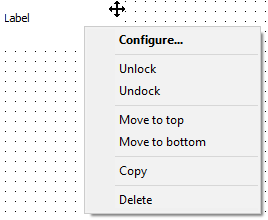
5.1. Label
The Dashboard element LABEL displays a text. You can edit and format the text.
The Dashboard element LABEL is part of all other Dashboard elements.
| The configuration of the Dashboard element LABEL is described here as an example for all the elements. |
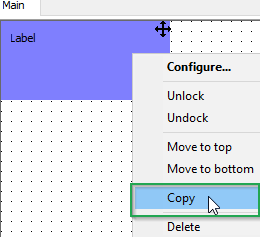
-
Right-click on the LABEL element to open the context menu.
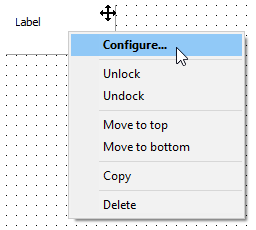
| Context menu item | Description |
|---|---|
CONFIGURE |
Click on the context menu item CONFIGURE … to open the configuration dialog for the Dashboard element. Alternatively, double-click directly on a Dashboard element. See Chapter General tab |
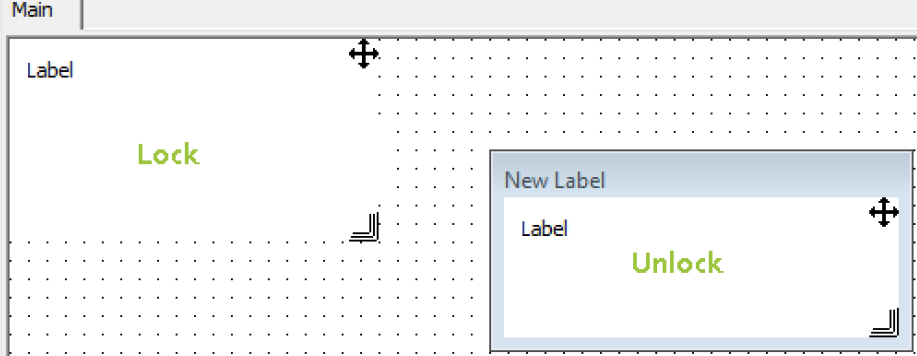
LOCK |
Click on the context menu item LOCK to hide the Windows® frame of a Dashboard element and to lock the position of the Dashboard element on the display interface. |
UNLOCK |
Click on the context menu item UNLOCK to show the Windows® frame and unlock the position on the display interface. See Chapter Display types of a DBS file. |
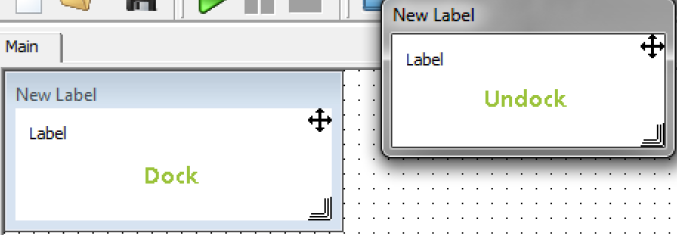
UNDOCK |
Click on the context menu item UNDOCK to undock the Dashboard element from the display interface. The Dashboard element then appears as an independent window on the desktop and can be freely positioned there. |
DOCK |
Click on the context menu item DOCK to re-dock the freely positionable Dashboard element on the display interface. See Chapter Display types of a DBS file. |
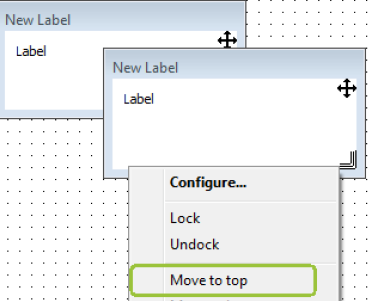
MOVE TO TOP |
Click on the context menu item MOVE TO TOP to place the Dashboard element in the foreground. |
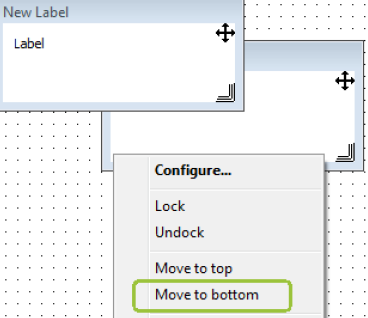
MOVE TO BOTTOM |
Click on the context menu item MOVE TO BOTTOM to place the Dashboard element in the background. |
COPY |
Click on a Dashboard element. Click on the context menu item COPY to copy the selected Dashboard element. Alternatively, use the key combinations Ctrl + C and Ctrl + V. See Chapter Display types of a DBS file. |
DELETE |
Click on a Dashboard element. Click on the context menu item DELETE to delete the selected Dashboard element. |
5.1.1. General Tab
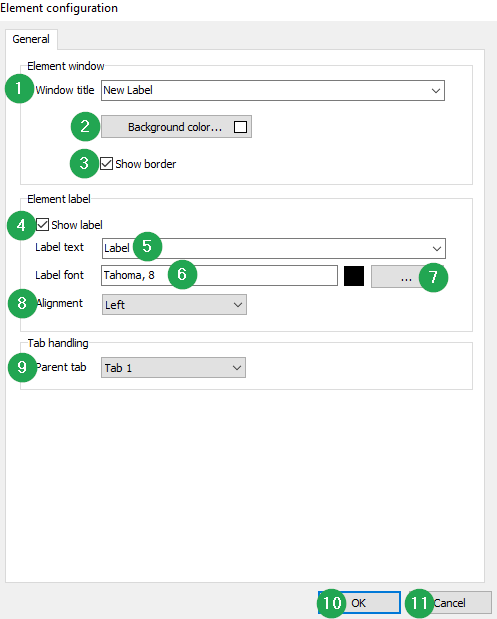
| # | Item | Description |
|---|---|---|
1 |
WINDOW TITLE |
In this field you can select the name of the window you want from a list, or enter a new name. |
2 |
BACKGROUND COLOR … |
Click on the BACKGROUND COLOR … button to change the background color of the element. |
3 |
SHOW BORDER |
Tick this box if you want the element border to be shown. Remove the tick if you want the element border to be hidden. |
4 |
SHOW LABEL |
Tick this box if you want the label text to be shown. Remove the tick if you want the label text to be hidden. |
5 |
LABEL TEXT |
In this field you can select the label text you want for the Dashboard element from a list, or enter a new name. |
6 |
LABEL FONT |
This field shows the current font and font size of the label text. |
7 |
[…] |
Click on the […] button to open the Font dialog. |
8 |
ALIGNMENT |
Choose the alignment of the label text in the Dashboard element. |
9 |
PARENT TAB |
In this field, select the name of the tab to which the selected Dashboard element will be assigned. If appropriate, the Dashboard element will be transferred to the selected tab. This option is only available when there is more than 1 tab configured. |
10 |
Ok |
Click on the OK button to adopt a change. |
11 |
CANCEL |
Click on the CANCEL button to cancel a change. |
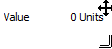
5.2. Value
The VALUE Dashboard element displays a numerical value received through a CAN message.
-
Right-click on the Dashboard element VALUE.
-
Click on the context menu item CONFIGURE ….
✓ The configuration dialog for the Dashboard element opens.
| Alternatively, you can open the configuration dialog for the Dashboard element by double-clicking on the Dashboard element. |
5.2.1. General Tab
See chapter General Tab.
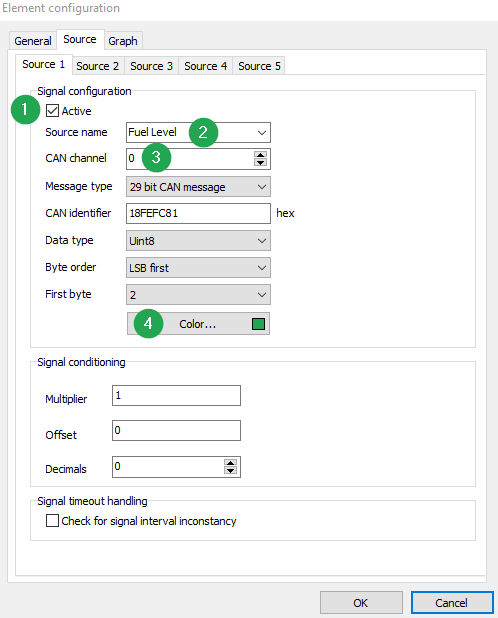
5.2.2. Source Tab
In the SOURCE tab, configure the CAN receive message for the value to be shown.
Some Dashboard elements have more than one SOURCE configuration area. In this case, there are tab sub-elements SOURCE 1 etc.
A configuration is described here as a general example.
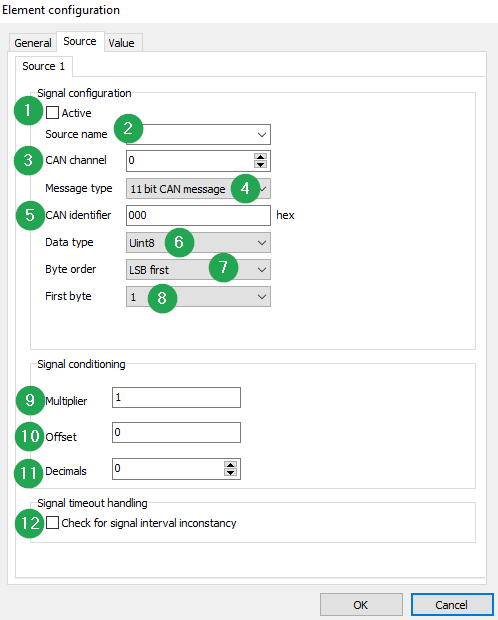
| # | Item | Description |
|---|---|---|
1 |
ACTIVE |
Enable this checkbox to activate monitoring of the CAN message configured in this tab. The activation is necessary so that the values to be displayed are transferred to the Dashboard element and can be shown. |
2 |
SOURCE NAME |
The name displayed for the data source. This is not evaluated in the Dashboard element Value and is only shown for information purposes. Define the display name by entering it or selecting from a list of available texts. Please note: In other elements, e.g. bargraphs and strip charts, this name is used for the legend. |
3 |
CAN CHANNEL |
Define the CAN interface, 0=CAN1, 1=CAN2, 2= CAN3 |
4 |
MESSAGE TYPE |
Define the CAN message type. Chose between 11-bit CAN message and 29-bit CAN message. |
5 |
CAN IDENTIFIER |
Enter the hexadecimal value of the CAN identifier of the CAN message to be displayed. |
6 |
DATA TYPE |
Select the data type of the value to be displayed within the CAN data. Available data types are: |
7 |
BYTE ORDER |
Define the byte order (MSB or LSB first) according to which the value to be displayed from the CAN data will be calculated. |
8 |
FIRST BYTE |
Select from which data byte (1-8) the value to be displayed from the CAN data will start. The number of data bytes is determined by the data type. |
9 |
MULTIPLIER |
Enter a factor by which the value to be displayed from the CAN data will be multiplied before being shown. This value can contain digits after the decimal point. |
10 |
OFFSET |
Enter a constant value which will be added to the value to be displayed from the CAN data before being shown. The value can contain digits after the decimal point, and be positive or negative. |
11 |
DECIMALS |
Select the number of digits after the decimal point that the value to be displayed will be shown with. |
12 |
CHECK FOR SIGNAL INTERVAL INCONSISTENCY |
This activates the monitoring period within which a CAN message must be received. The monitoring period is calculated automatically. |
5.2.3. Value Tab
In the VALUE tab, you configure the unit and the depiction of the value to be displayed.
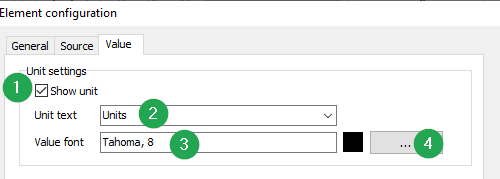
| # | Item | Description |
|---|---|---|
1 |
SHOW UNIT |
Enable this checkbox to show the specified unit for the signal value. |
2 |
UNIT TEXT |
Define the physical unit for the value to be displayed by entering a unit or selecting it from a list of already available texts. |
3 |
VALUE FONT |
This field shows the current font and font size for the value and the physical unit. |
4 |
[…] |
Click on the […] button to open the Font dialog. |
5.3. Digital value
The Dashboard element DIGITAL VALUE shows a digital value that has been received through a CAN message.
-
Right-click on the Dashboard element DIGITAL VALUE.
-
Click on the context menu item CONFIGURE ….
✓ The configuration dialog for the Dashboard element opens.
5.3.1. General Tab
See chapter General Tab.
5.3.2. Source Tab
See chapter Source Tab.
| Not all parameters are available, or some parameters are disabled because this is bit information. The settings for MULTIPLIER, OFFSET, and DECIMALS are not available. |
| Parameter | Value | Description |
|---|---|---|
DATA TYPE |
Bit |
The data type of the value to be displayed within the CAN data is fixed. |
BYTE ORDER |
MSB first, LSB first |
This selection option is disabled because this is bit information. |
BIT |
0 to 7 |
Position of the binary value to be evaluated within the byte specified in FIRST BYTE. |
5.3.3. LED Tab
In the LED tab, configure the LED depiction of the digital value to be displayed.
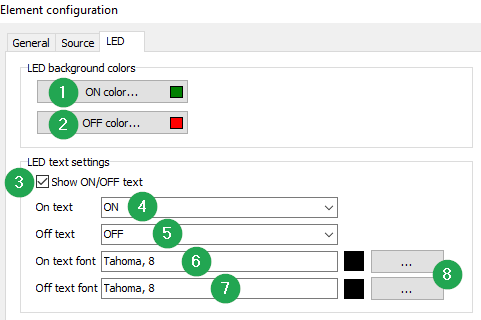
| # | Item | Description |
|---|---|---|
1 |
ON COLOR… |
Determine the color to be shown by the digital LED when bit value 1 is received. |
2 |
OFF COLOR… |
Determine the color to be shown by the digital LED when bit value 0 is received. |
3 |
SHOW ON/OFF TEXT |
Tick the box. An additional text is shown on the LED. |
4 |
ON TEXT |
Define the text that is displayed when bit value 1 is received by entering the text or selecting it from a list of already available texts. |
5 |
OFF TEXT |
Define the text that is displayed when bit value 0 is received by entering the text or selecting it from a list of already available texts. |
6 |
ON TEXT FONT |
This field shows the current font and font size for the ON TEXT. |
7 |
OFF TEXT FONT |
This field shows the current font and font size for the OFF TEXT. |
8 |
[…] |
Click on the […] button to open the Font dialog. |
5.4. Bargraph
The Dashboard element BARGRAPH shows up to 5 different values in the form of a bargraph.
-
Right-click on the Dashboard element BARGRAPH.
-
Click on the context menu item CONFIGURE ….
✓ The configuration dialog for the Dashboard element opens.
5.4.1. General Tab
See chapter General Tab.
5.4.2. Source Tab
See chapter Source Tab.
| The Dashboard element SOURCE supports up to 5 data sources. Configure the data sources in the tabs SOURCE 1 to SOURCE 5. |
| # | Item | Description |
|---|---|---|
1 |
ACTIVE |
Click the box to display the data source in the bargraph. |
2 |
SOURCE NAME |
Enter a name for the data source, or select a name from the list. The name can be displayed as a legend. |
3 |
CAN CHANNEL |
Define the CAN channel. |
4 |
COLOR… |
Select a color for the display of the data source. |
5.4.3. Graph Tab
In the GRAPH tab, configure the display options for the bargraph.
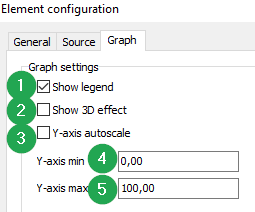
| # | Item | Description |
|---|---|---|
1 |
SHOW LEGEND |
Determine the color to be shown by the digital LED when bit value 1 is received. |
2 |
SHOW 3D EFFECT |
Tick the box to display the bargraph with a 3D effect. Untick to display the bargraph in 2D. |
3 |
Y-AXIS AUTOSCALE |
Tick the box to automatically scale the bargraph. Untick to configure the Y-axis by entering the values Y-AXIS MIN and Y-AXIS MAX. |
4 |
Y-AXIS MIN |
Enter the minimum value of the Y-axis. |
5 |
Y-AXIS MAX |
Enter the maximum value of the Y-axis. |
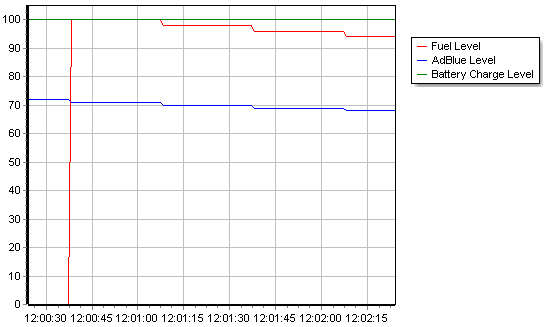
5.5. Strip chart
The Dashboard element STRIP CHART shows up to 5 different values in the form of a strip chart.
-
Right-click on the Dashboard element STRIP CHART.
-
Click on the context menu item CONFIGURE ….
✓ The configuration dialog for the Dashboard element opens.
5.5.1. General Tab
See chapter General Tab.
5.5.2. Source Tab
See chapter Source Tab.
5.5.3. Graph Tab
In the GRAPH tab, configure the display options for the strip chart.
See chapter Graph Tab.
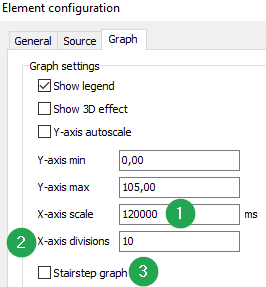
| # | Item | Description |
|---|---|---|
1 |
X-AXIS SCALE |
Enter the period in milliseconds to be shown on the X-axis. |
2 |
X-AXIS DIVISIONS |
Enter the division factor by which the period defined by the X-AXIS SCALE is to be divided. |
3 |
STAIRSTEP GRAPH |
Tick this box if you want to display a stairstep graph. Untick the box if you want to display a line graph. |
5.6. Send CAN message
With the Dashboard element SEND CAN MESSAGE, you create and configure a button you can use to transmit a configurable CAN message to the remote CAN network.
-
Right-click on the Dashboard element STRIP CHART.
-
Click on the context menu item CONFIGURE ….
✓ The configuration dialog for the Dashboard element opens.
5.6.1. General Tab
See chapter General Tab.
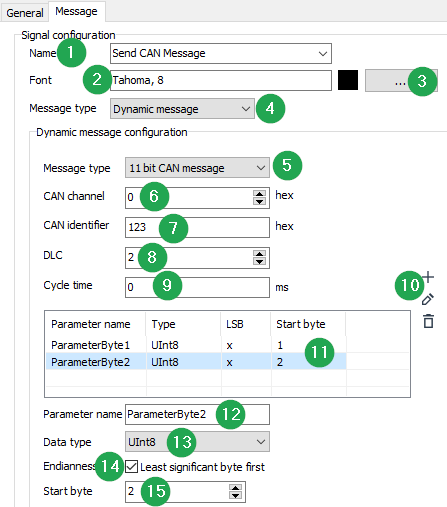
5.6.2. Message Tab
In the Message tab, configure the CAN message which needs to be sent.
|
Transmitting defective CAN messages can cause unwanted system reactions of the target device. Malfunctions and/or damage to the target device are possible. → Ensure the CAN messages to be transmitted contain correct commands. |
| In the example shown, a dynamic message is configured which is sent when a button is pressed. Optionally, a fixed and/or cyclical send message can be defined. |
| # | Item | Description |
|---|---|---|
1 |
NAME |
Define the button text by entering it or selecting it from a list of already available texts. |
2 |
FONT |
This field shows the current font and font size for the NAME button text. |
3 |
[…] |
Click on the […] button to open the Font dialog. |
4 |
MESSAGE TYPE |
Select Dynamic or Fixed message. |
5 |
MESSAGE TYPE |
Select 11 bit CAN message or 29 bit CAN message. |
6 |
CAN CHANNEL |
Select the CAN interface of the gateway device (Ch0=CAN1, Ch1=CAN2 and Ch2=CAN3). |
7 |
CAN IDENTIFIER |
Enter the hexadecimal value of the CAN identifier of the CAN message to be sent. |
8 |
DLC |
Select the number of data bytes (0-8) in the data field of the CAN message to be sent. |
9 |
CYCLE TIME |
Enter the cycle time for transmission of the CAN message. If you click on the configured button, the message is transmitted cyclically when the cycle time is greater than zero. If the cycle time is equal to zero, the message is transmitted exactly once. |
10 |
ADD, EDIT & DELETE ICON |
Use these buttons to add, edit or remove a dynamic message. |
11 |
DYNAMIC MESSAGE OVERVIEW |
List of defined messages. |
12 |
PARAMETER NAME |
Defined name for the message. |
13 |
DATA TYPE |
Selected data type. |
14 |
ENDIANESS |
Enable this checkbox for LSB first. Leave the checkbox disabled for MSB. |
15 |
START BYTE |
Define the start byte for the data. |
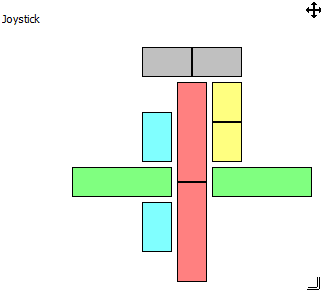
5.7. Joystick
The Dashboard element JOYSTICK displays up to 5 different values in the form of bar diagrams and/or freely configurable axes.
-
Right-click on the Dashboard element STRIP CHART.
-
Click on the context menu item CONFIGURE ….
✓ The configuration dialog for the Dashboard element opens.
5.7.1. General Tab
See chapter General Tab.
5.7.2. Source Tabs
See chapter Source Tab.
| The Dashboard element supports up to 5 data sources. Configure the data sources in the tabs SOURCE 1 to SOURCE 5. |
| The COLOR… button is not supported for the data sources. |
| SOURCE NAME is used as the name for the axes. |
| Only the data sources that are ACTIVE are displayed. |
5.7.3. Axes tab
Define the position and behavior of the up to 5 axes as well as the depiction of the labels in 6 sub-tabs. The area PREVIEW gives you a preview showing a direct display of the changes you make.
| The axis currently selected is shown with a red frame in the preview. |
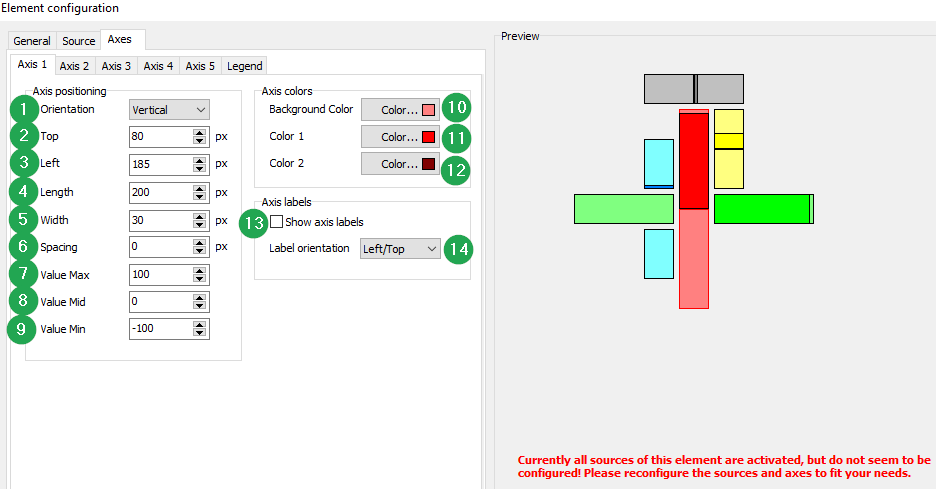
| # | Item | Description |
|---|---|---|
1 |
ORIENTATION |
Select between horizontal and vertical axis orientation. |
2 |
TOP |
Define the distance between the axis and the top window edge in pixels. |
3 |
LEFT |
Define the distance between the axis and the left window edge in pixels. |
4 |
LENGTH |
Define the length of the axis in pixels. |
5 |
WIDTH |
Define the width of the axis in pixels. |
6 |
SPACING |
Define the spacing between two sections of an axis in pixels. |
7 |
VALUE MAX |
Define the minimum value of the axis for the +100% value of the data source. |
8 |
VALUE MID |
Define the middle value of the axis for the 0% value of the data source. This value also defines the line in the axis display that divides the two axis sections. |
9 |
VALUE MIN |
Define the minimum value of the axis for the -100% value of the data source. |
10 |
BACKGROUND COLOR |
Define the background color of the axis. |
11 |
COLOR 1 |
Define the color for the display of the deviation for the first axis section (0% to 100% of the axis). |
12 |
COLOR 2 |
Define the color for the display of the deviation for the second axis section (-100% to 0% of the axis). |
13 |
SHOW AXIS LABELS |
Tick this box if you want to display the values VALUE MAX/ VALUE MID/ VALUE MIN. Untick the box if you don’t want the values to be displayed. |
14 |
LABEL ORIENTATION |
Define the position of the axis labels according to the orientation of the diagram. |
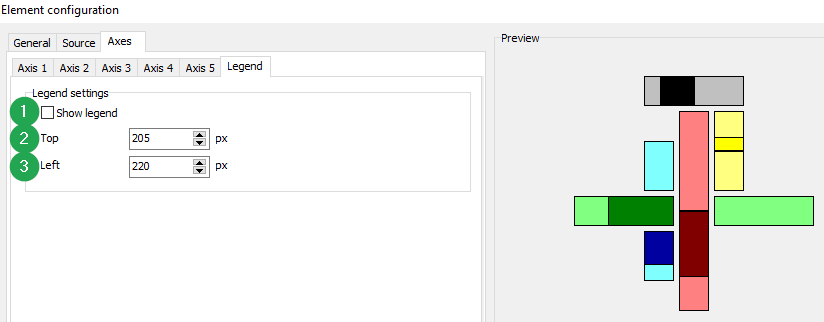
5.7.4. Legend tab
Define the depiction of the legend. The area PREVIEW gives you a preview showing a direct display of the changes you make.
| # | Item | Description |
|---|---|---|
1 |
SHOW LEGEND |
Tick this box if you want to display the legend. Untick the box if you don’t want the legend to be displayed. |
2 |
TOP |
Define the distance between the legend and the top window edge in pixels. |
3 |
LEFT |
Define the distance between the legend and the left window edge in pixels. |
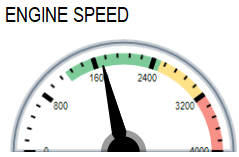
5.8. Gauge
The Dashboard element GAUGE displays a value in the form of a tachograph/gauge.
-
Right-click on the Dashboard element GAUGE.
-
Click on the context menu item CONFIGURE ….
✓ The configuration dialog for the Dashboard element opens.
5.8.1. General Tab
See chapter General Tab.
5.8.2. Source Tabs
See chapter Source Tab.
5.8.3. Gauge Tab
Under the GAUGE tab there are 4 further tabs for configuration of the Dashboard element.
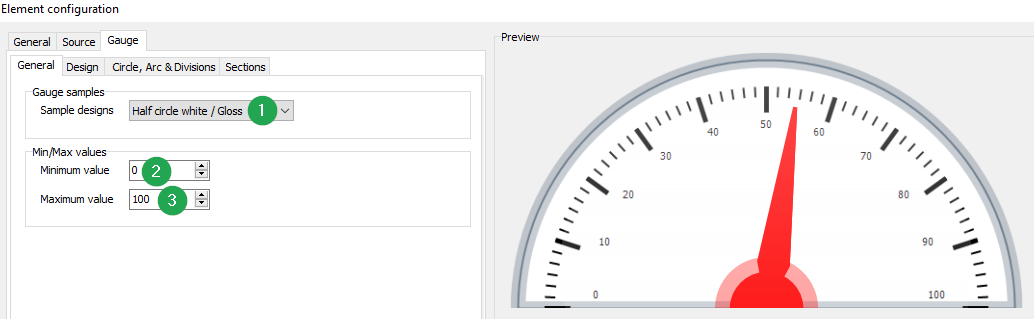
General Tab
Define the gauge design and enter the minimum and maximum values.
| # | Item | Description |
|---|---|---|
1 |
SAMPLE DESIGNS |
Select one of the available gauges as a basis for the further configuration. |
2 |
MINIMUM VALUE |
Define the minimum value of the gauge scale. |
3 |
MAXIMUM VALUE |
Define the maximum value of the gauge scale. |
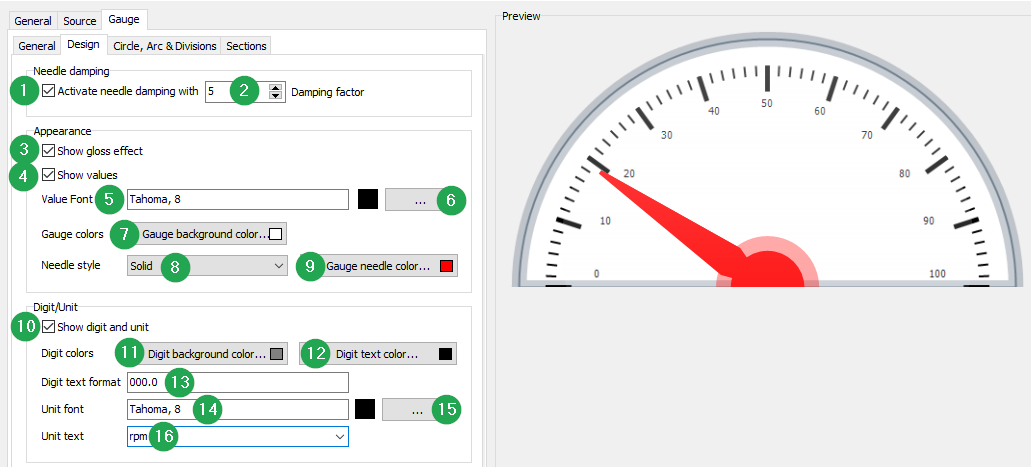
Design Tab
Define the gauge design and enter the minimum and maximum values.
| # | Item | Description |
|---|---|---|
1 |
ACTIVE NEEDLE DAMPING WITH |
Tick this box to enable needle damping. Untick the box to disable needle damping. Needle damping prevents wobble during rapid value updating. However, this can lead to significant time lags that do not display high peaks. For connections via GSM and UMTS, we recommend disabling this option. |
2 |
DAMPING FACTOR |
Select a suitable damping factor. |
3 |
SHOW GLOSS EFFECT |
Tick this box to enable a gloss effect on the gauge. Untick the box to disable the gloss effect on the gauge. |
4 |
SHOW VALUES |
Tick this box to enable the display of the values on the dividing lines. Untick the box to disable display of the values on the dividing lines. |
5 |
VALUE FONT |
This field shows the current font and font size for the scale values. |
6 |
[…] |
Click on the […] button to open the Font dialog. |
7 |
GAUGE BACKGROUND COLOR… |
Define the background color of the gauge. |
8 |
NEEDLE STYLE |
Choose a visual style for the needle. |
9 |
GAUGE NEEDLE COLOR… |
Define the color of the gauge needle. |
10 |
SHOW DIGIT AND UNIT |
Enable/disable the display of the unit text and digital display. |
11 |
DIGIT BACKGROUND COLOR |
Define the background color of the digital display. |
12 |
DIGIT TEXT COLOR |
Define the text color of the digital display. |
13 |
DIGIT TEXT FORMAT |
Define the number of digits before and after the decimal point in the digital display in the format 0000.00 (here: four digits before the point with leading zeros, two digits after the point). You cannot change the font. |
14 |
UNIT FONT |
Shows the current font and font size for the unit text which can be defined in the field UNIT TEXT. |
15 |
[…] |
Click on this button to open the Font dialog. |
16 |
UNIT TEXT |
Define the unit text by entering a text or selecting one from a list of already available texts. |
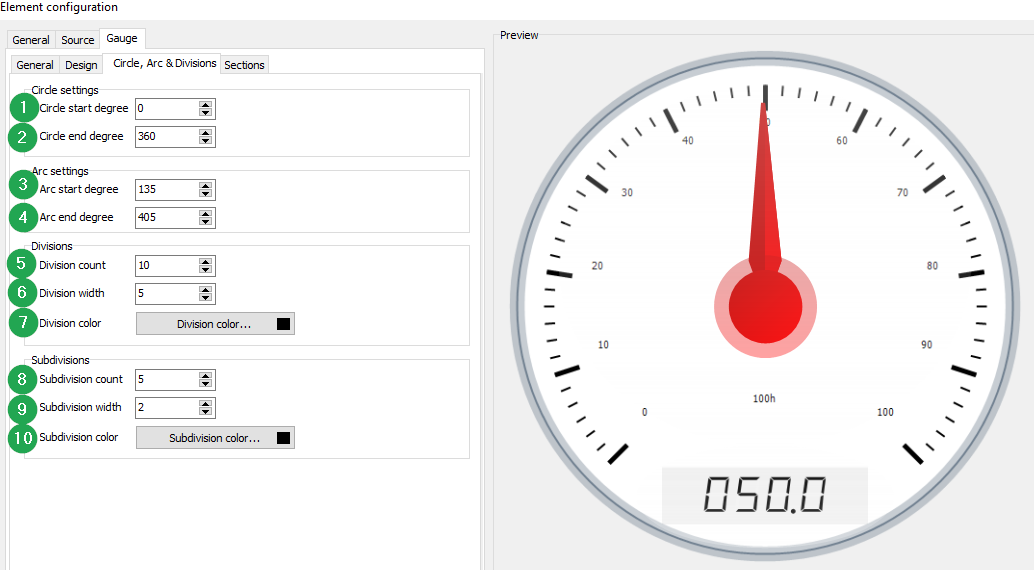
Circle, Arc & Divisions Tab
Configure the start and end degree, the scale divisions, and the appearance of the gauge as a full-circle or arc gauge.
| The 0° position for the degree count is horizontally to the right of the center point. The degree count progresses clockwise in a positive direction. |
| For a full-circle gauge, the start degree is 0° and the end degree is 360°. |
| In the case of full-circle gauges, the end degree for the scale is usually greater than 360° and the start degree greater than 90°. |
| A scale can never be outside the background arc of the gauge. The degrees of the ARC SETTINGS are restricted by the degree settings of the CIRCLE SETTINGS. |
| # | Item | Description |
|---|---|---|
1 |
CIRCLE START DEGREE |
Define the start degree for the scale. |
2 |
CIRCLE END DEGREE |
Define the end degree for the scale. |
3 |
ARC START DEGREE |
Define the start degree for the scale. |
4 |
ARC END DEGREE |
Define the end degree for the scale. |
5 |
DIVISION COUNT |
Define the number of main divisions on the scale. |
6 |
DIVISION WIDTH |
Define the width of the main division lines in pixels. |
7 |
DIVISION COLOR |
Define the color of the main division lines on the scale. |
8 |
SUBDIVISION COUNT |
Define the number of subdivisions on the scale. |
9 |
SUBDIVISION WIDTH |
Define the width of the subdivision lines on the scale in pixels. |
10 |
SUBDIVISION COLOR |
Define the color of the subdivision lines on the scale. |
Sections Tab
Configure the start and end degree, the scale divisions, and the appearance of the gauge as a full-circle or arc gauge.
| Please note that overlapping produces new colors. Add the same section definitions multiple times to intensify colors. |
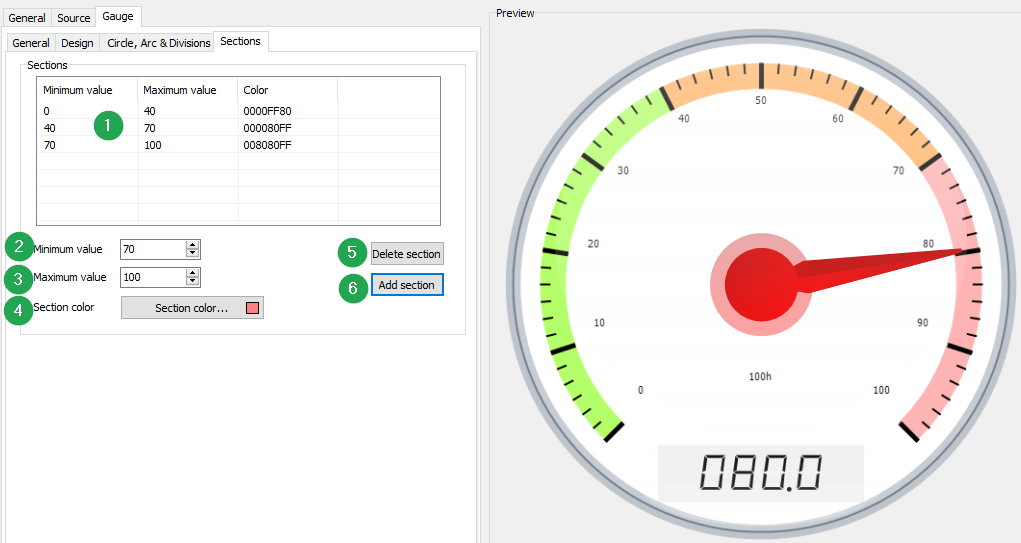
| # | Item | Description |
|---|---|---|
1 |
SECTIONS LIST |
Overview of defined sections. |
2 |
MINIMUM VALUE |
Define the minimum value of a marked section. |
3 |
MAXIMUM VALUE |
Define the maximum value of a marked section. |
4 |
SECTION COLOR |
Define the color of the section. |
5 |
DELETE SECTION |
Highlight a marked section in the list and click on the button to delete the marked section. |
6 |
ADD SECTION |
Click on this button to add a marked section to the list. |
5.9. Image
The Dashboard element IMAGE enables you to display graphics using configurable conditions.

-
Right-click on the Dashboard element IMAGE.
-
Click on the context menu item CONFIGURE ….
✓ The configuration dialog for the Dashboard element opens.
5.9.1. General Tab
See chapter General Tab.
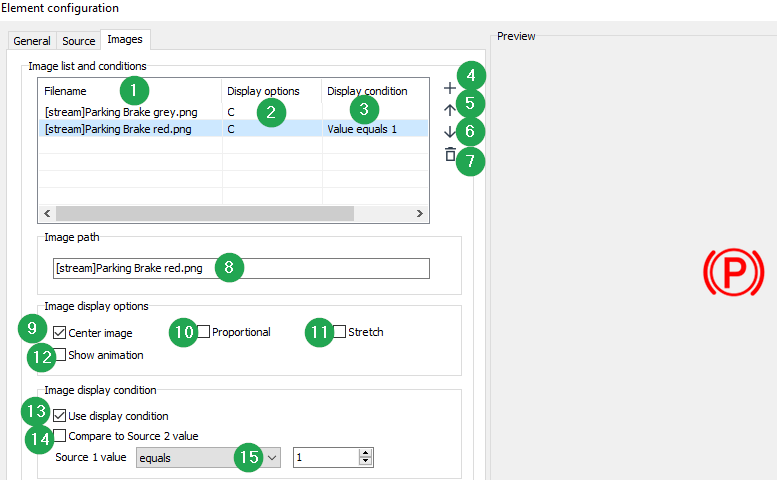
5.9.3. Image Tab
Configure the display conditions for images.
| In the top area there is a list with all configured images and a brief summary of the settings in each case. The order in the list determines which image is actually shown. If one or more conditions are met, the image that is furthest up the list will always be shown. |
| Always load an image in the required size for an efficient configuration file. |
| # | Item | Description |
|---|---|---|
1 |
FILENAME |
Displays the file name of the image. The prefix [stream] means that the image has been saved to the application memory and is not in a file on the hard drive. |
2 |
DISPLAY OPTIONS |
Shows a summary of the settings for display of the image: |
3 |
DISPLAY CONDITION |
Shows what conditions are necessary for the corresponding image to be displayed. |
4 |
|
Click on the PLUS SYMBOL to open the OPEN FILE dialog so that you can add a new image to the list. You can load files in the formats JPEG, BMP, GIF, and PNG. |
5 |
|
Click on an entry in the list to highlight the image. Click on the ARROW UP SYMBOL to move the image one place up in the list. |
6 |
|
Click on an entry in the list to highlight the image. Click on the ARROW DOWN SYMBOL to move the image one place down in the list. |
7 |
|
Click on an entry in the list to highlight the image. Click on the DELETE SYMBOL to delete the image. |
8 |
IMAGE PATH |
This field shows the file name of the highlighted file. The prefix [stream] means that the image has been saved to the application memory and not in a file on the hard drive. |
9 |
CENTER IMAGE |
Tick this box to center the image inside the Dashboard element window. |
10 |
PROPORTIONAL |
Tick this box to configure the image proportionally to the size of the Dashboard element window. Please note that the graphic will only be configured to its maximum size if STRETCH is not enabled. |
11 |
STRETCH |
Tick this box to configure the image to the size of the Dashboard element window. Please note that the image will be distorted if PROPORTIONAL is not enabled. |
12 |
SHOW ANIMATION |
Tick this box if you want to display animated GIF images. |
13 |
USE DISPLAY CONDITION |
Tick this box to enable use of a display condition. Untick the box to ensure the image is always displayed. The image is overwritten when the display condition for another image is fulfilled. For this case, it is best if the image occupies the bottom place in the list. |
14 |
COMPARE TO SOURCE 2 VALUE |
Tick this box if you want to compare the Source 1 value with the Source 2 value. Untick the box if you only want to evaluate the Source 1 value. |
15 |
SOURCE 1 VALUE |
Select the operator and enter a comparison value |


5.10. Conditional text
The Dashboard element CONDITIONAL TEXT enables you to display different texts using configurable conditions.
-
Right-click on the Dashboard element CONDITIONAL TEXT.
-
Click on the context menu item CONFIGURE ….
✓ The configuration dialog for the Dashboard element opens.
5.10.1. General Tab
See chapter General Tab.
5.10.3. Text Tab
Configure the display conditions for texts.
| In the top area there is a list of all configured texts and a brief summary of the relevant parameters. The order in the list determines which text is actually shown. If one or more conditions are met, the text that is furthest up the list will always be shown. |
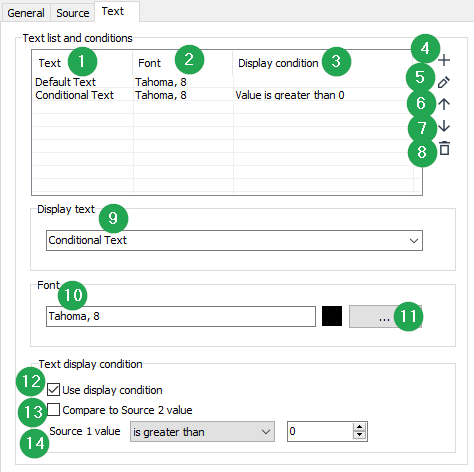
| # | Item | Description |
|---|---|---|
1 |
TEXT |
Shows the text to be displayed. |
2 |
FONT |
Shows the font and font size of the text to be displayed. |
3 |
DISPLAY CONDITION |
Shows what conditions are necessary for the corresponding text to be displayed. |
4 |
|
In the field Display text, define the text you want by entering the text or selecting a text from the list of already available texts. Click on the PLUS SYMBOL to add the text to the list. |
5 |
|
Highlight a text in the list. Alter the text in the field DISPLAY TEXT. Click on the EDIT SYMBOL to adopt the change in the text to be displayed. |
6 |
|
Click on an entry in the list to highlight the text. Click on the ARROW UP SYMBOL to move the text one place up in the list. |
7 |
|
Click on an entry in the list to highlight the text. Click on the ARROW DOWN SYMBOL to move the text one place down in the list. |
8 |
|
Click on an entry in the list to highlight the text. Click on the DELETE SYMBOL to delete the text. |
9 |
DISPLAY TEXT |
Enter a new text. Click on the PLUS SYMBOL. The new text is then saved to the list. Edit a text and click on the EDIT SYMBOL. The edited text is then saved to the list. |
10 |
FONT |
This field shows the current font and font size for the text to be displayed which you can define in the DISPLAY TEXT field. |
11 |
[…] |
Click on the […] button to open the Font dialog. |
12 |
USE DISPLAY CONDITION |
Tick this box to enable use of a display condition. Untick the box to always display the text. The text is overwritten when the display condition for another text is met. For this case, it is best if the text occupies the bottom place in the list. |
13 |
COMPARE TO SOURCE 2 VALUE |
Tick this box if you want to compare the Source 1 value with the Source 2 value. Untick the box if you only want to evaluate the Source 1 value. |
14 |
SOURCE 1 VALUE |
Select the operator and enter a comparison value |

5.11. CAN Monitor
The CAN MONITOR Dashboard element enables the display of received CAN messages.
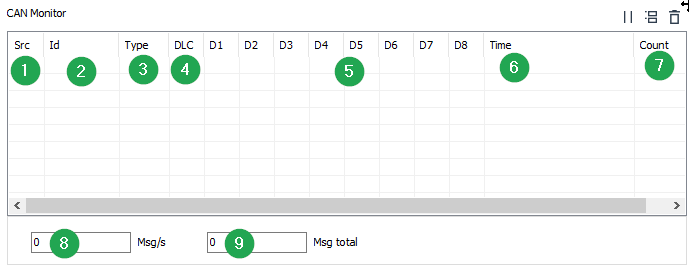
| # | Item | Description |
|---|---|---|
1 |
SRC |
CAN channel |
2 |
ID |
CAN ID |
3 |
TYPE |
11-/29-bit message |
4 |
DLC |
Number of data bytes |
5 |
D1 … D8 |
Message content |
6 |
TIME |
Message timestamp |
7 |
COUNT |
Number of messages with the same CAN-ID (only shown when RELATIVE MODE is enabled in the Monitor tab element) |
8 |
Msg/s |
Number of messages received per second |
9 |
Msg total |
Total number of received messages |
-
Right-click on the Dashboard element CONDITIONAL TEXT.
-
Click on the context menu item CONFIGURE ….
✓ The configuration dialog for the Dashboard element opens.
5.11.1. General Tab
See chapter General Tab.
5.11.2. Monitor Tab
Configure the reception and display of the CAN messages for the CAN Monitor element.
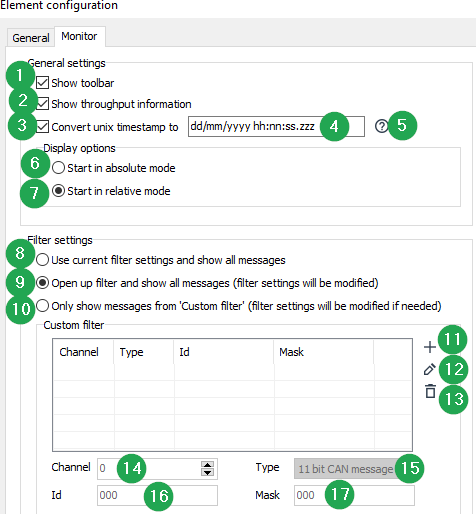
| # | Item | Description |
|---|---|---|
1 |
SHOW TOOLBAR |
Tick the box to display the toolbar |
2 |
SHOW THROUGHPUT INFORMATION |
Tick the box to display MSG/S (messages per second) and MSG TOTAL (number of messages received). |
3 |
CONVERT UNIX TIMESTAMP |
Tick the box to convert the timestamp into a readable format. |
4 |
[DD/MM/YYYY HH:NN:SS.ZZZ] |
Enter the values for date and time. |
5 |
|
Click on the button to display an overview of the possible entry formats for date and time. |
6 |
START IN ABSOLUTE MODE |
Each CAN message appears in a new line. |
7 |
START IN RELATIVE MODE |
All CAN messages with an identical CAN ID are grouped and shown in one line. When a new CAN message arrives, the new CAN message overwrites the CAN message last received. A counter shows the total number of CAN messages received for each CAN-ID. |
8 |
USE CURRENT FILTER SETTINGS AND SHOW ALL MESSAGES |
The Monitor does not change the filter settings. The Monitor only shows CAN messages enabled by the current filter settings. |
9 |
OPEN UP FILTER AND SHOW ALL MESSAGES (FILTER SETTINGS WILL BE MODIFIED) |
The Monitor opens all filters and shows all CAN messages.. |
10 |
ONLY SHOW MESSAGES FROM ‘CUSTOM FILTER’ (FILTER SETTINGS WILL BE MODIFIED IF NEEDED) |
If you select the option ONLY SHOW MESSAGES FROM 'CUSTOM FILTER', you can define your own filters in the CUSTOM FILTER area below. |
11 |
|
Click on the button to add a new filter. |
12 |
|
Click on the button to alter the currently selected filter. |
13 |
|
Click on the button to delete an existing filter from the list. |
14 |
CHANNEL |
Define the CAN channel. |
15 |
TYPE |
In the TYPE field, define whether the message is an 11 or a 29-bit message. |
16 |
ID |
Enter the identifier of the CAN message. |
17 |
MASK |
Enter a value for the filter MASK (e.g. 7FF for 11bit and 1FFFFFFF for 29bit CAN messages). |


6. Display Types of a DBS file
When you create a DBS file, you have two options for displaying the Dashboard elements. As a standard, the elements are shown on the surface of the Dashboard when they are newly created.
Right-click on a Dashboard element to alter the arrangement and depiction.
6.1. Undock/Dock
-
Click on the context menu item UNDOCK.
✓ The element window is undocked from the Dashboard surface and can be freely positioned on the desktop.
-
Right-click on the freely positionable Dashboard element.
-
Click on the context menu item DOCK.
✓ The Dashboard element window is docked on the Dashboard surface.
6.2. Lock/Unlock
-
Click on the context menu item LOCK.
✓ The position and size of the element window are locked (only when Edit mode is disabled). The title bar and frame of the element window are hidden. The LOCK function is especially useful for DBS files with a lot of elements.
-
Right-click on the locked Dashboard element.
-
Click on the context menu item UNLOCK.
✓ The Dashboard element window is displayed with its own title bar and border.
6.3. Move To Top/Move To Bottom
You can move Dashboard elements into the foreground or the background.
-
Right-click on a Dashboard element.
-
Click on the context menu item MOVE TO TOP.
✓ The Dashboard element moves into the foreground.
-
Right-click on a Dashboard element.
-
Click on the context menu item MOVE TO BOTTOM.
✓ The Dashboard element moves into the background.
7. Copy and Paste of Dashboard Elements
You can copy and paste Dashboard elements with all their settings.
-
Click on a Dashboard element to select it.
✓ The Dashboard element is shown with a blue background.
To select several elements, press and hold the Ctrlkey and click on all the Dashboard elements you want to copy.Press the keys Ctrl+Ato select all the Dashboard elements in the currently active tab. -
Press the keys
Ctrl+Cto copy the selection. Alternatively, right-click on a highlighted Dashboard element and click on the context menu item COPY. -
Press the keys
Ctrl+Vto paste the copied Dashboard elements into another tab. Alternatively, right-click on the name of the tab you want to paste the Dashboard elements into and click on the context menu item PASTE.If you have opened a second instance of Remote Service Tool, you can also insert the copied Dashboard elements into a tab element in the second Remote Service Tool instance. When copied Dashboard elements to a separate instance of the Remote Service Tool, the Merge Text Entries window opens. Here you can merge the texts used with already existing texts, or enter new texts.
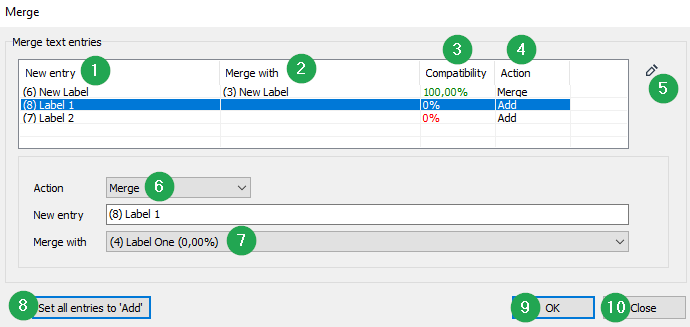
7.1. Merge Text Entries
The list contains all the texts that are transferred in a copying process.
The application first searches for existing texts and tries to merge the new texts with existing texts.
| The Merge Text Entries only appears when copying Dashboard elements to another instance of the Remote Service Tool. |
| # | Item | Description |
|---|---|---|
1 |
NEW ENTRY |
Displays the ID and the text created by copying. |
2 |
MERGE WITH |
Displays the ID and the text with which this text is merged. |
3 |
COMPATIBILITY |
Displays the compatibility of the new text with the old text. If several languages are implemented and a text only exists in one of the languages, full compatibility is not achieved. If the text is not found at all, it is completely newly entered. Click on an entry in the list to highlight the entry. In the area MERGE WITH, select which text you want to merge the entry with. |
4 |
ACTION |
Shows whether the entry is to be merged or newly entered. |
5 |
|
Click on the EDIT SYMBOL to manually enter a merge into the list. |
6 |
ACTION CHOICE |
Choose between Add or Merge. |
7 |
MERGE WITH CHOICE |
Select the second text entry for the merge. |
8 |
SET ALL ENTRIES TO ADD |
Click on the SET ALL ENTRIES TO ADD button to set all elements in the list to ADD. |
9 |
OK |
Click on the OK button to copy all elements according to the settings. |
10 |
CLOSE |
Attention! If you click on this button, all elements in the list will be set to ’ADD’ and copied without taking account of settings previously made. |
8. Filtering Data in the Communication Gateway
The Remote Service Tool supports various communication gateways for reading off CAN bus information from the target device. Not every communication gateway has a transmission bandwidth that enables 100% of the CAN bus information to be transmitted to the software.
The CAN filters of the application are written to the volatile memory(RAM) when the Remote Service Tool established the connection to the gateway device. These settings are active until the filters are overwritten by new filters, or when the device is rebooted.
| Not every CAN bus information has an effect on the diagnosis application. A DBS file can be created and saved with filter settings appropriate for the diagnosis application to the communication gateway used. Alternatively, you can manually configure the filter settings if e.g. a different communication gateway is used. |
| For normal operation it is recommended to enable Auto filter (global) as optimal setting for the CAN receive filters. In rare applications, however, it may be necessary to Configure Manual CAN Receive Filter. |
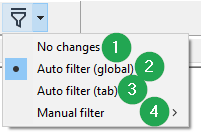
-
Click on the filter settings icon filter icon
.
| # | Option | Description |
|---|---|---|
1 |
NO CHANGES |
If you enable the filter setting NO CHANGES, no filter settings are loaded to the communication gateway at the start of a realtime data session. If available, the filter settings last used or configured in the communication gateway are used. If no filter settings are available, the data is read off without filters. |
2 |
AUTO FILTER (GLOBAL) |
Enable the filter setting AUTO FILTER (GLOBAL) to optimize the filters for all tabs of the opened DBS file. The greater the number of tabs, the more CAN bus information is read in. If too much CAN bus information is transmitted, the bandwidth on the selected communication path may be exceeded. |
3 |
AUTO FILTER (PER TAB) |
Enable the filter setting AUTO FILTER (PER TAB) to optimize the filters for the currently selected tab of the open DBS file. If you switch to another tab, the filters are again optimized and transmitted to the communication gateway. The more elements there are under the active tab, the longer the switching between the individual tab elements takes. |
4 |
MANUAL FILTER |
Enable the filter setting MANUAL FILTER to configure the filter manually. Use the menu OPTIONS→SETTINGS→FILTER SETTINGS to configure the filters. See Configure Manual CAN Receive Filter. |
9. Creating and Editing Multi-Language Projects
The texts which are used in the Remote Service Tool application are saved in a language table. Click in the menu bar on PROJECT→EDIT MODE ENABLED to enable edit mode.
-
Click in the menu bar on PROJECT→EDIT MODE ENABLED to enable edit mode.
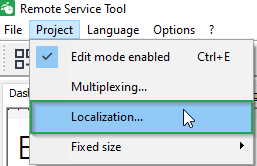
-
Click in the menu bar on PROJECT→LOCALIZATION.
✓ This opens the language table in the LOCALIZATION window.
✓ All the texts used are listed in the language table. The languages are managed in separate columns.
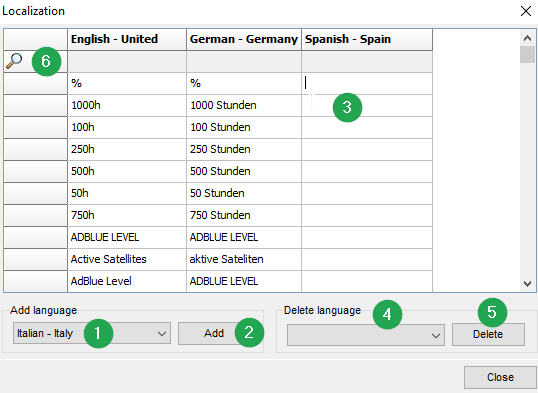
| # | Item | Description |
|---|---|---|
1 |
ADD LANGUAGE |
Choose a new language. |
2 |
ADD |
Click on the button ADD to create a new column for the selected language. |
3 |
EDITING LANGUAGE ENTRIES |
Add or change the translated text for the individual entries. |
4 |
DELETING LANGUAGE |
Select the language which needs to be deleted. |
5 |
DELETE |
Click this button to delete the selected language. |
6 |
|
In the row with the magnifying glass, enter the search text in the relevant language column. The language table is then truncated. Only the rows that meet the search criteria are shown. |

10. The Multiplex Solution
The Remote Service Tool applications can also be developed as multiplex applications. This is useful when the transmission bandwidths for the CAN messages to be displayed are limited, e.g. when you use CANlink mobile. In multiplex applications, CAN messages contain different information at different times. The information transmitted can be displayed by various Dashboard elements in various tabs. During multiplexing, the tabs are automatically switched when corresponding CAN messages are being received.
-
Click in the menu bar on Project Edit MODE→ENABLED to enable edit mode.
-
Click in the menu bar on PROJECT→Multiplexing.
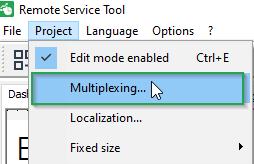
✓ This opens the window APPLICATION SETTINGS.
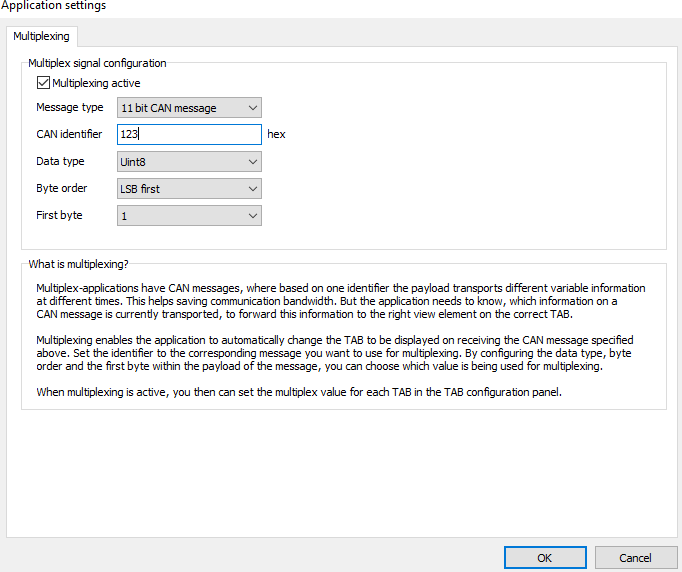
✓ You can configure a Dashboard application as a multiplex application in the window APPLICATION SETTINGS in the tab MULTIPLEXING.
-
Tick the box MULTIPLEXING ACTIVE to enable multiplexing.
-
Configure the relevant CAN message as a multiplex message.
✓ When a multiplex message is received, the system automatically switches to the tab whose value was received for the multiplex configuration. All CAN messages are depicted in the active tab.
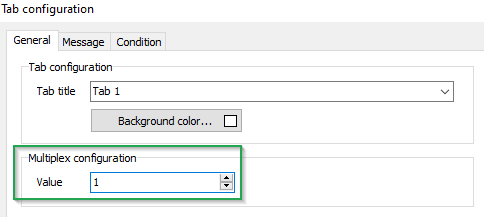
To determine which tab is shown when the multiplex message is received, use the additional value MULTIPLEX CONFIGURATION to configure the tab.
| The MULTIPLEX CONFIGURATION value is only visible and configurable when the application has been configured as a multiplex application. |
| CAN messages can only be displayed in a tab when the dashboard application has received the defined multiplex message. CAN messages are rejected until the first multiplex message is received. |
11. Extended Functionality
Additional advanced features are described here.
11.1. Analyze CAN Traffic and Verification of Configuration
This chapter describes the required steps to configure a CAN Monitor element and connect your communication gateway to record a CAN trace.
Furthermore this chapter is aimed to describe a procedure to replay the CAN trace for verification of a specific configuration file or offline analysis of the recorded CAN trace with the CAN monitor.
11.1.1. Create Remote Service Tool Configuration with CAN Monitor
-
Make sure that the latest version of the Remote Service Tool from the Download Center is installed on your pc.
-
Start the Remote Service Tool software.
✓ The software is started with a blank project.
-
Make sure that in menu Project → Edit mode enabled (Ctrl+E) is active.
-
Right mouse click in the Main tab.
-
Click on Add element.
-
Select CAN Monitor from the available elements.
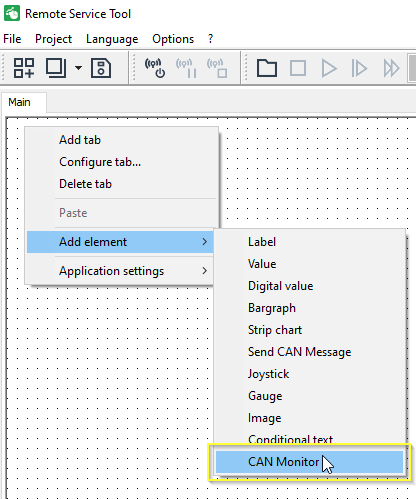
✓ The CAN Monitor element is added to the main tab of your Remote Service Tool configuration.
-
Right click on the new CAN Monitor element and click on configure.
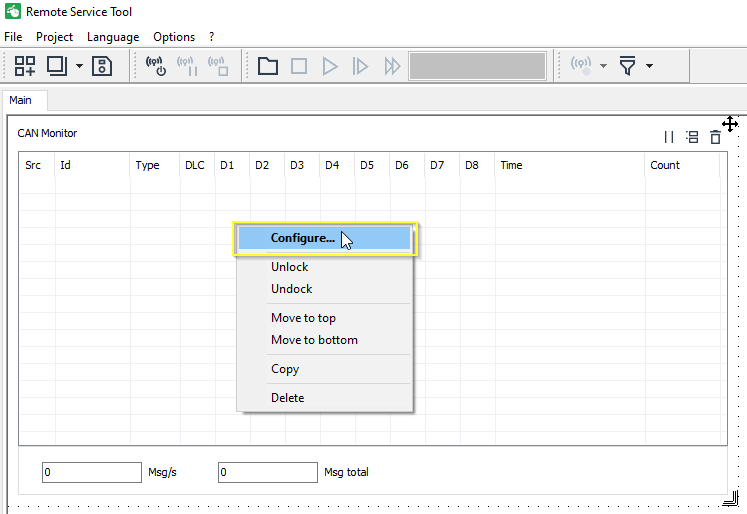
✓ The configuration dialog for the CAN Monitor element is opened.
-
Click on Monitor.
-
Enable the radio button at Open up filter and show all messages.
-
Click on Ok.
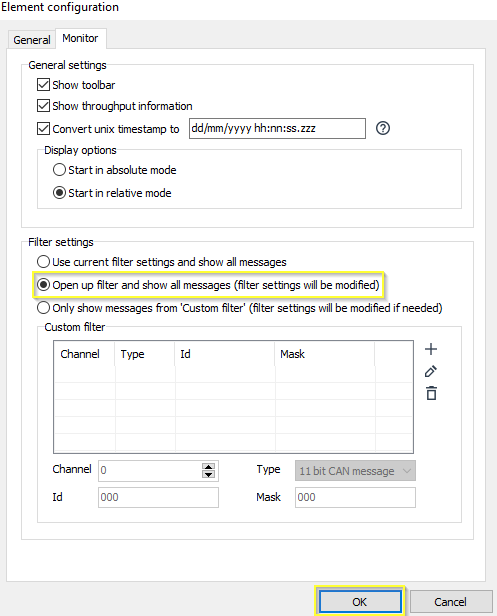
✓ The CAN Monitor element is configured to receive all CAN messages which are present at the connected CAN bus.
In case that you want to reduce the transmitted data volume and focus onto specific messages only, you can optionally configure the Custom filter settings*. -
Click on the filter settings icon
. -
Select Auto filter (global).
-
Click on Save (Ctrl+S) to save the configuration as *.dbs file for further tests.
11.1.2. Create CAN Trace with CAN Monitor
-
Make sure that the latest version of the Remote Service Tool from the Download Center is installed on your pc.
-
Start the Remote Service Tool software.
✓ The software is started with a blank project.
-
Click on File → Open (Ctrl+O).
-
Open the Remote Service Tool configuration file (*.dbs) with the settings as described in chapter Create Remote Service Tool Configuration with CAN Monitor.
-
Click on the connection settings icon
. -
Select communication path Internet.
In this example a connection to a CANlink® mobile is shown. This procedure can be adapted to other communication gateways in the same manner. When establishing a connection to a local CAN-PC gateway, the Find machines work steps are not applicable. -
Enter the login credentials from your DataPlatform user.
-
Click on Find machines.
-
Select the corresponding machine.
-
Click OK.
✓ The connection is being established and the CAN receive filter is written to the device.
-
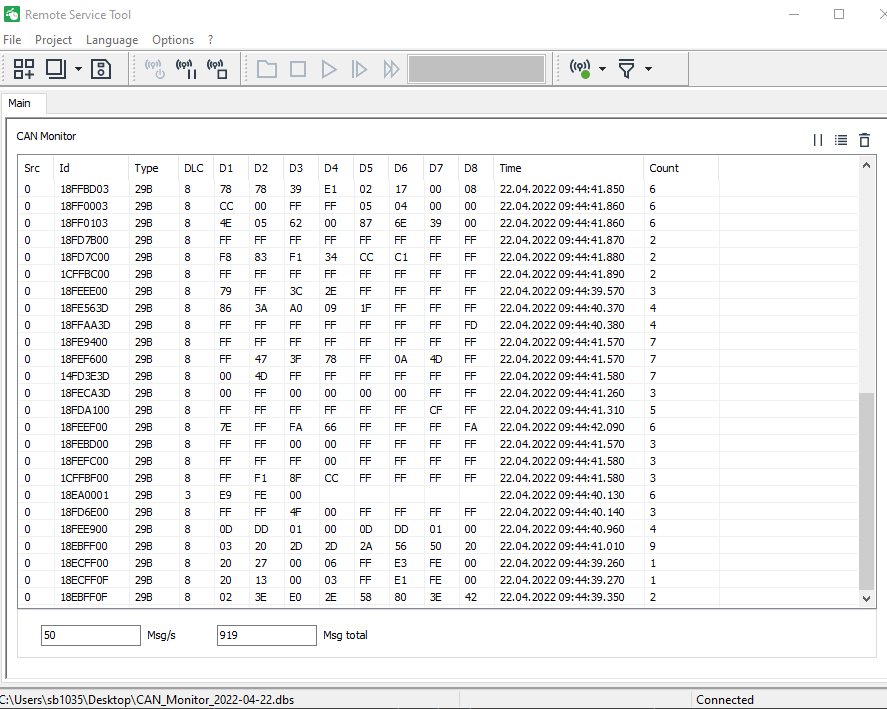
Observe the CAN Monitor element. Make sure that the messages of interest are recorded.
✓ The current CAN traffic of the connected vehicle is displayed at the CAN monitor.
-
Click on the disconnect icon
 .
.
11.1.3. Replay of CAN Trace
In some cases it may necessary to replay the recorded CAN trace to perform a verification of a specific configuration file.
You can also just analyze the CAN trace with the CAN monitor element after the session was stopped and the machine is not online anymore.
-
Make sure that the latest version of the Remote Service Tool from the Download Center is installed on your pc.
-
Start the Remote Service Tool software.
✓ The software is started with a blank project.
-
Click on File → Open (Ctrl+O).
-
Open the Remote Service Tool configuration file (*.dbs) which needs to be verified.
Optional you can also just use a configuration file (*.dbs) with the CAN Monitor element for the replay to analyze the CAN trace. For further details refer to Create Remote Service Tool Configuration with CAN Monitor. -
Click on the folder icon
 .
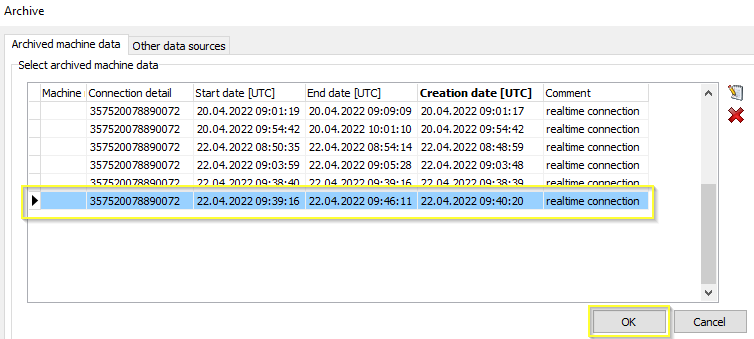
. -
Select the corresponding archive from the list.
-
Click on OK.
-
Click on Play
 .
.✓ The replay of the CAN trace is started and the values for the specific signals are displayed within the individual configuration elements.
-
Click on Pause
 when a signal of interest appears in the dashboard.
 -
Optional use the Step forward
 or Fast forward
  function to get to the required range within the CAN trace.
 -
Click on Stop
 to end the replay.
11.2. Configure Manual CAN Receive Filter
The CAN filters of the application are written to the volatile memory(RAM) when the Remote Service Tool establishes the connection to the CAN interface device. These settings are active until the filters are overwritten by new filters, or when the device is rebooted.
For normal operation it is recommended to enable Auto filter (global) as optimal setting for the CAN receive filters. In rare applications, however, it may be necessary to configure Manual filters. So this chapter is intended to give a brief introduction to the manual filter settings.
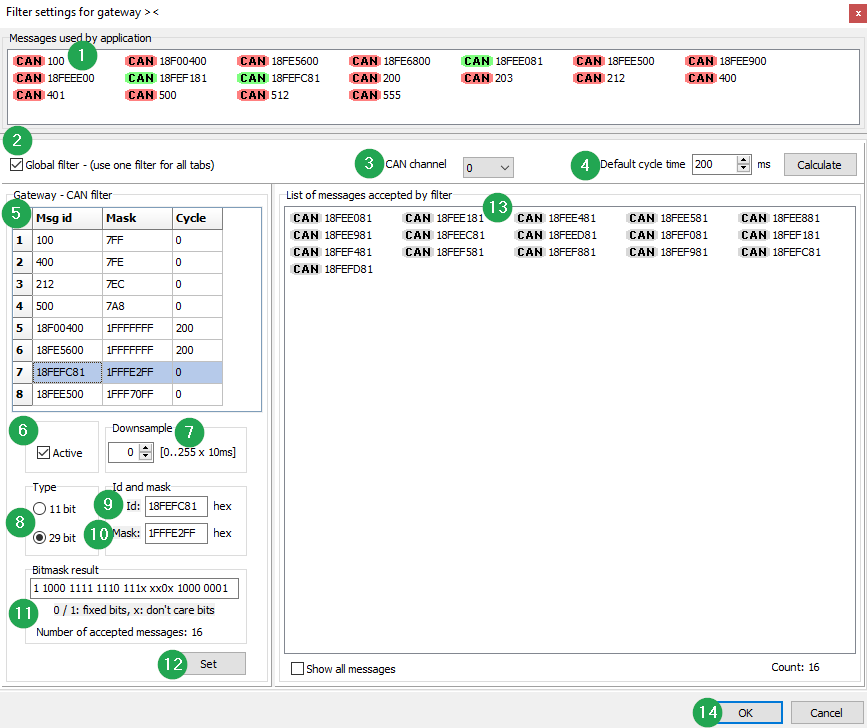
| # | Item | Description |
|---|---|---|
1 |
MESSAGES USED BY APPLICATION |
Shows an overview of the CAN message identifiers which are used in the active DBS file. |
2 |
GLOBAL FILTER |
Tick the box GLOBAL FILTER (USE ONE FILTER FOR ALL TABS) to use one filter for all tabs. This may require a large transmission bandwidth that is not supported by all communication paths. This setting offers the advantage of faster tab switches because it is not necessary to first change the filter settings. |
3 |
CAN CHANNEL |
Select |
4 |
DEFAULT CYCLE TIME |
This is default time when using Downsample is enabled. |
5 |
CAN FILTERS LIST |
This table shows the configured filters. Please note that there is a maximum number of 8 filters per CAN interface available. |
6 |
ACTIVE |
Checkbox must be enabled to enable the configured filter. |
7 |
DOWNSAMPLE |
After a CAN message has passed through the channel, the channel is closed for the configured downsample time, then opened with the same filter configuration. Leave this time set to |
8 |
Message type |
Choose between |
9 |
CAN IDENTIFIER |
Enter the required CAN identifier. |
10 |
Mask |
Enter the filter mask |
11 |
BITMASK RESULT |
Information about the configured filter mask and number of accepted messages is shown here. A binary 0 means that the bit will not be evaluated (don’t care function). A binary 1 means that the corresponding bit of a received CAN message must have the same value as the configured message ID. |
12 |
SET |
Click on this button to apply the settings to the manual filter configuration. |
13 |
LIST OF MESSAGES ACCEPTED BY FILTER |
In this window, all CAN message identifiers are shown that the filter which is highlighted in the GATEWAY – CAN FILTER accepts. |
14 |
OK |
Click on OK when the filter configuration is completed. The window automatically closes and the filter is set to Manual filter |
15 |
CANCEL |
Click on cancel when you want the dismiss and abort manual filter configuration. |
11.2.1. Filter Message 0xCF00400
The following example will show how to define a CAN receive filter for PGN 61444 at the CAN1 interface of the gateway device. Assuming that the priority and source address are not known, the filter mask will ignore the bits for priority and source address.
-
Click on the filter settings icon
. -
Select Manual filter -→ Configure.
-
Configure the manual filter as shown in the table below.
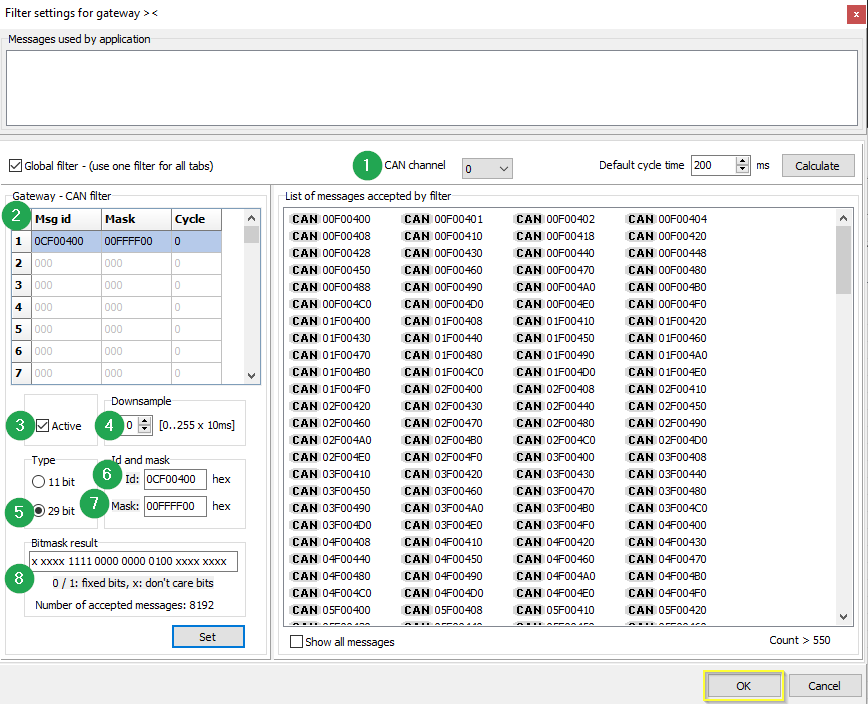 Figure 8. Example: Filter message
0xCF00400:# Item Setting 1
CAN CHANNEL
Select
0for CAN1.2
CAN FILTERS LIST
This table shows the configured filters. Please note that there is a maximum number of 8 filters per CAN interface available.
3
Active
Checkbox must be enabled to activate the configured filter.
4
Downsample
Leave this time set to
0when the filter mask is open for more than one message.5
Message type
Select
29 bit CAN message.6
CAN identifier
Enter CAN identifier
0CF00400for PGN 61444 with priority 0x3 and source address 0x07
Mask
Enter filter mask
00FFFF00to ignore the priority and source address for PGN 61444. If the complete CAN identifier is known, you can also enter1FFFFFFFto receive only this single CAN identifier.8
Bitmask result
Information about the configured filter mask and number of accepted messages is shown here.
-
Click on Set.
-
Click on OK.
-
Save the configuration.
-
Test the filter settings.
✓ Only messages which are allowed to pass the configured filter settings will be transmitted to the Remote Service Tool.
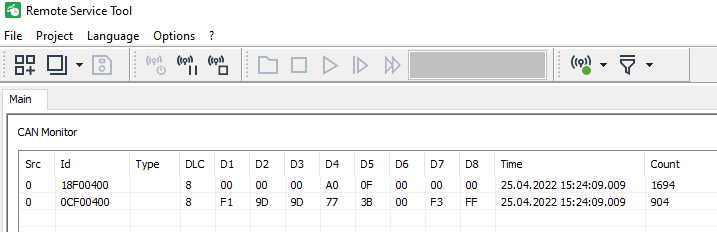
The filter mask allows transmission of CAN identifier 18F00400and0CF00400in this example. -
Stop the session when the required messages are displayed.
11.2.2. Check Performance Monitor
The Performance Monitor provides an overview of the received CAN messages count and their distribution to the active widgets.
Usually the Auto filter (global) calculates the masks for the CAN receive filter so that only the CAN messages which are relevant for the application are transmitted.
-
Click on Options → Performance monitor …
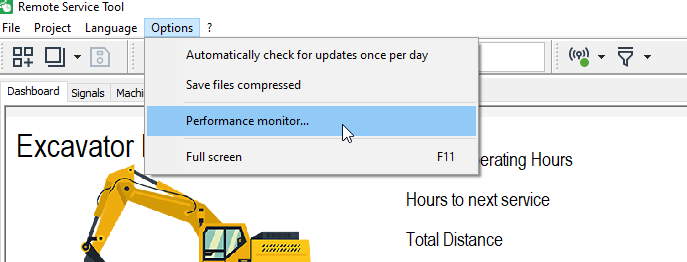
-
Check the number of received messages and their distribution to the active widgets.
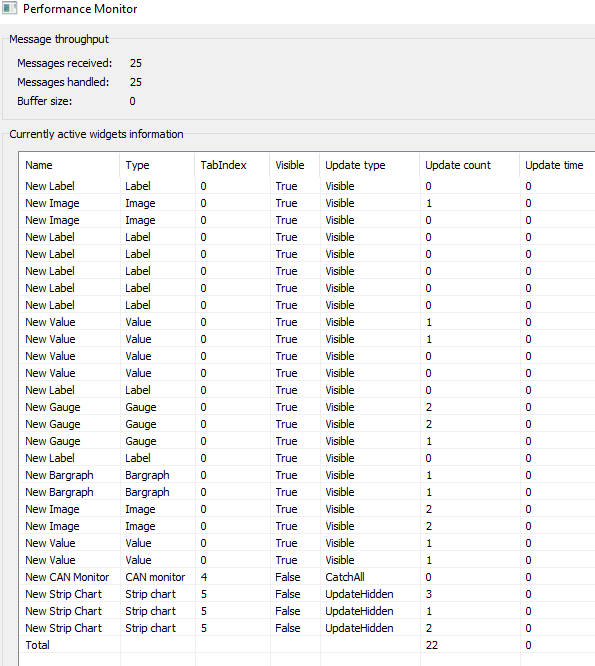
You can also reset the counter in the performance monitor:
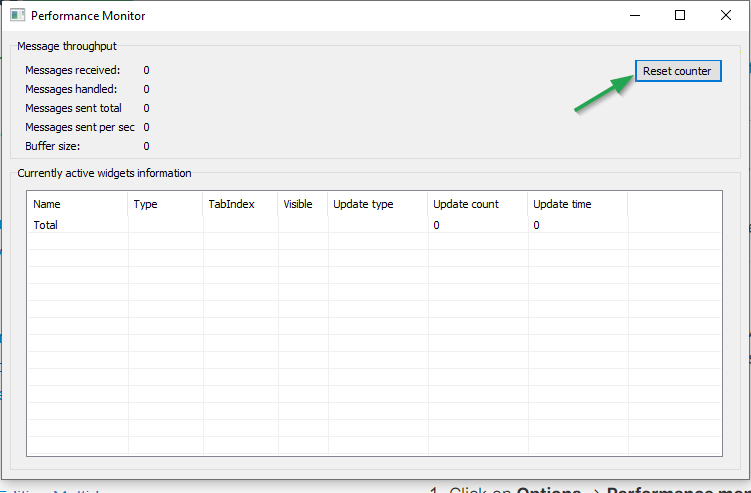
12. Software Update
The Remote Service Tool offers the option to search for software updates.
-
Click in the menu bar on
 → Check for updates.
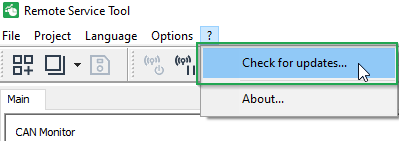
✓ This opens the Software update window.
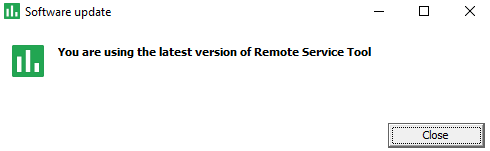
✓ A message about the software version status is displayed.
-
In case that a new version is available, please follow the instructions to perform the update.
| The precondition for the online software update of the Remote Service Tool is an outgoing FTP connection. Ensure the FTP port is open. |
13. Connectivity Check
| In case you are experiencing connectivity issues with the Remote Service Tool, execute the test from the Connectivity Check and get in contact with your local IT administrators when required connections are not OK. |
-
Download the
connectivity-check.exefrom the Connectivity Check web page.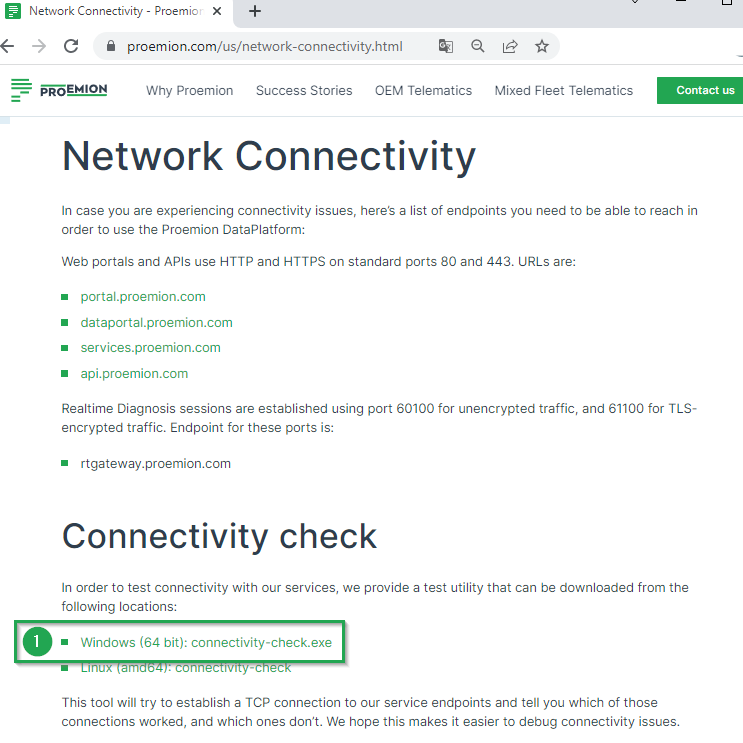
-
Execute the
connectivity-check.exeat the PC with the Remote Service Tool installed.✓ A connectivity test to the Proemion default URLs and ports is done.
-
Ensure that all connections are OK.
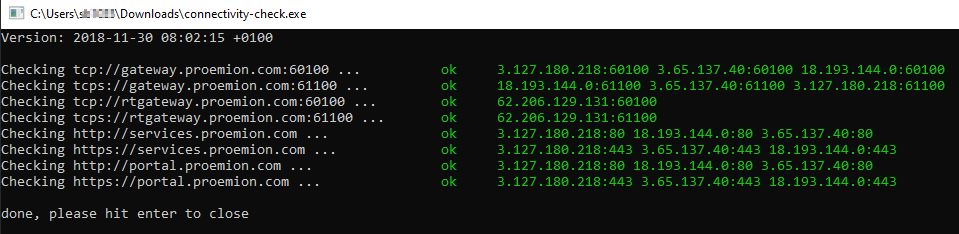 Figure 10. Example of successful Test:
Version: 11.0.988